- Dates
- 1890 – 1990
- Eras
- Modern era
- Concepts
- demographyhistoriography
- Within
- Beaver Island
Summary
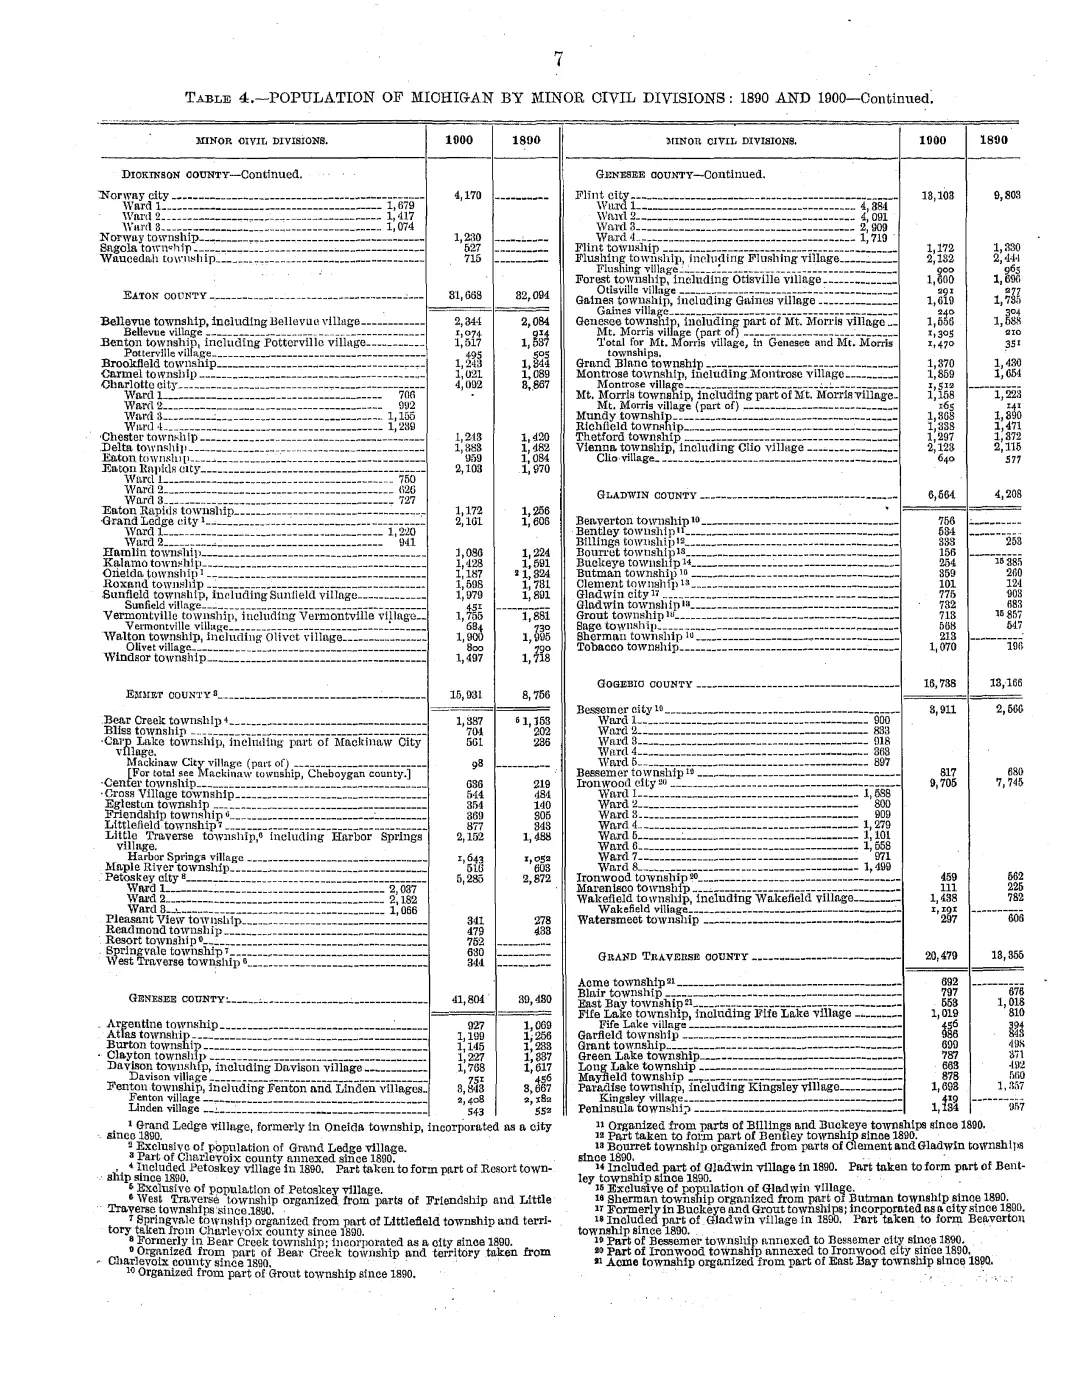
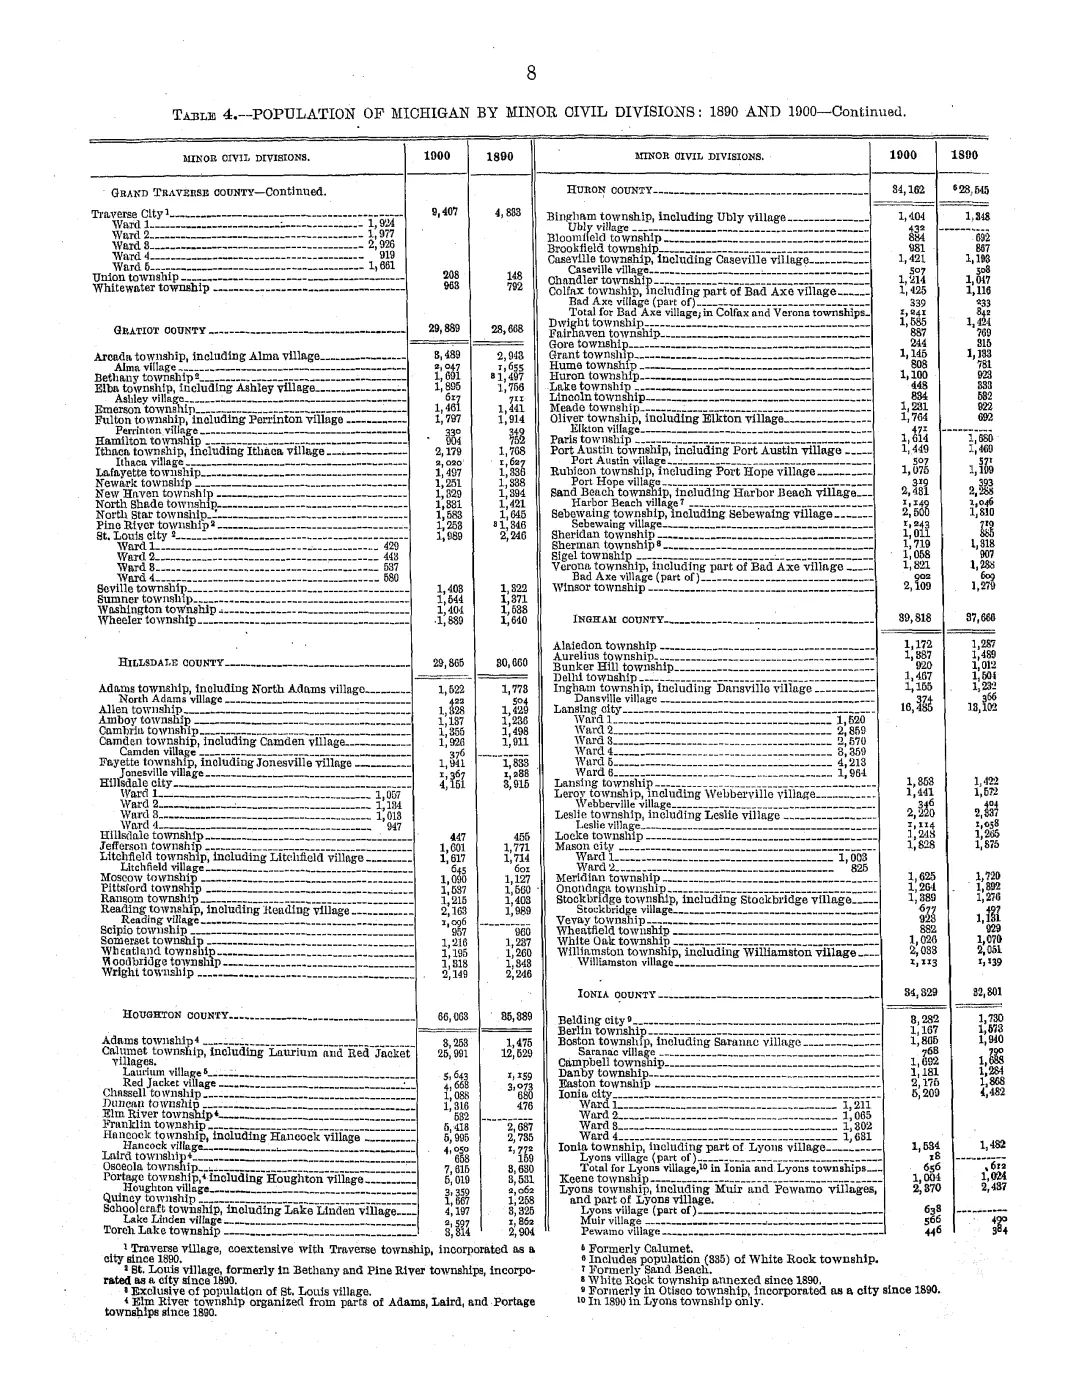
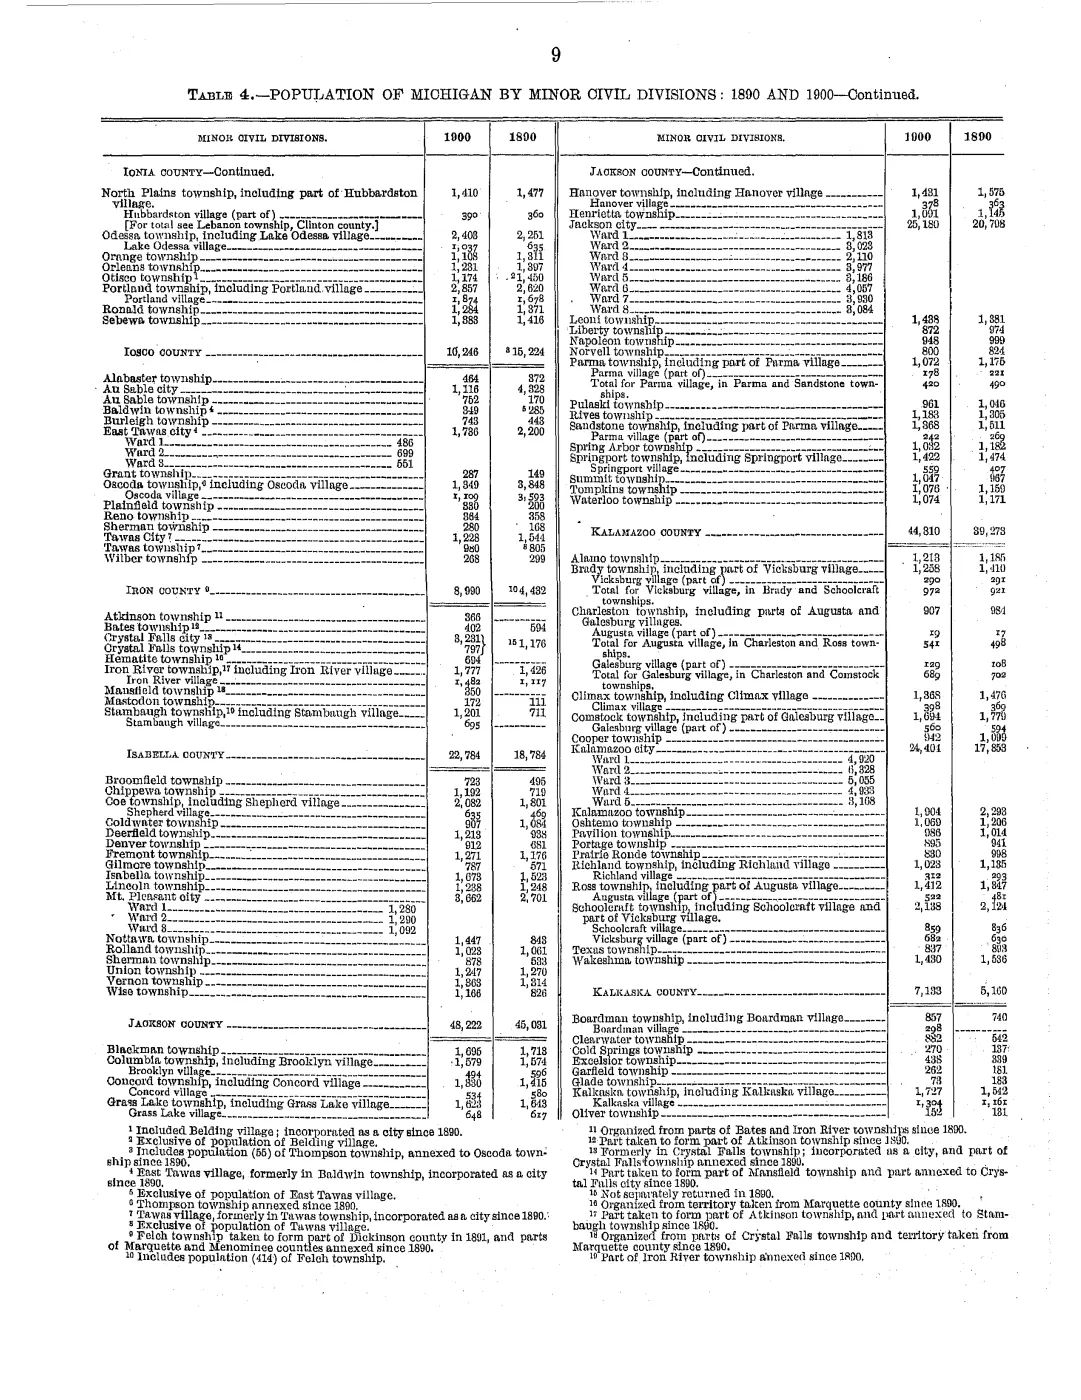
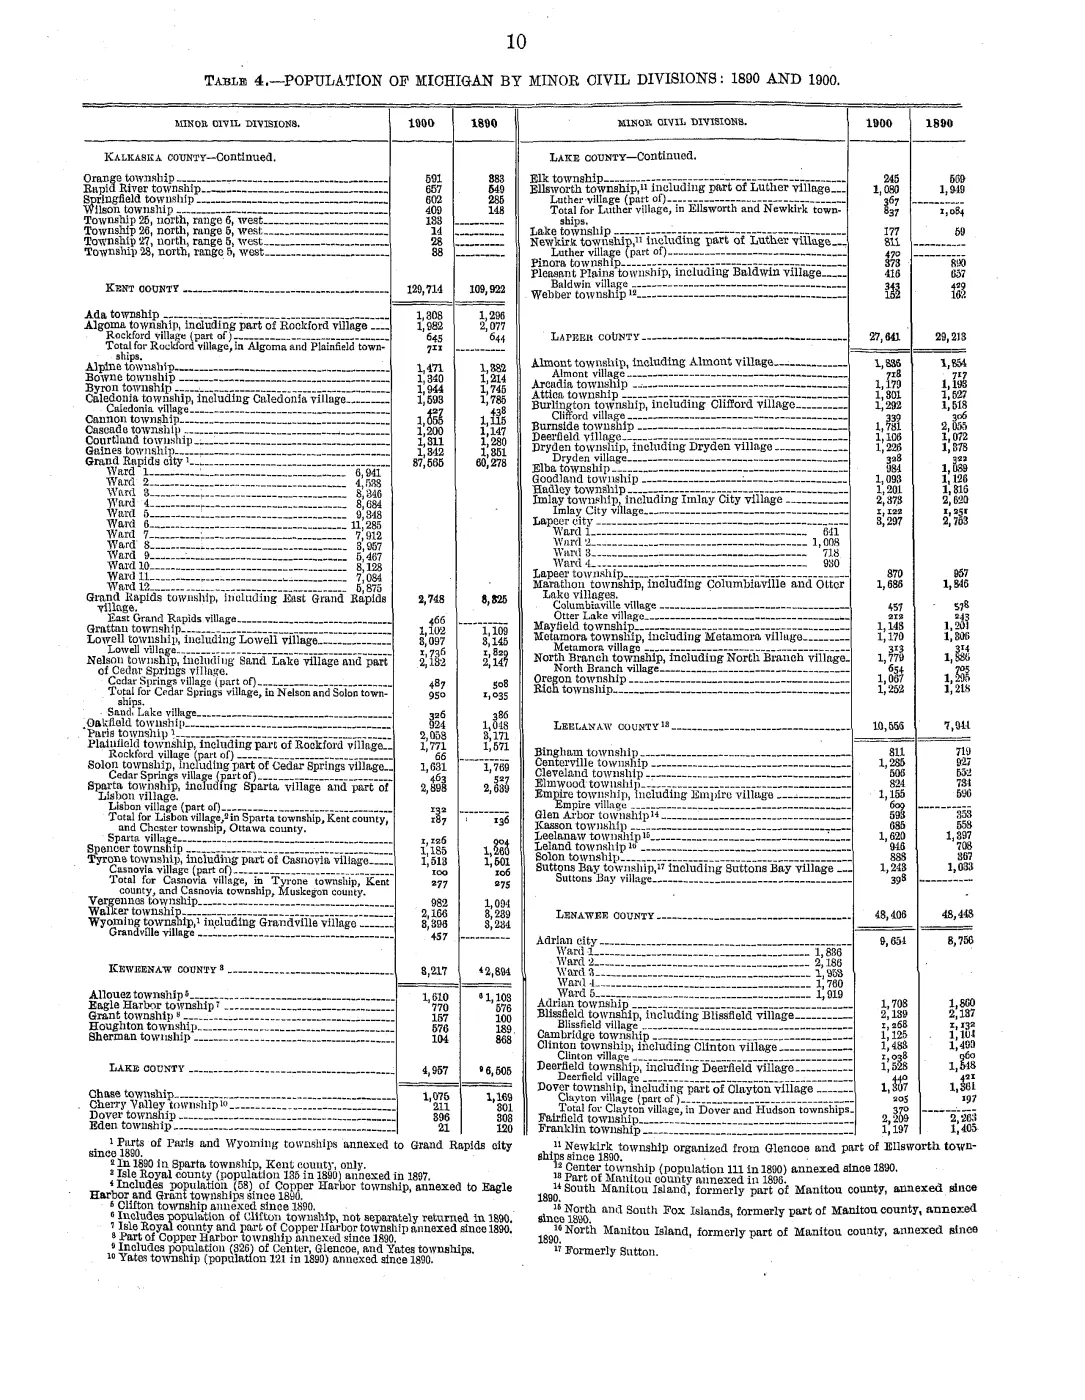
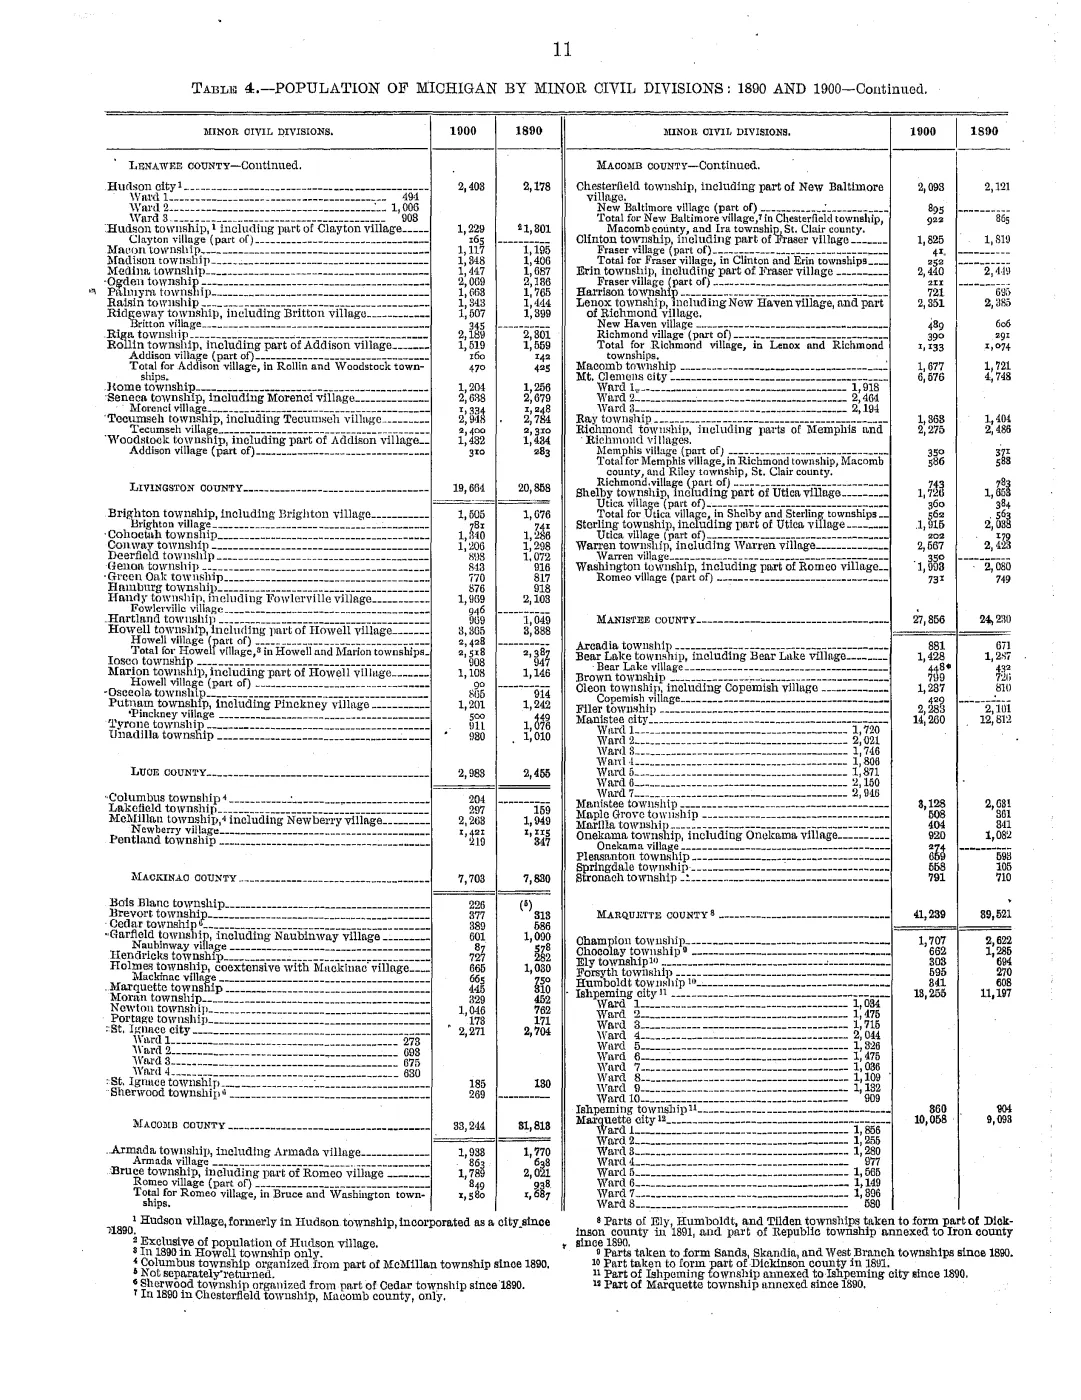
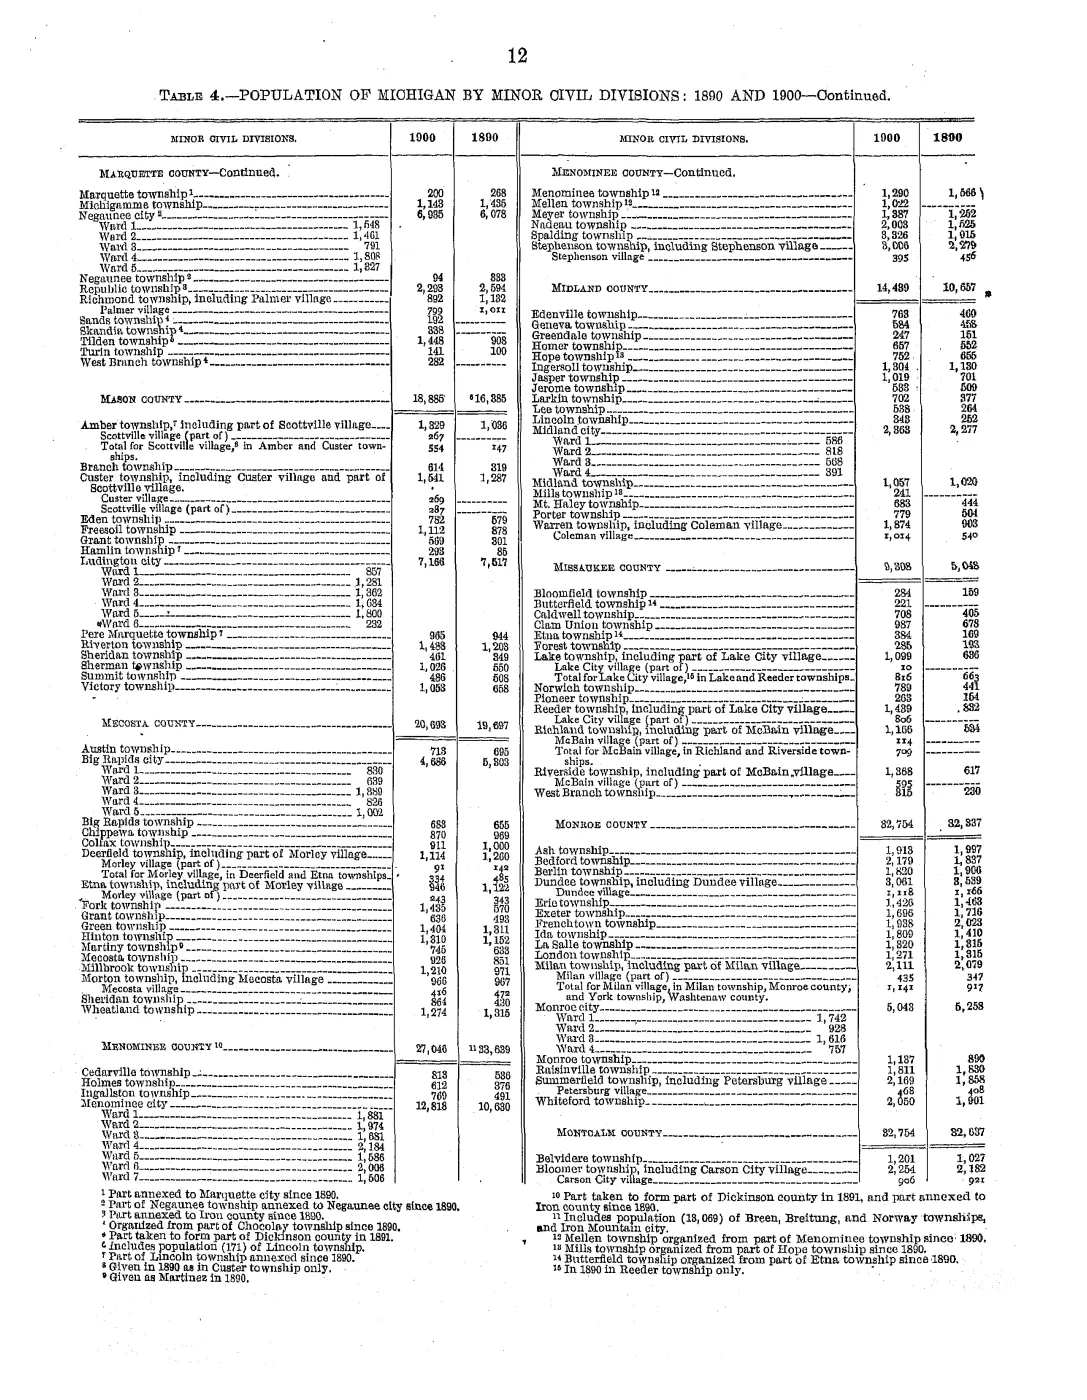
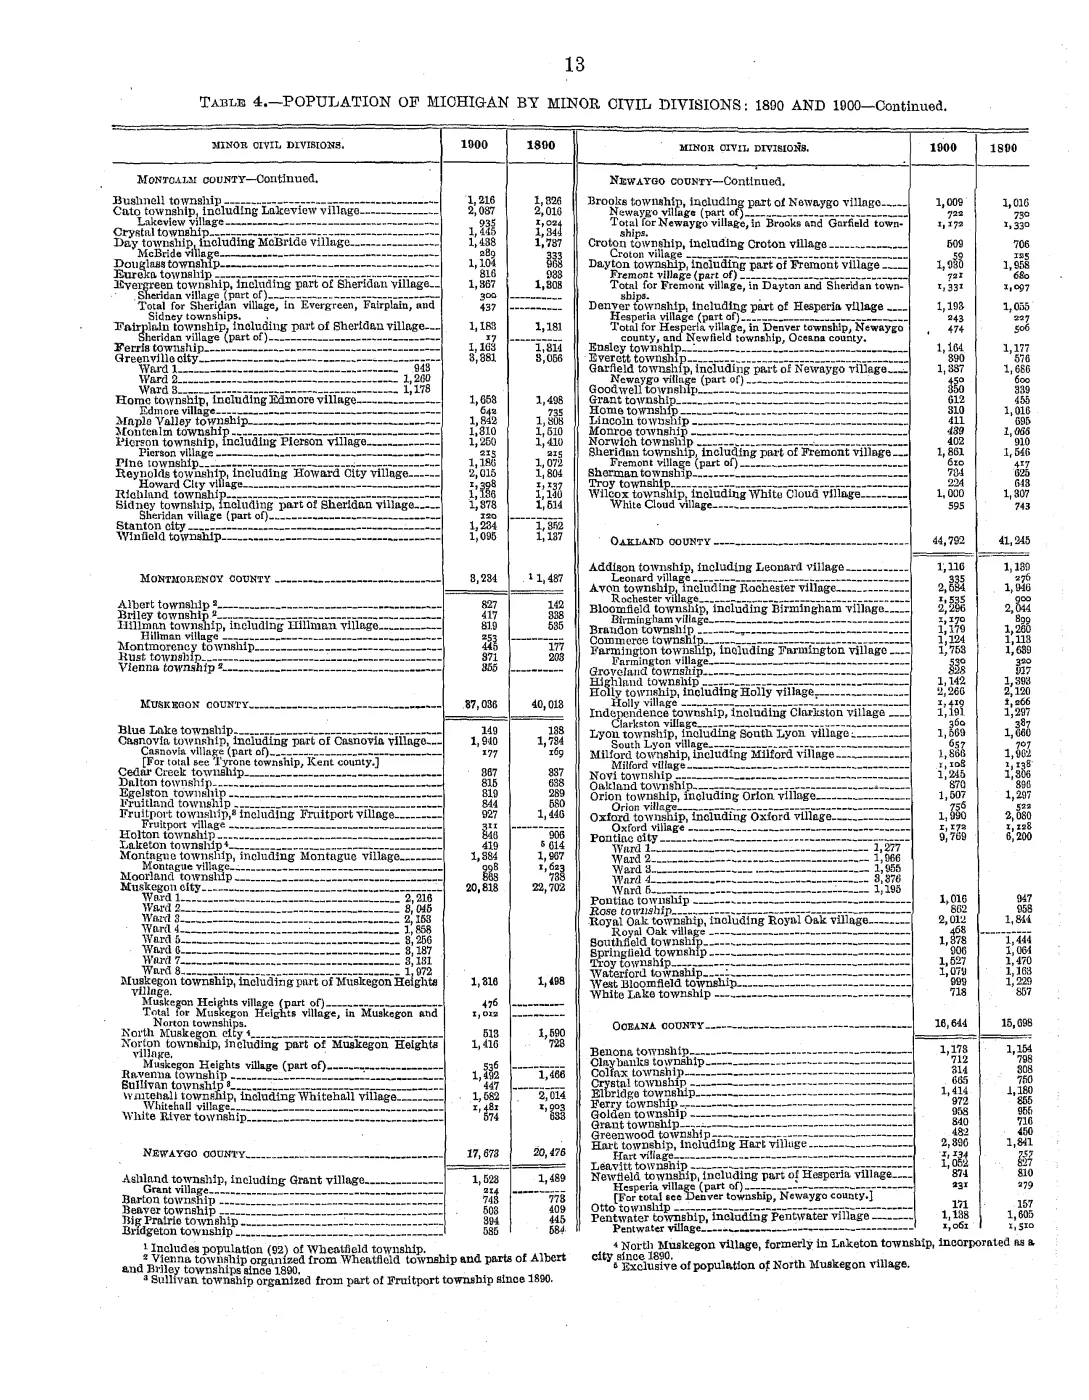
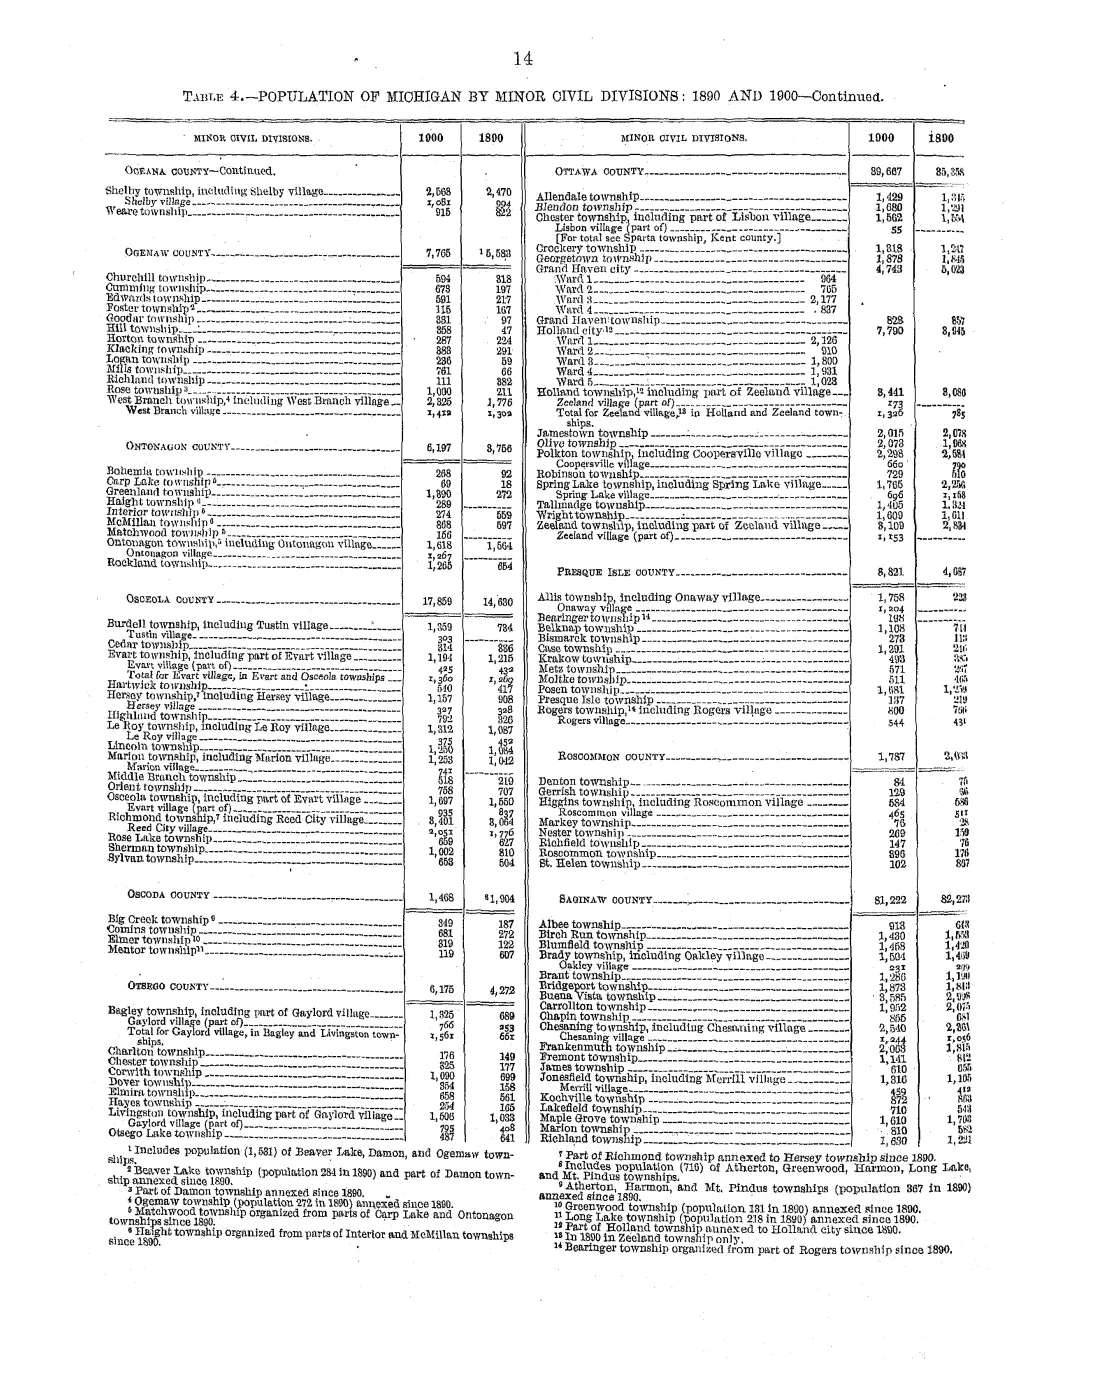
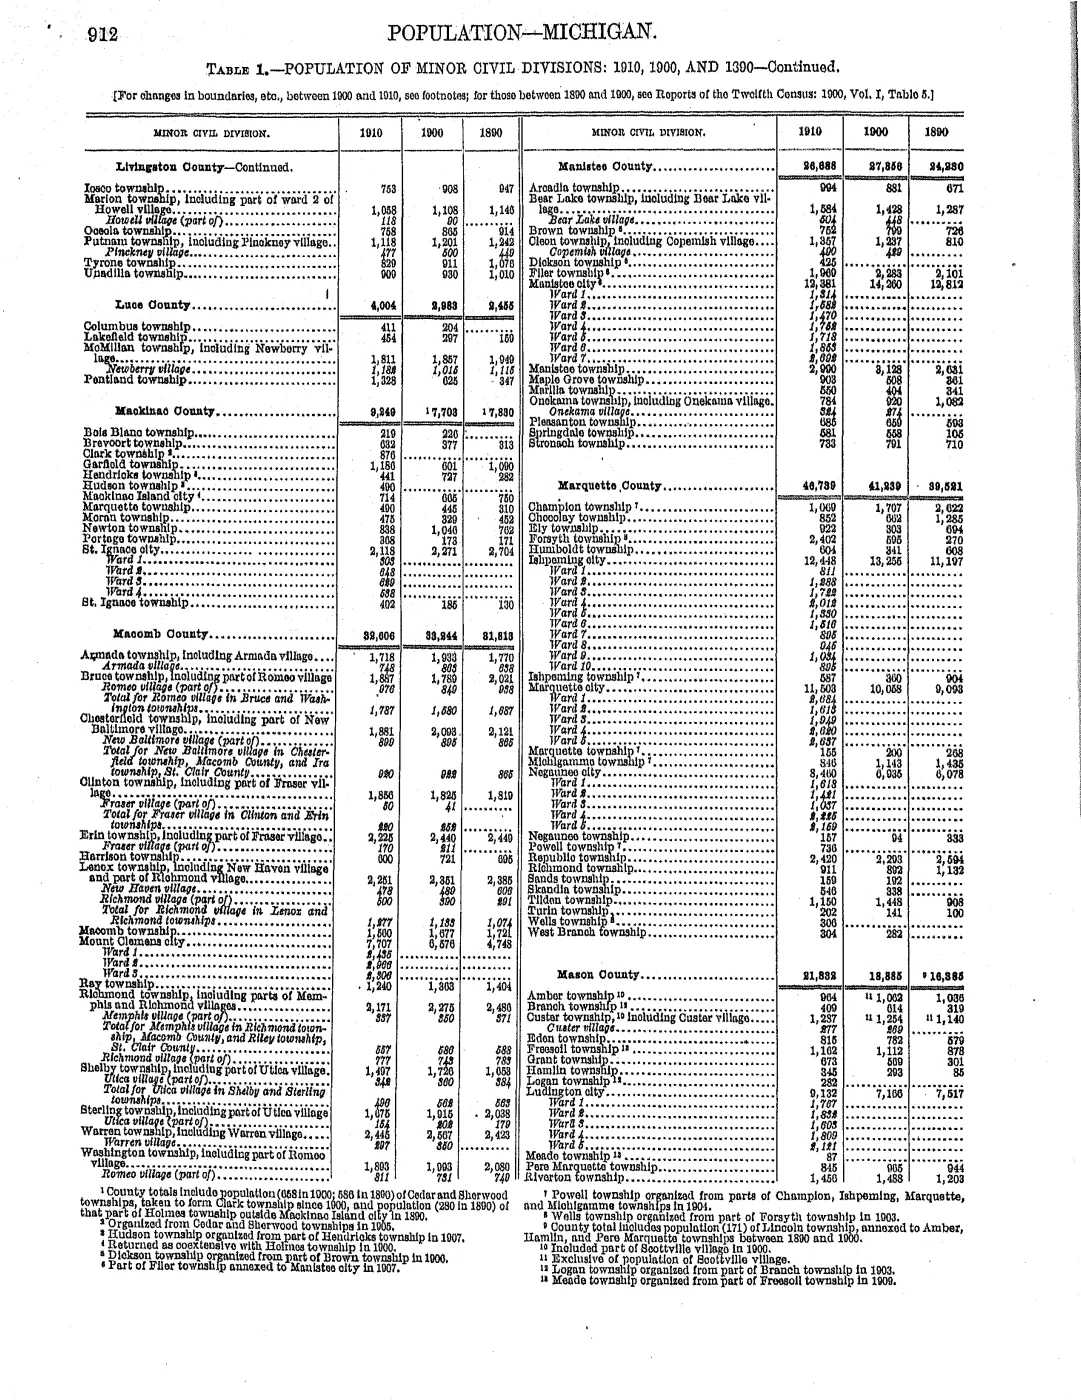
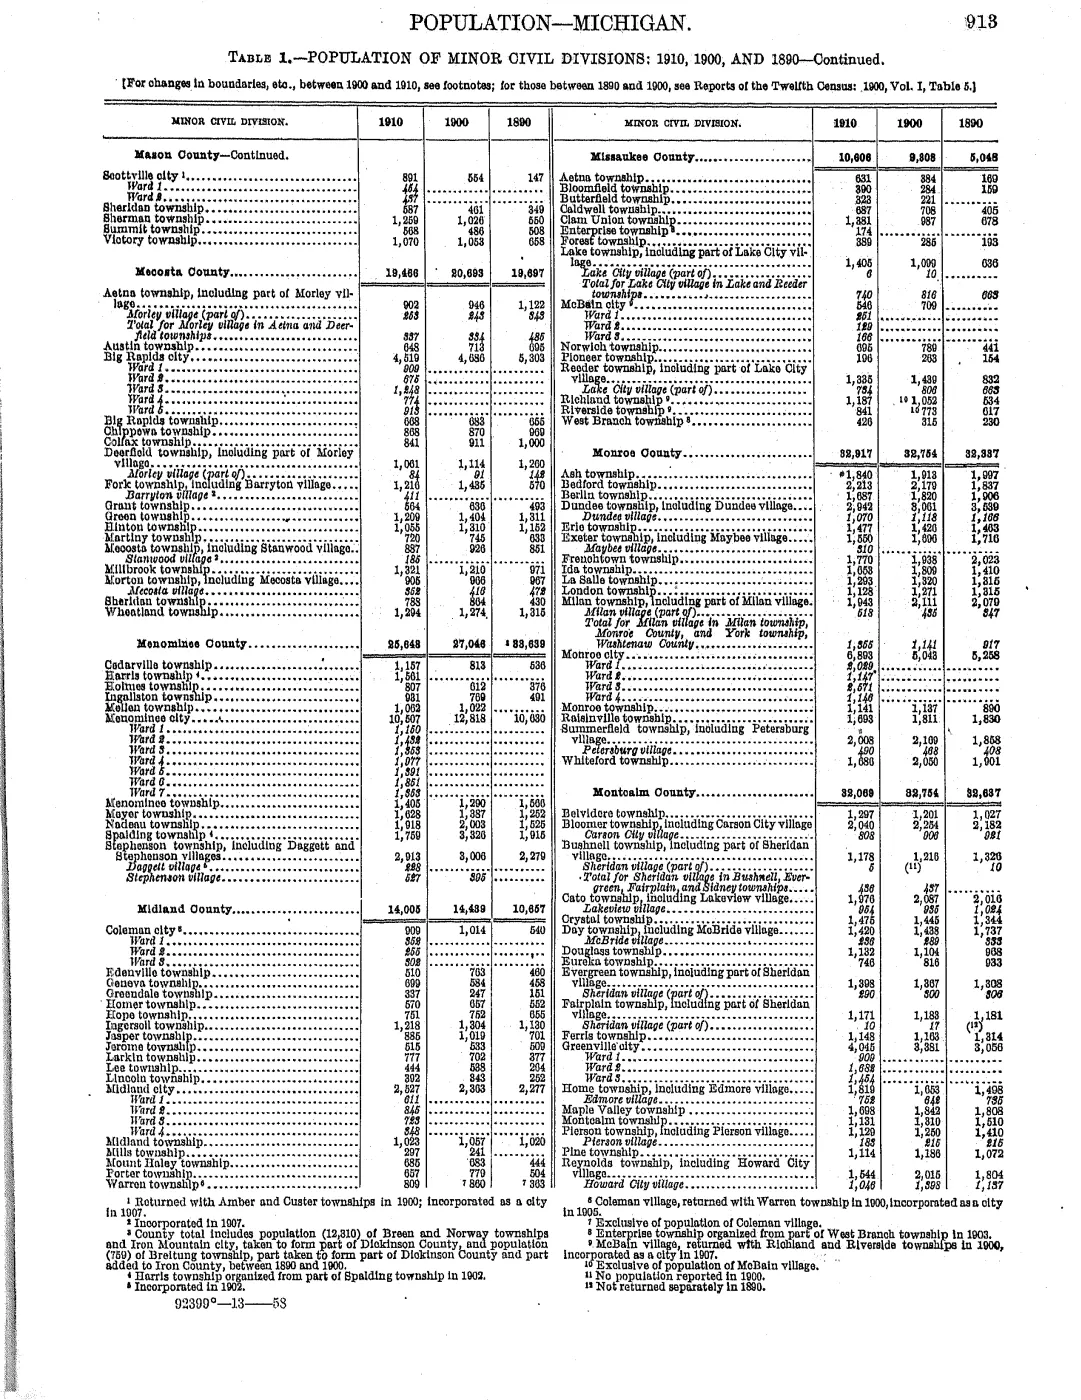
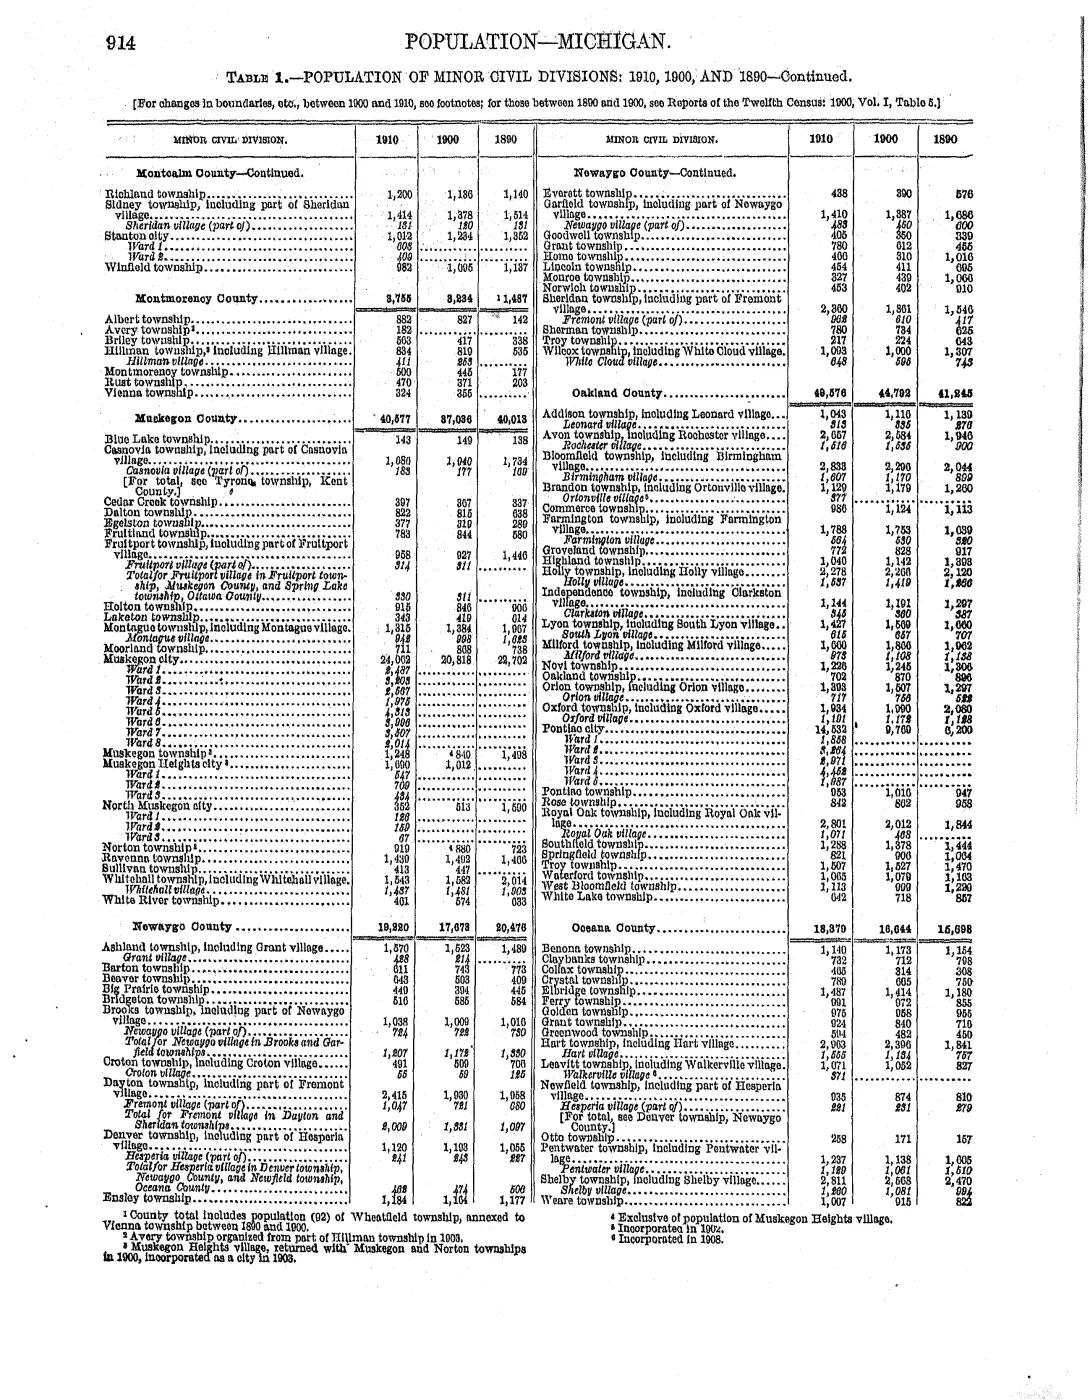
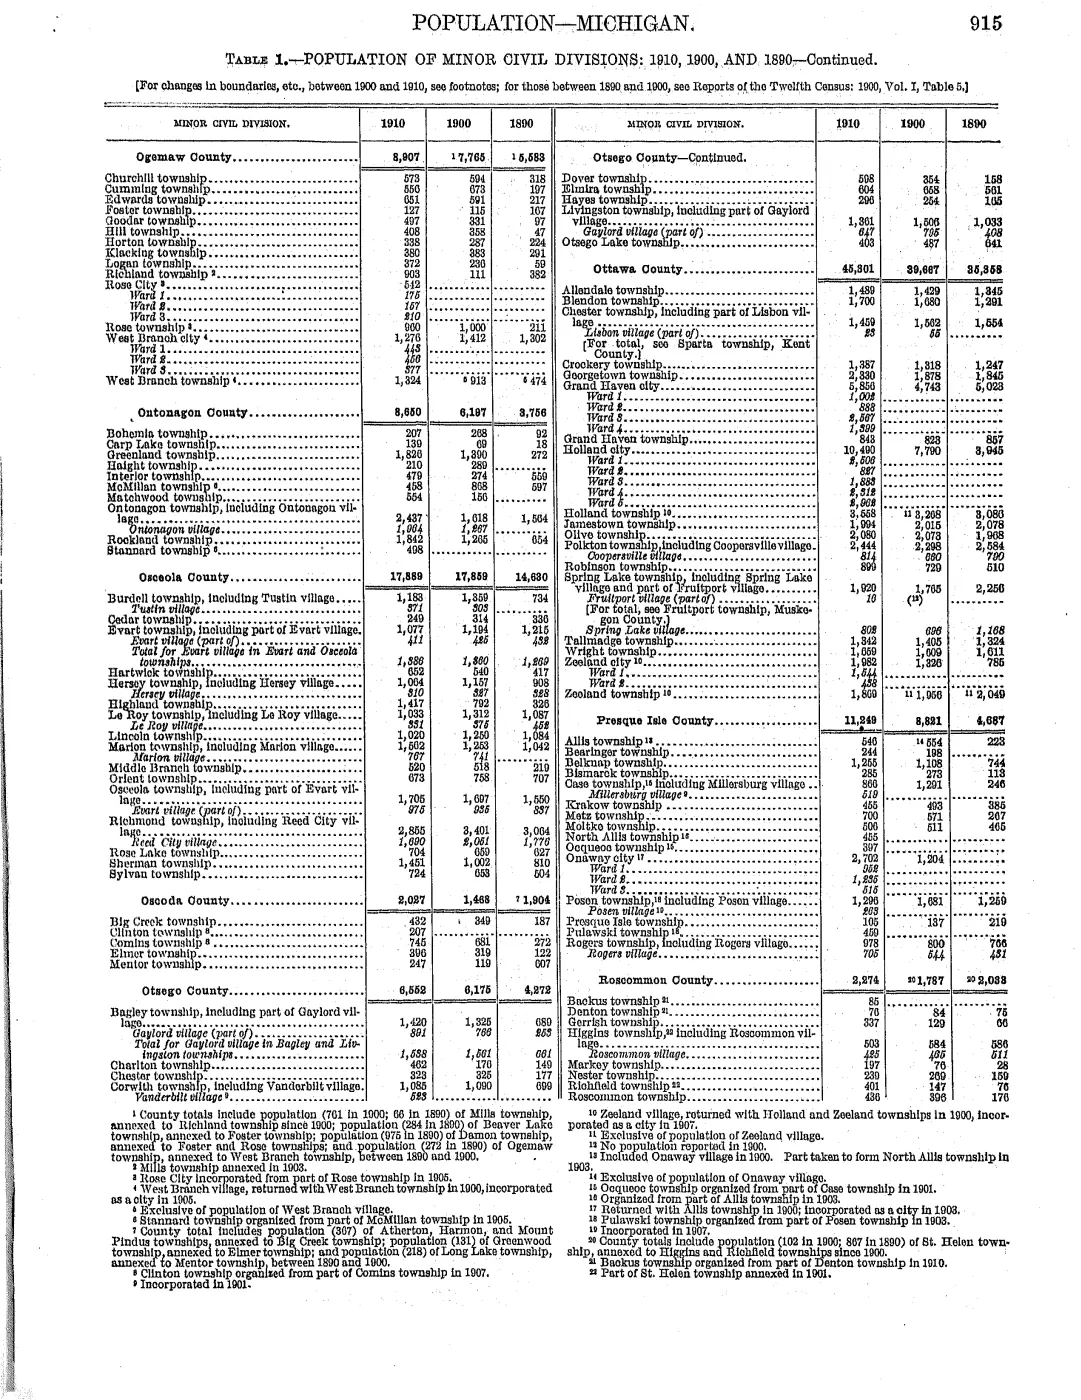
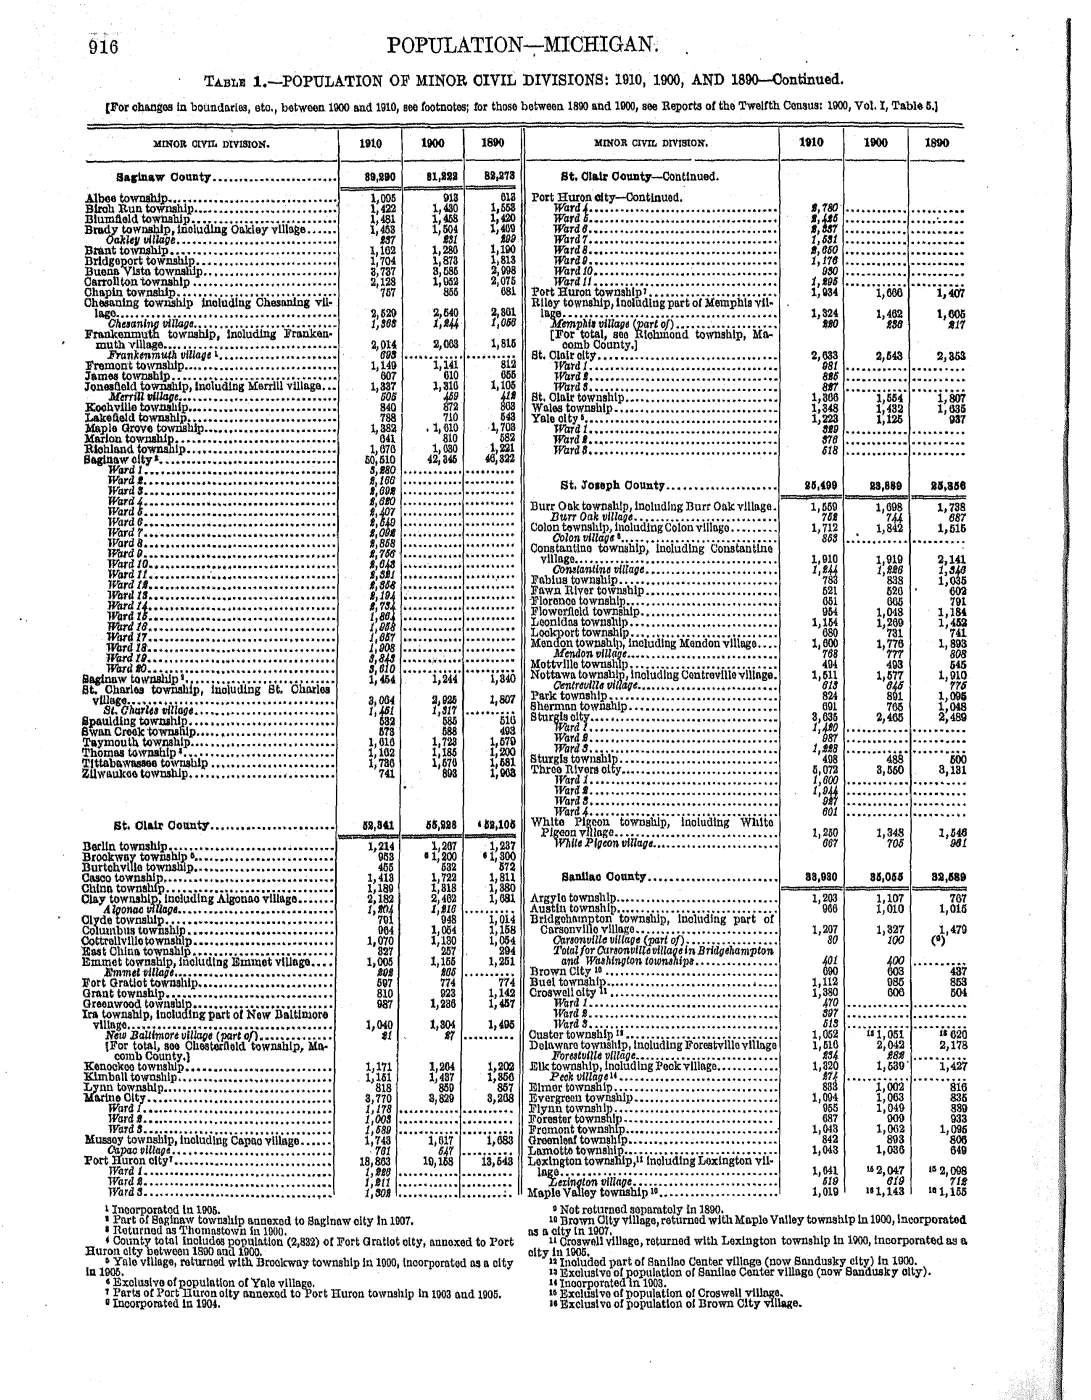
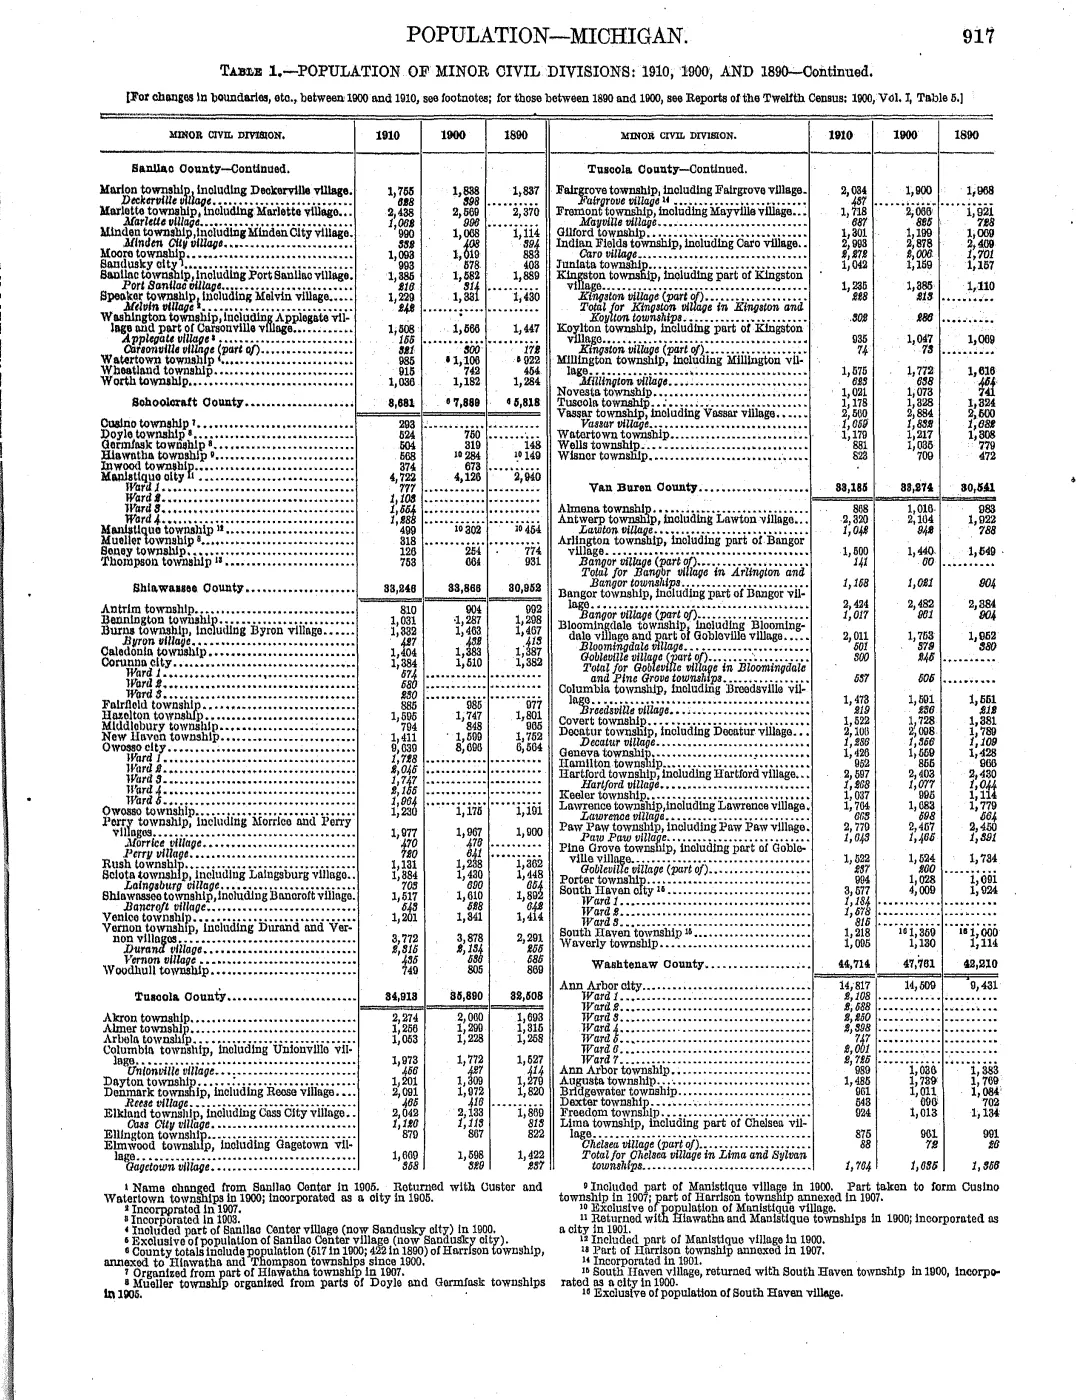
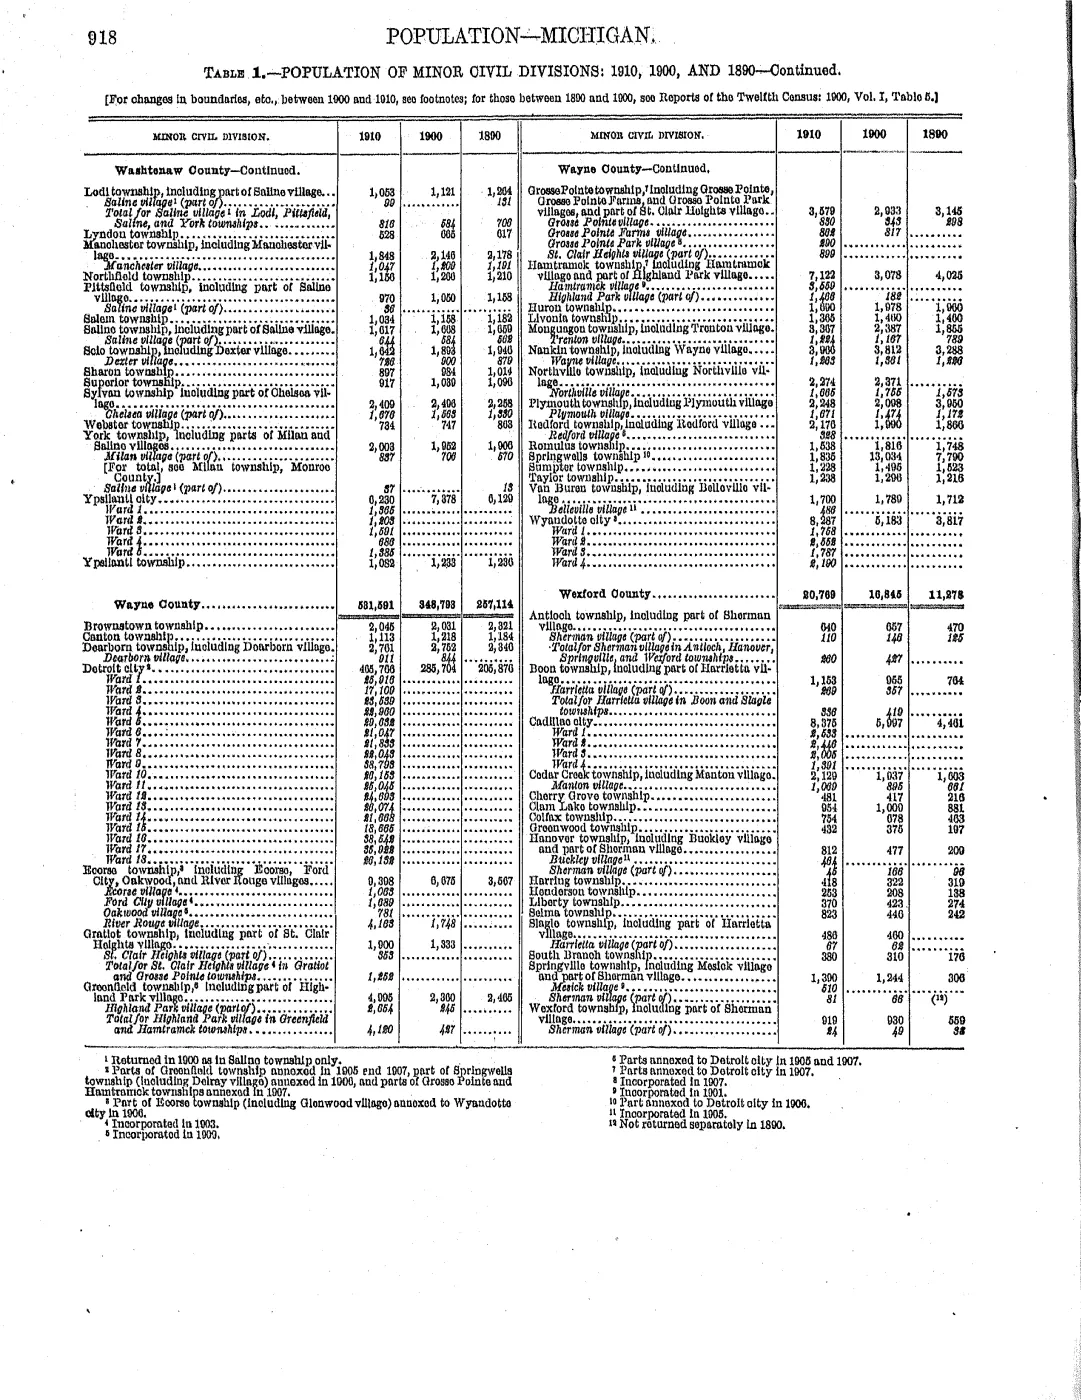
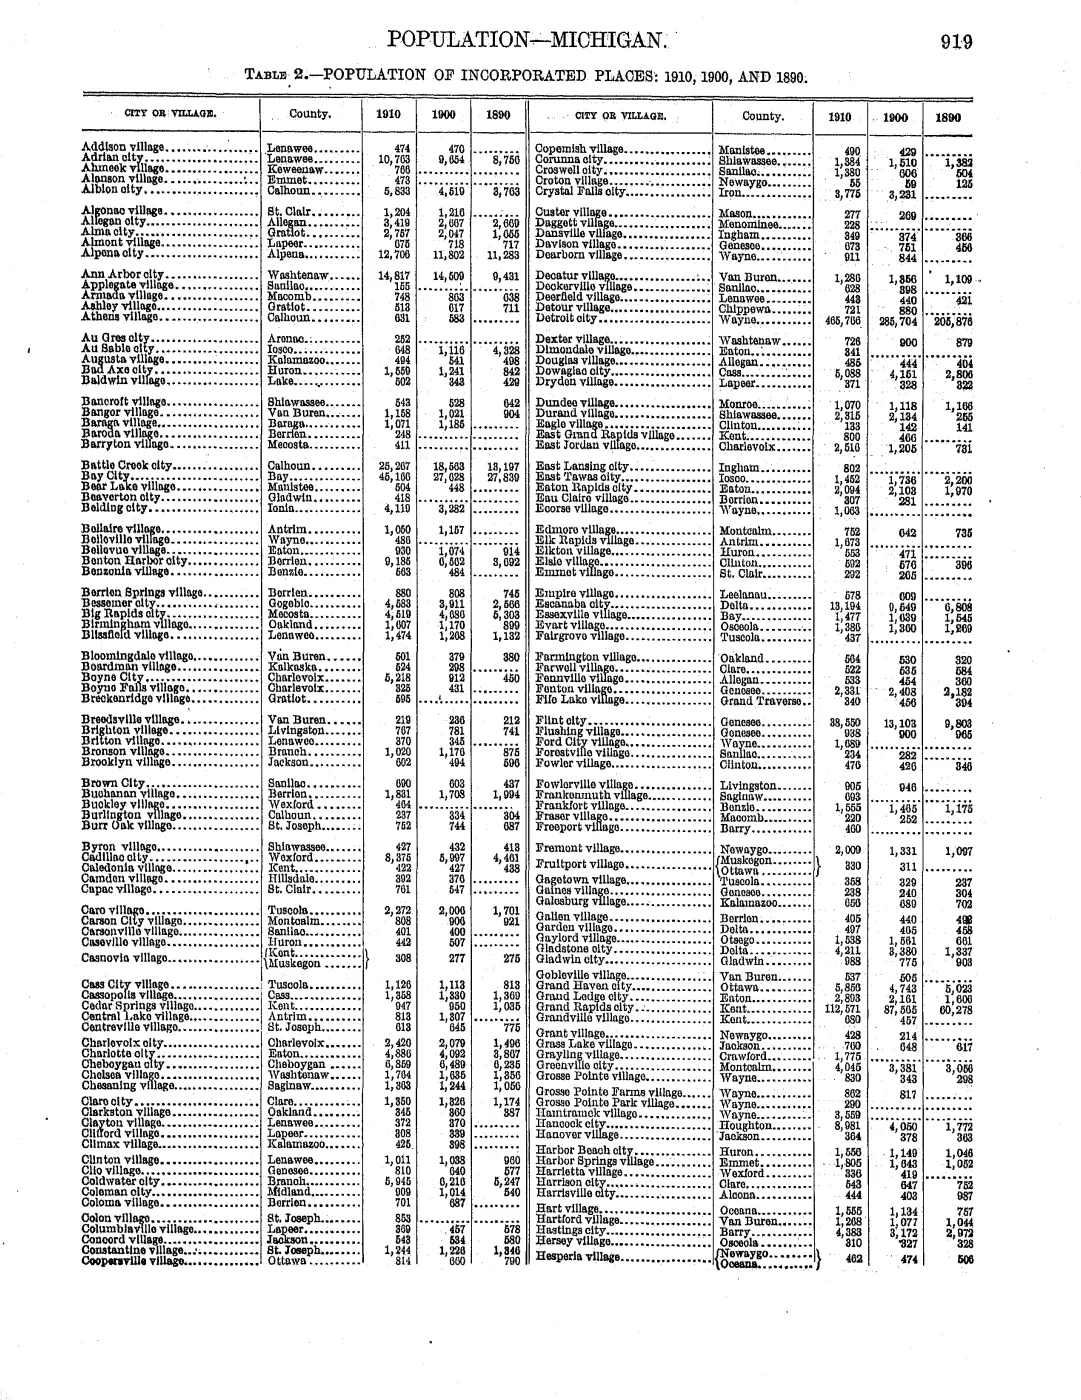
Selected published federal Census township counts are brought together here into one source-traced table: an explicitly non-comparable 1890 Peaine row; a 1900 island total of 792; and comparable two-township totals of 1,065 (1910), 779 (1920), 527 (1930), 521 (1940), 396 (1950), 217 (1960), 219 (1970), 321 (1980), and 404 (1990).
History
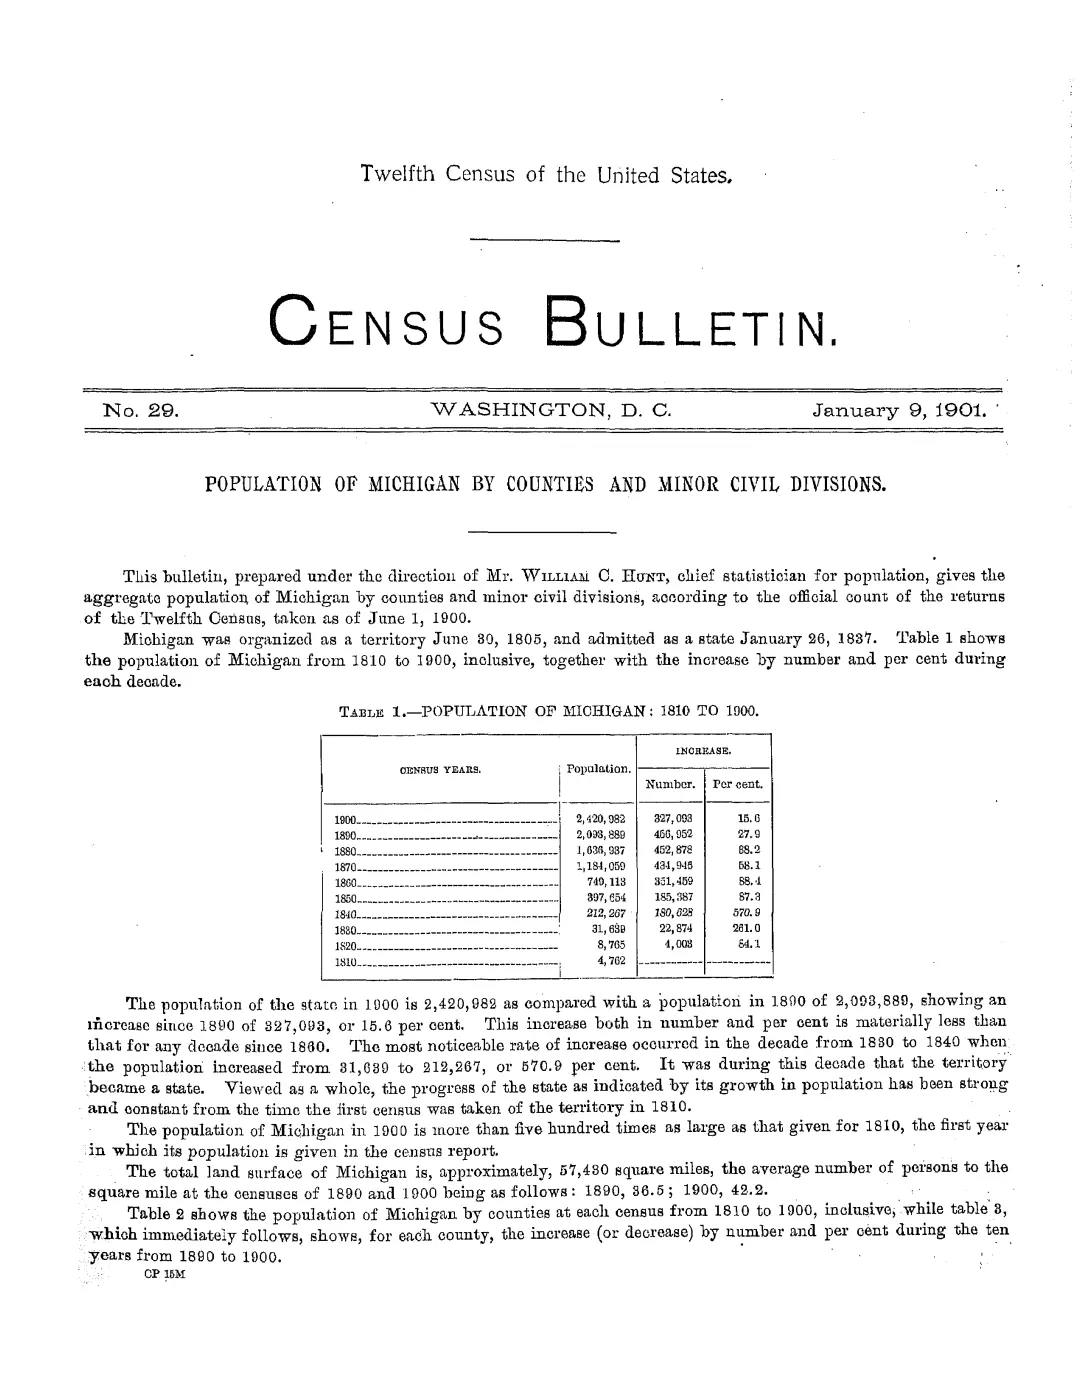
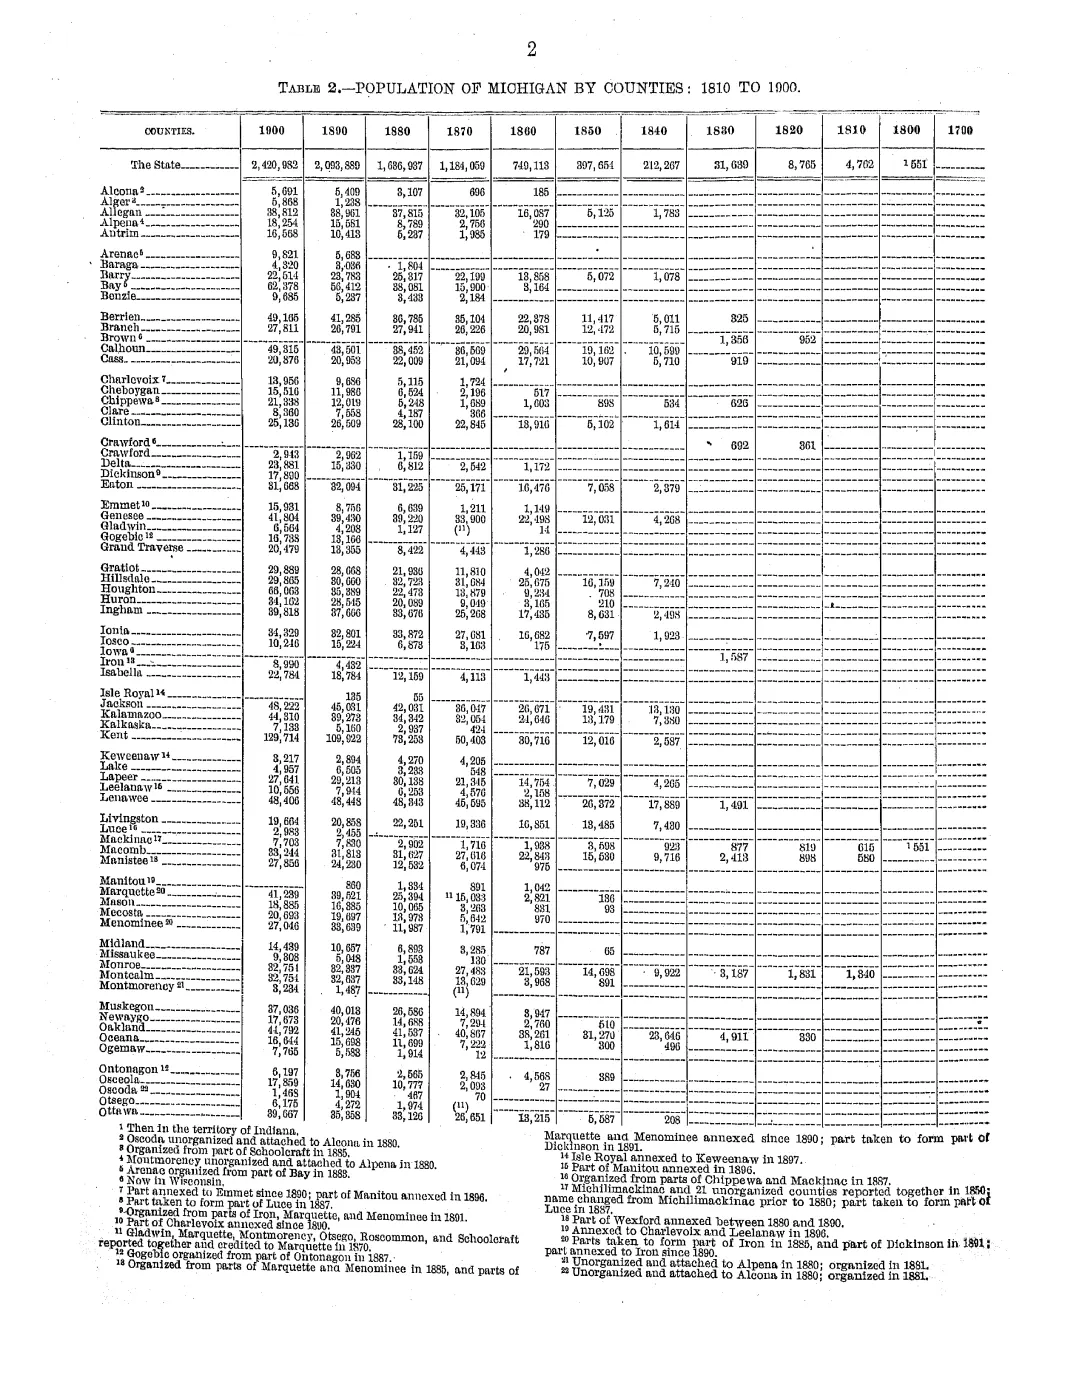
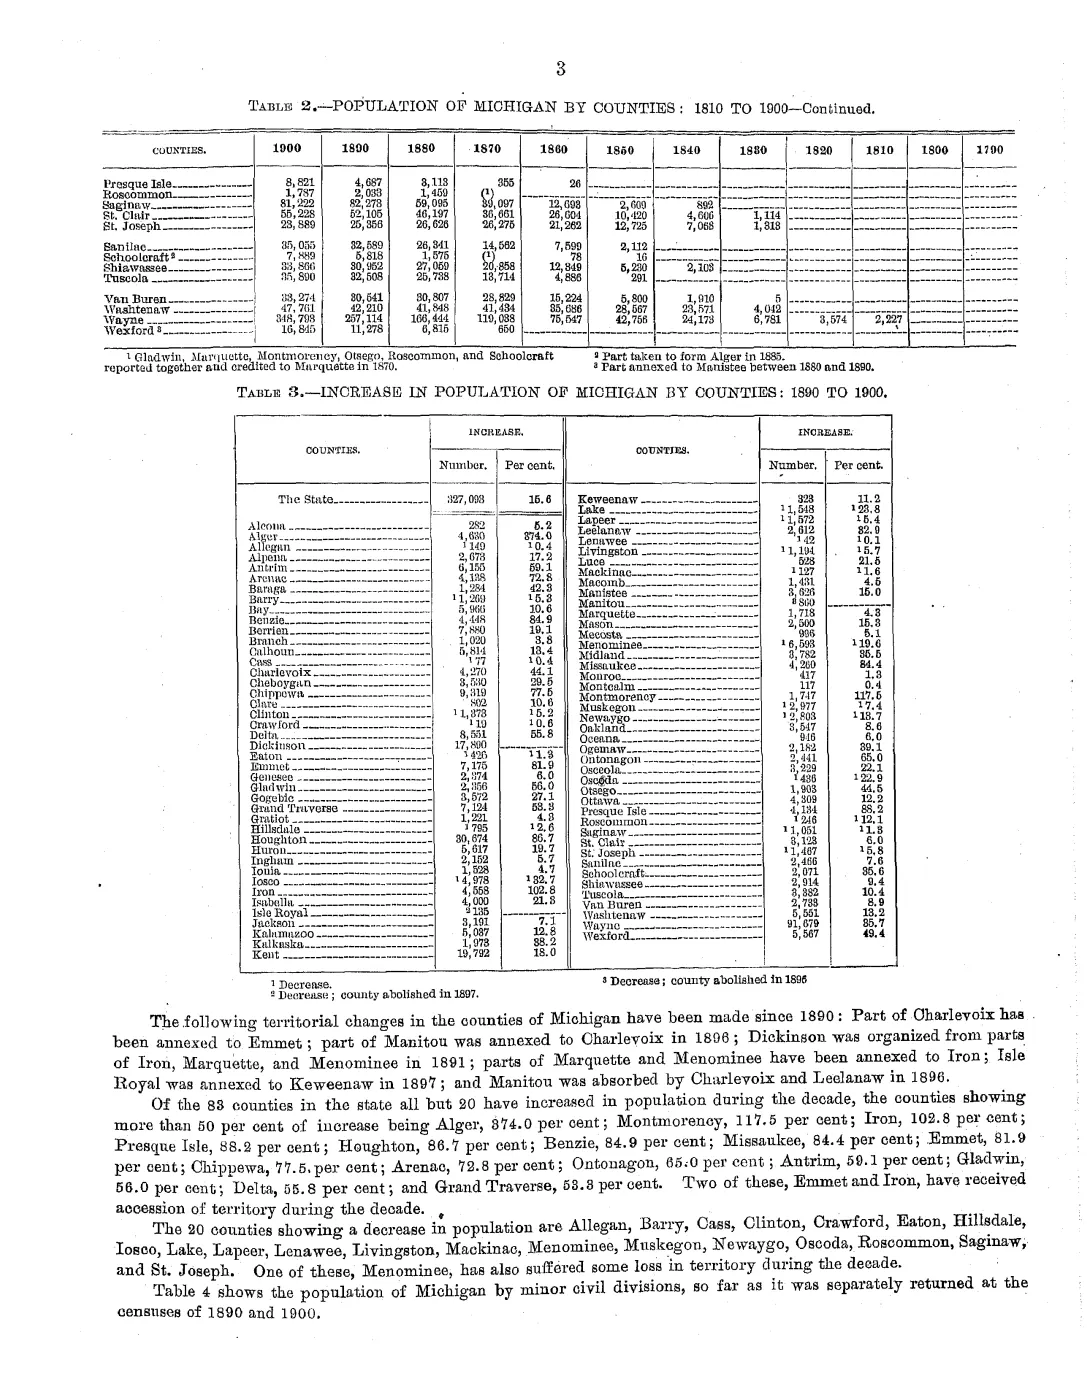
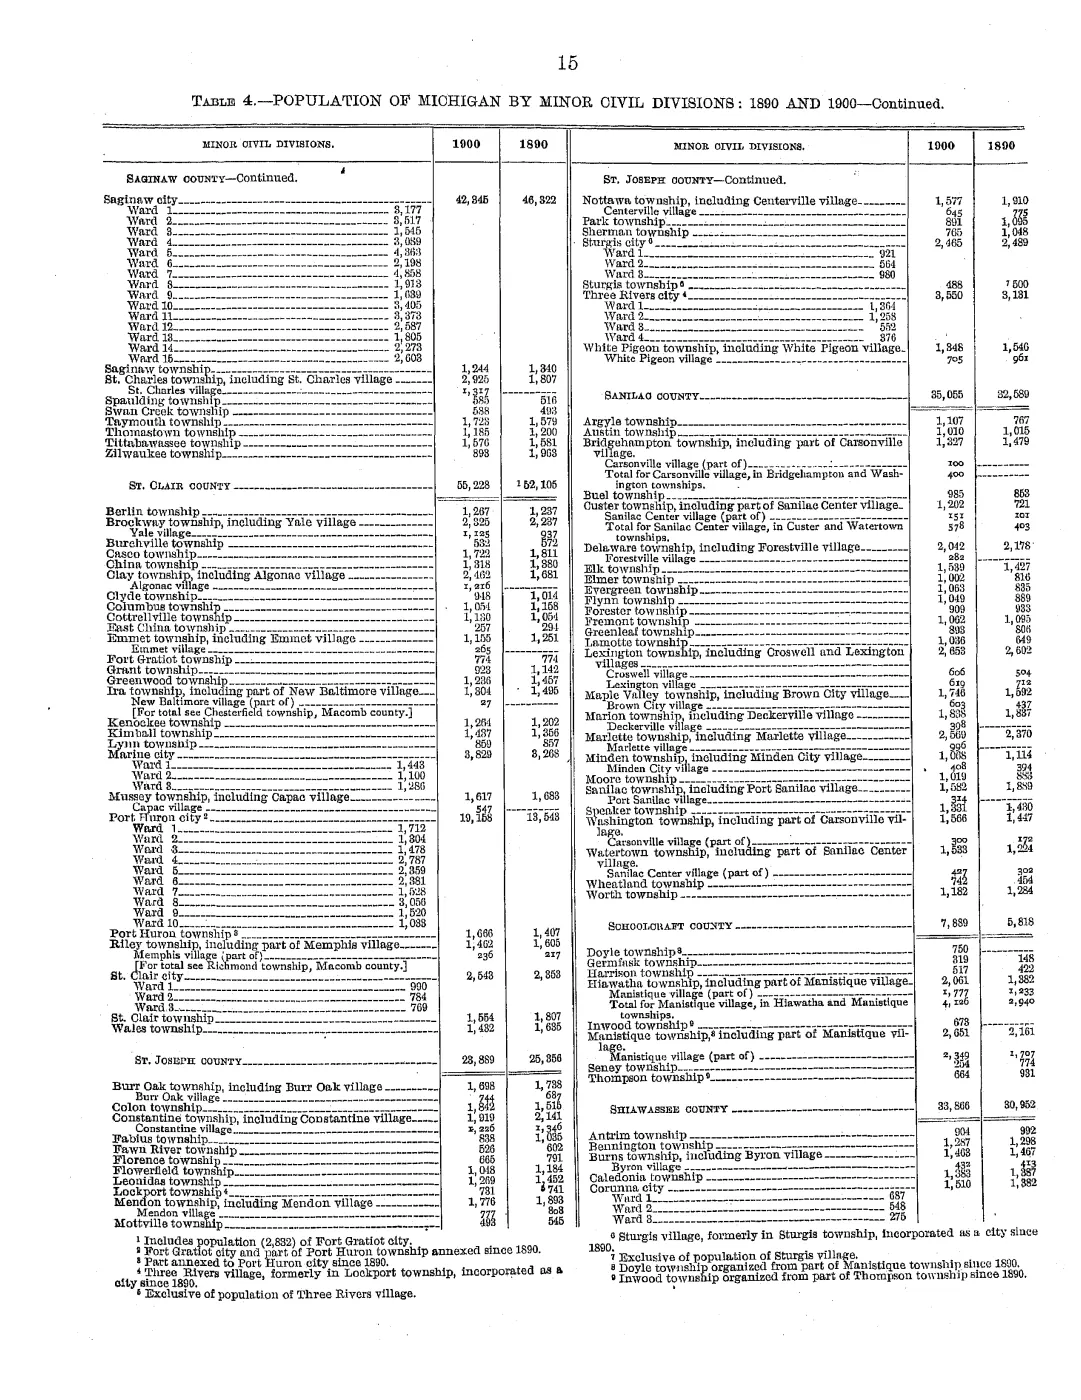
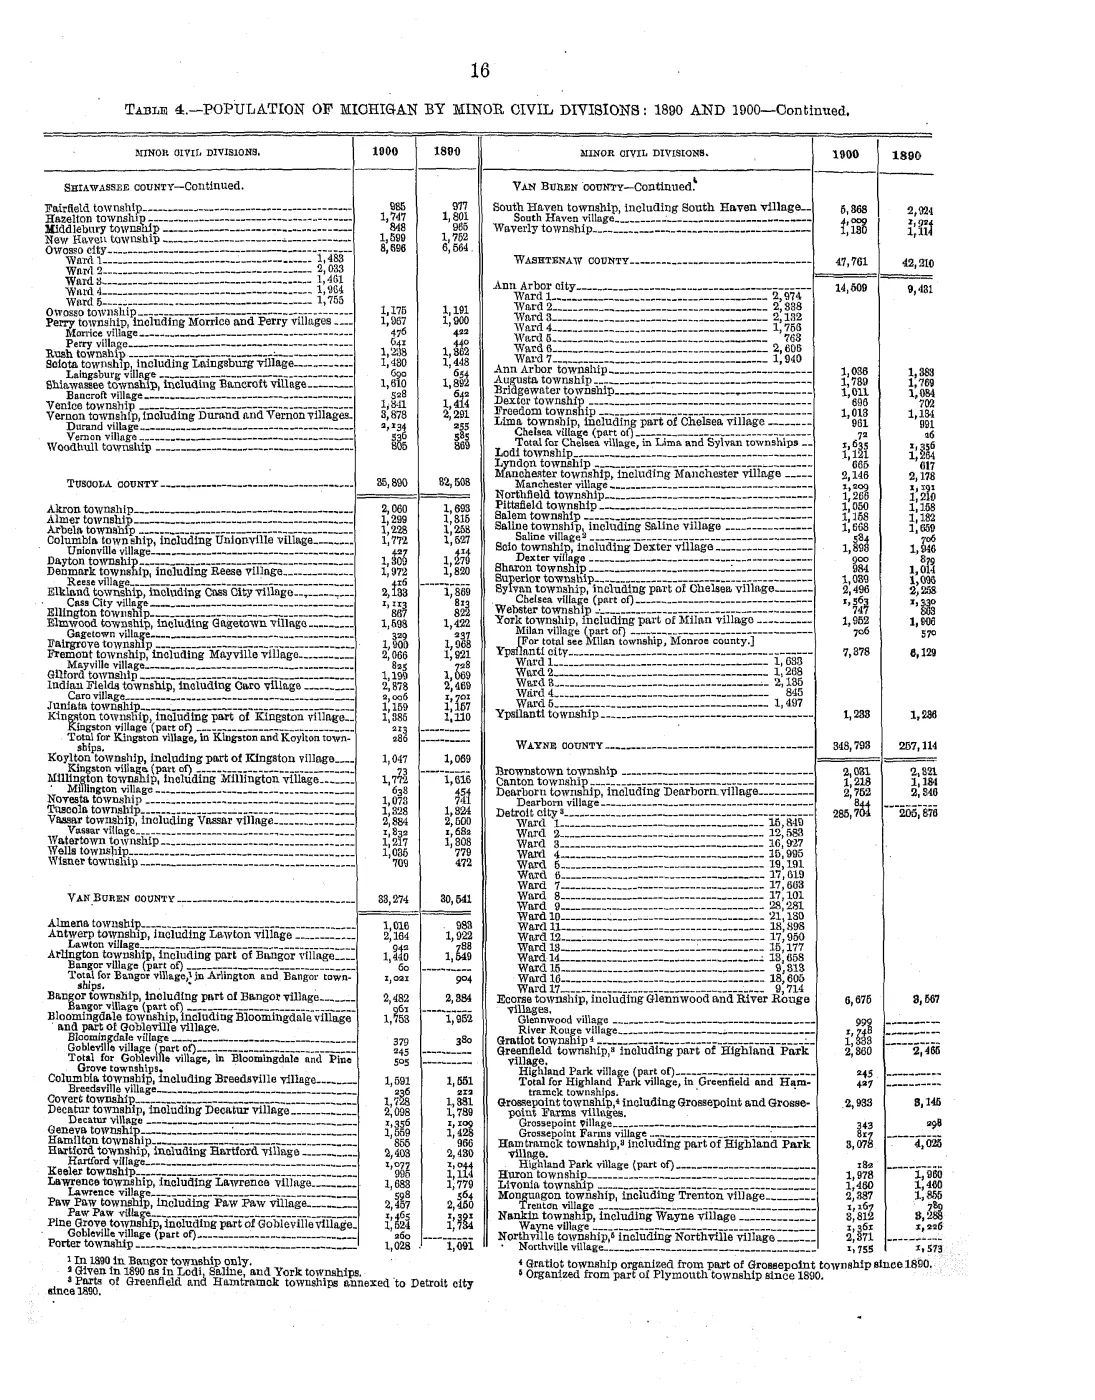
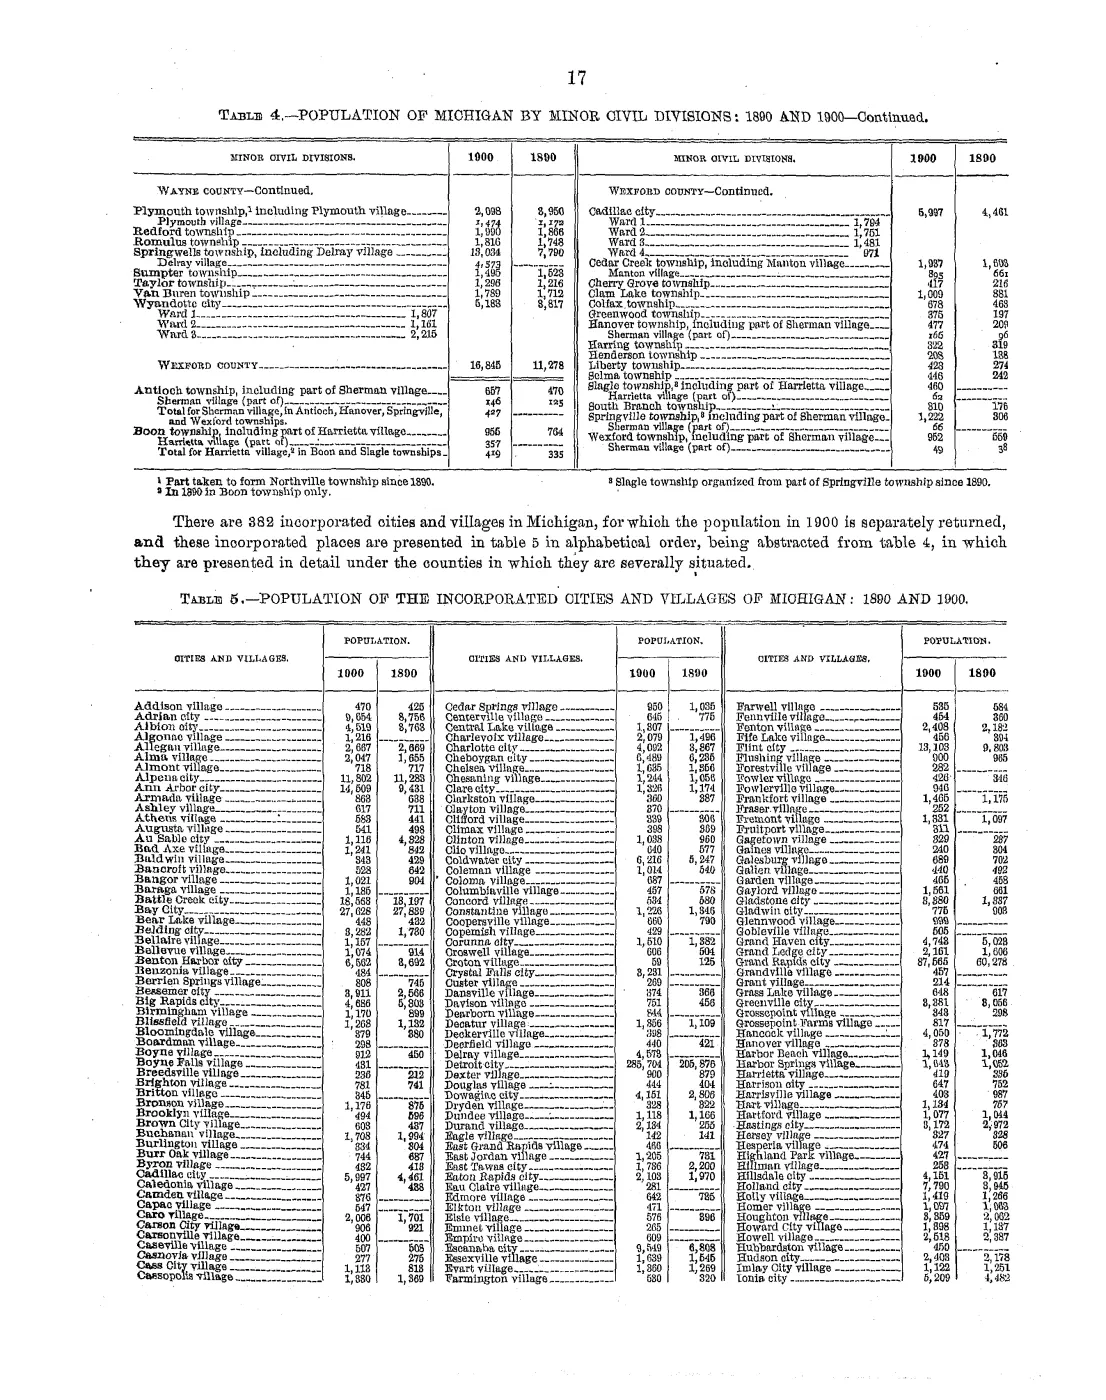
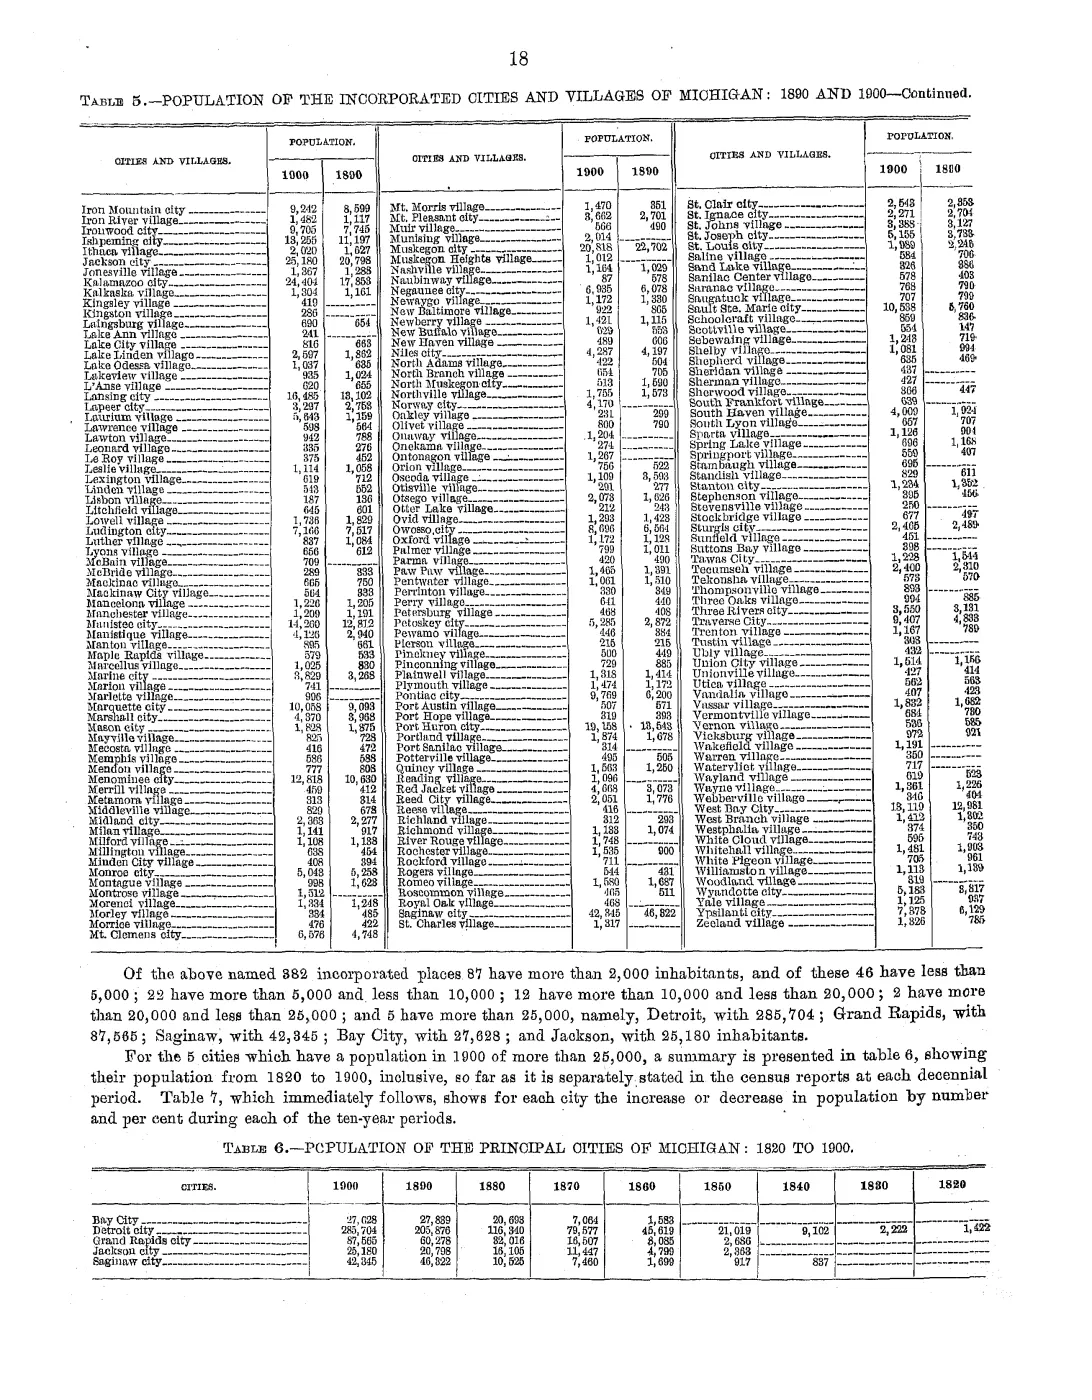
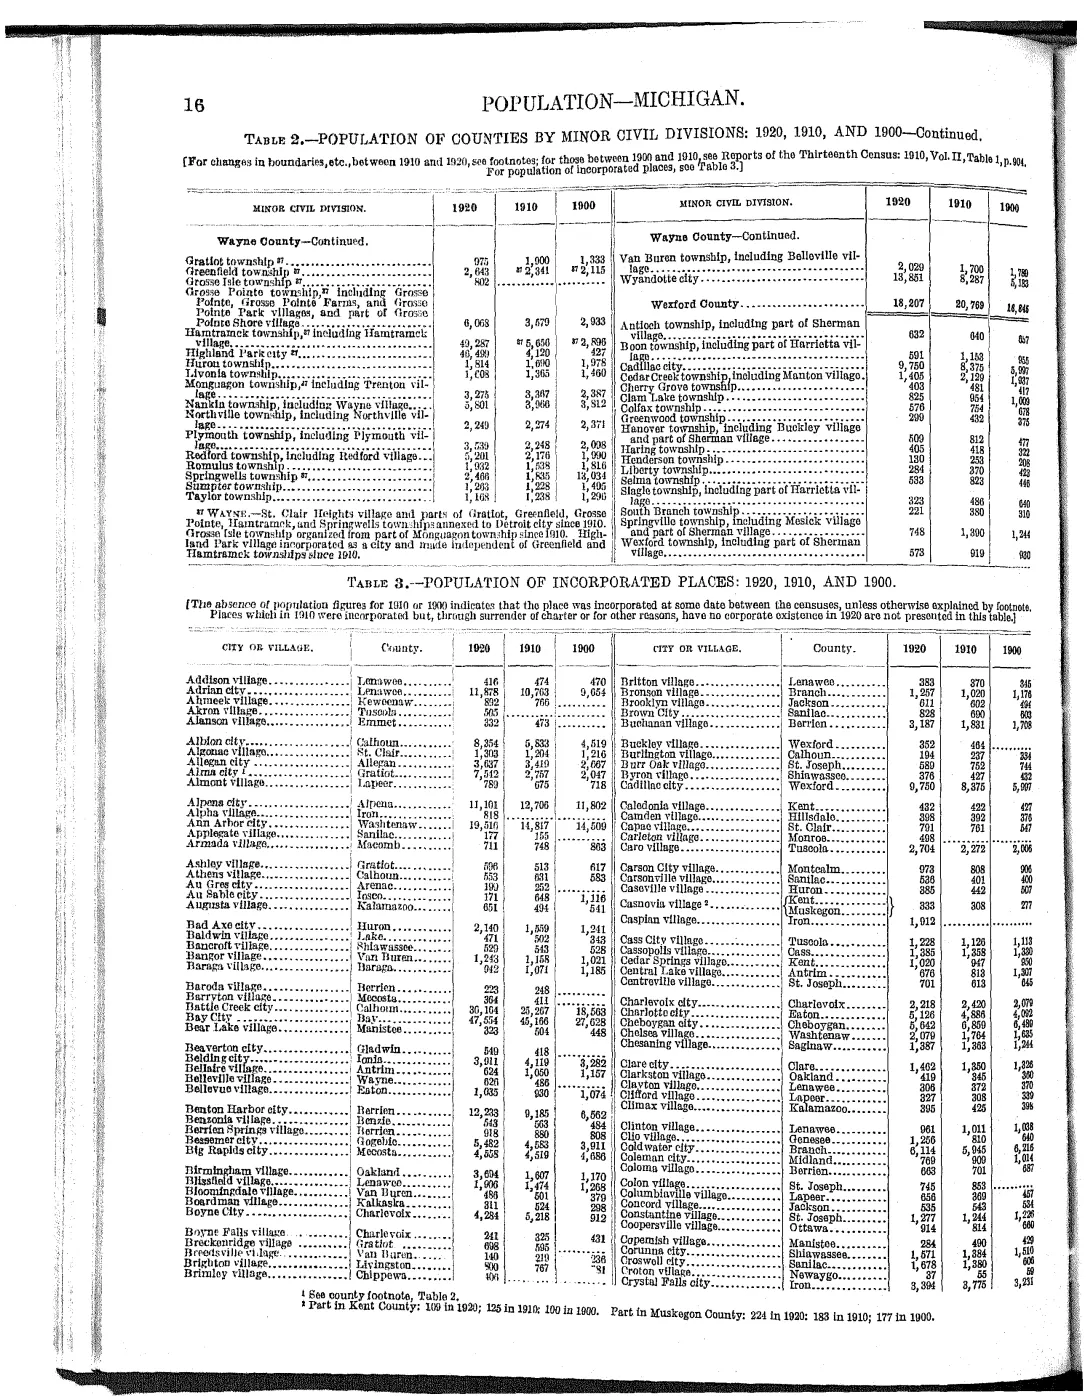
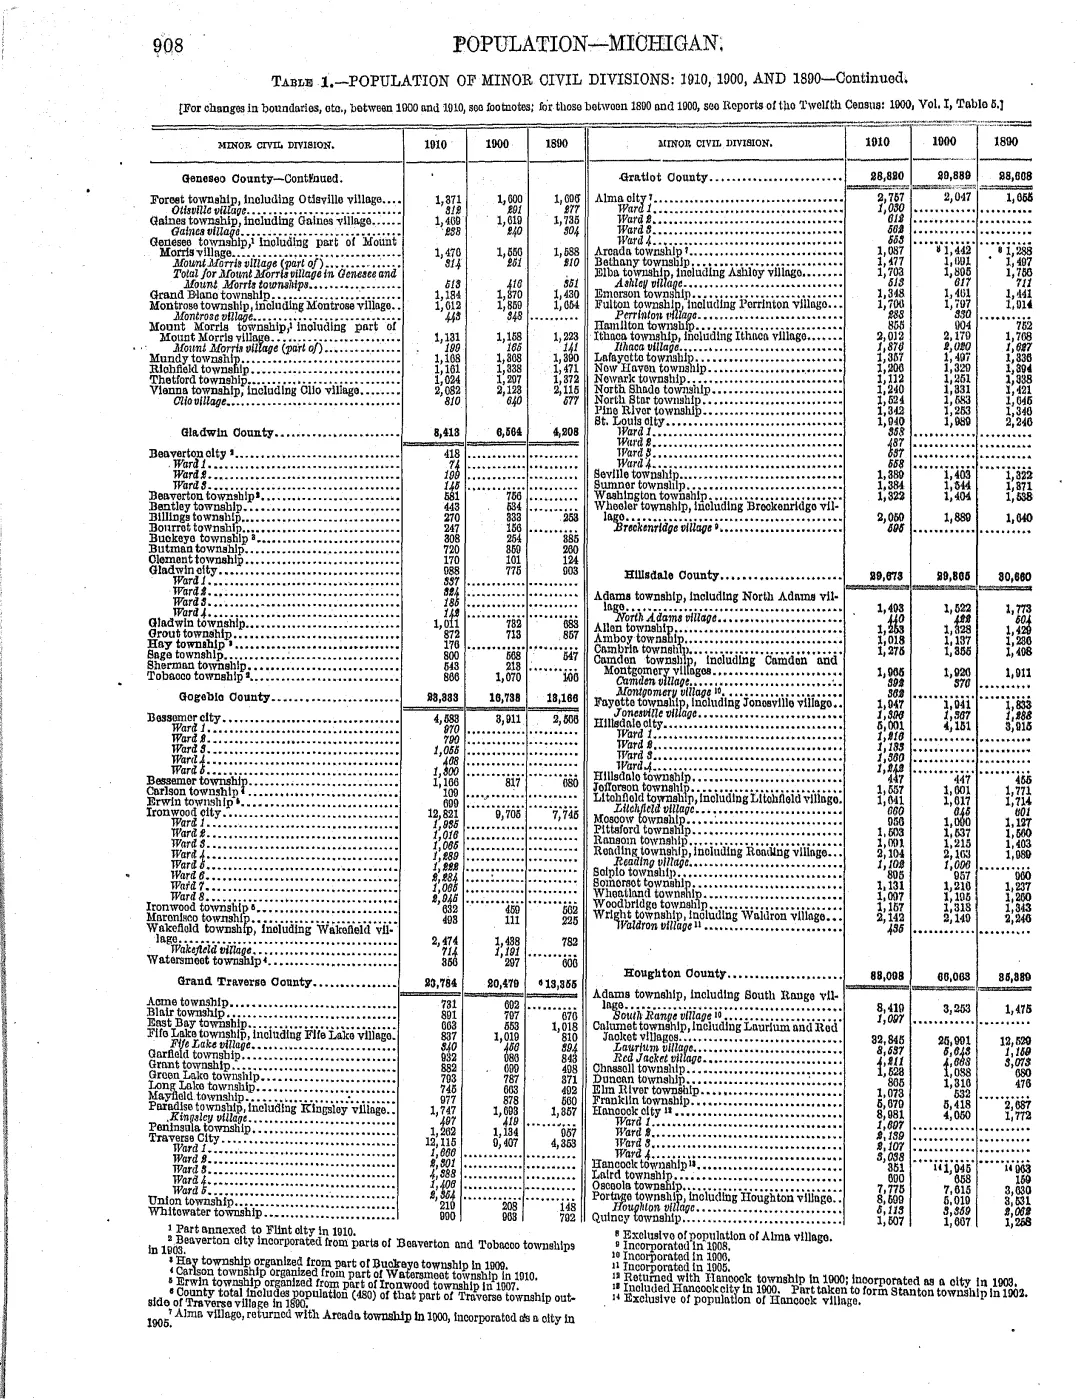
The six published federal tables that feed this extract span ninety years of Bureau of the Census practice, from the 1900 Twelfth Census bulletin (which still gives the 1890 figure only for Peaine, before St. James was organized out of it) to the 1990 Population and Housing Unit Counts volume. Combined Township of Peaine and Township of Saint James population moves from 792 in 1900 to a ninety-year peak of 1,065 in 1910, then falls across five consecutive decades to a low of 217 in 1960, before a partial recovery to 404 by 1990. That is the shape of the curve — one rise, one long decline, one partial rebound — without establishing what drove any of it; no held source connects these particular census counts to the island’s fishing, logging, or resort economies decade by decade.
Evidence and limits
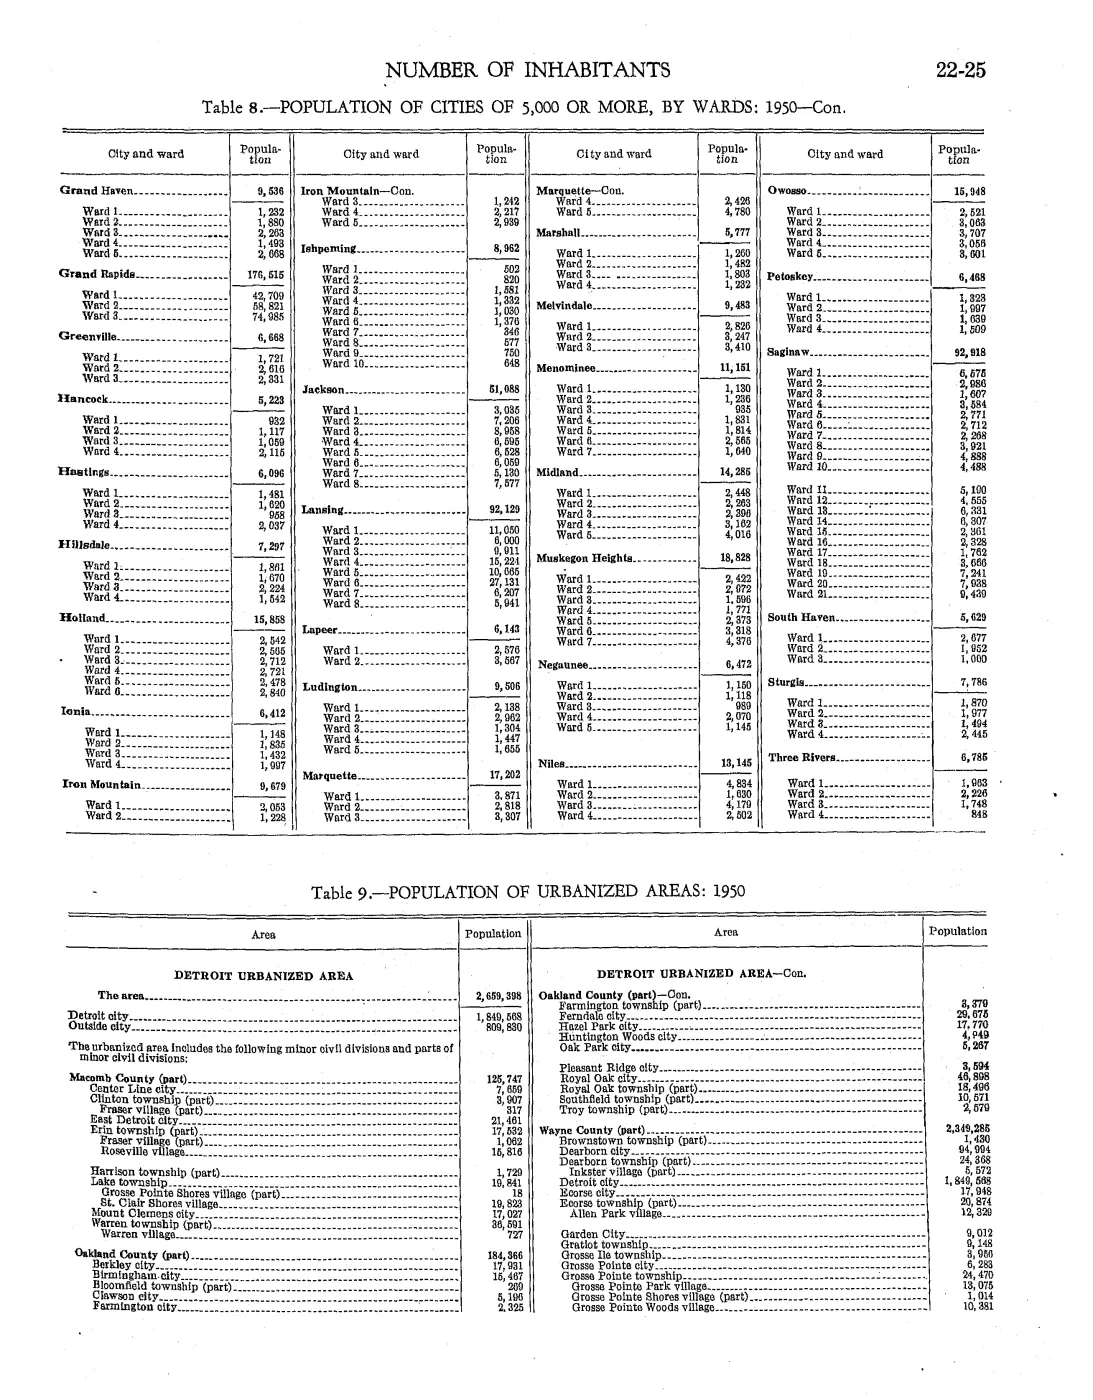
The table is intentionally partial. It does not fill every decennial year, and
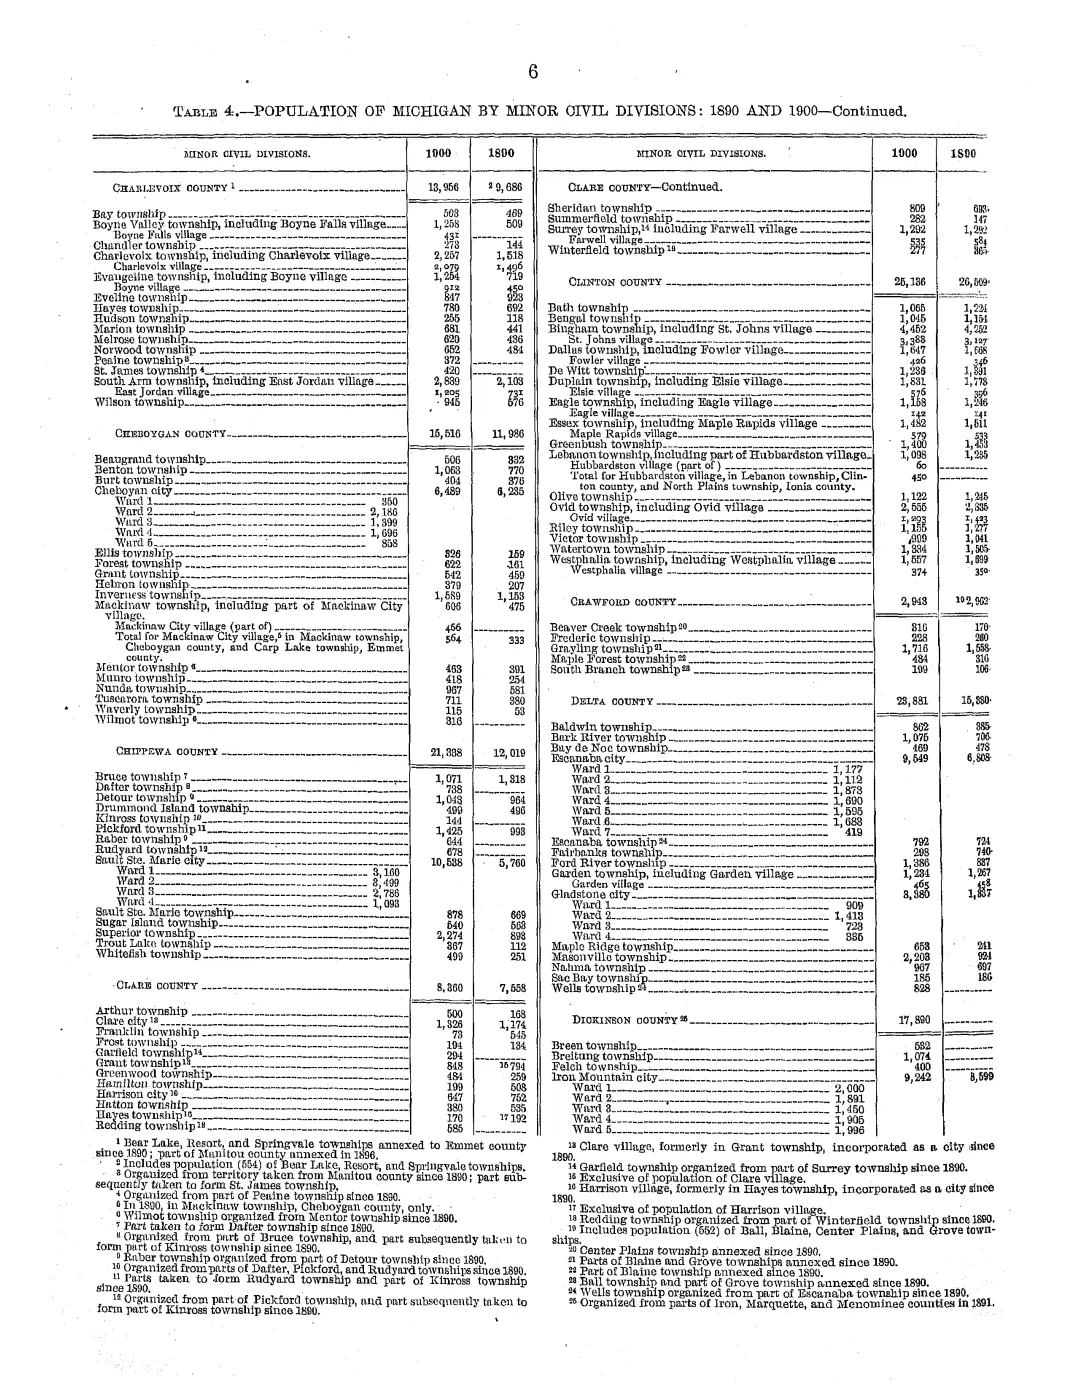
it does not turn 1890 Peaine into an island total: the 1900 publication says
St. James was organized from Peaine territory after 1890. Each total is a
transparent sum of the Peaine and St. James rows in one published table, not a
separately returned Census geography. The records are decennial resident
counts, not seasonal population, household rosters, ancestry data, or a measure
of people present at a particular time of year. The 1990 table’s citation was
previously misdated to “table 9 … p. 55”; it is table 8, printed p. 19, as
corrected in the sources: block above.
Open questions
- What drove the rise to 1,065 in 1910 and the subsequent decline to 217 by 1960 — logging and fishing employment, the Great Depression, wartime service, out-migration, or some combination the published tables alone do not distinguish?
- Do state-level Michigan census schedules (as opposed to federal decennial publications) survive for any of the gap years between the tables held here?
See also
Read the document
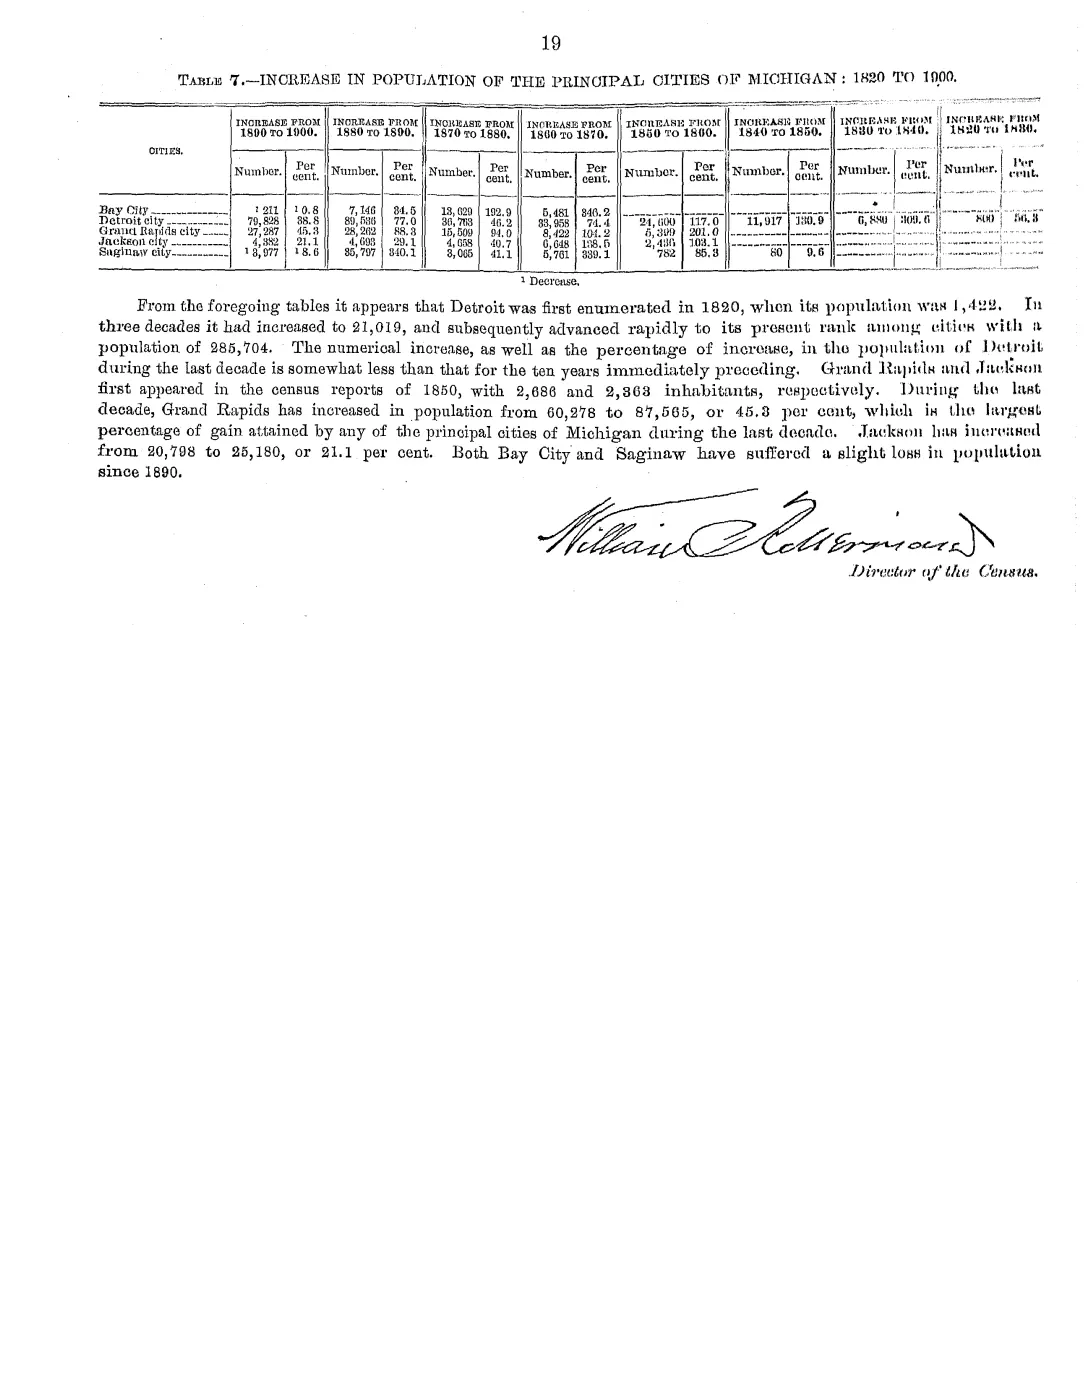
19 pages, rendered from the held scan.
Read the document
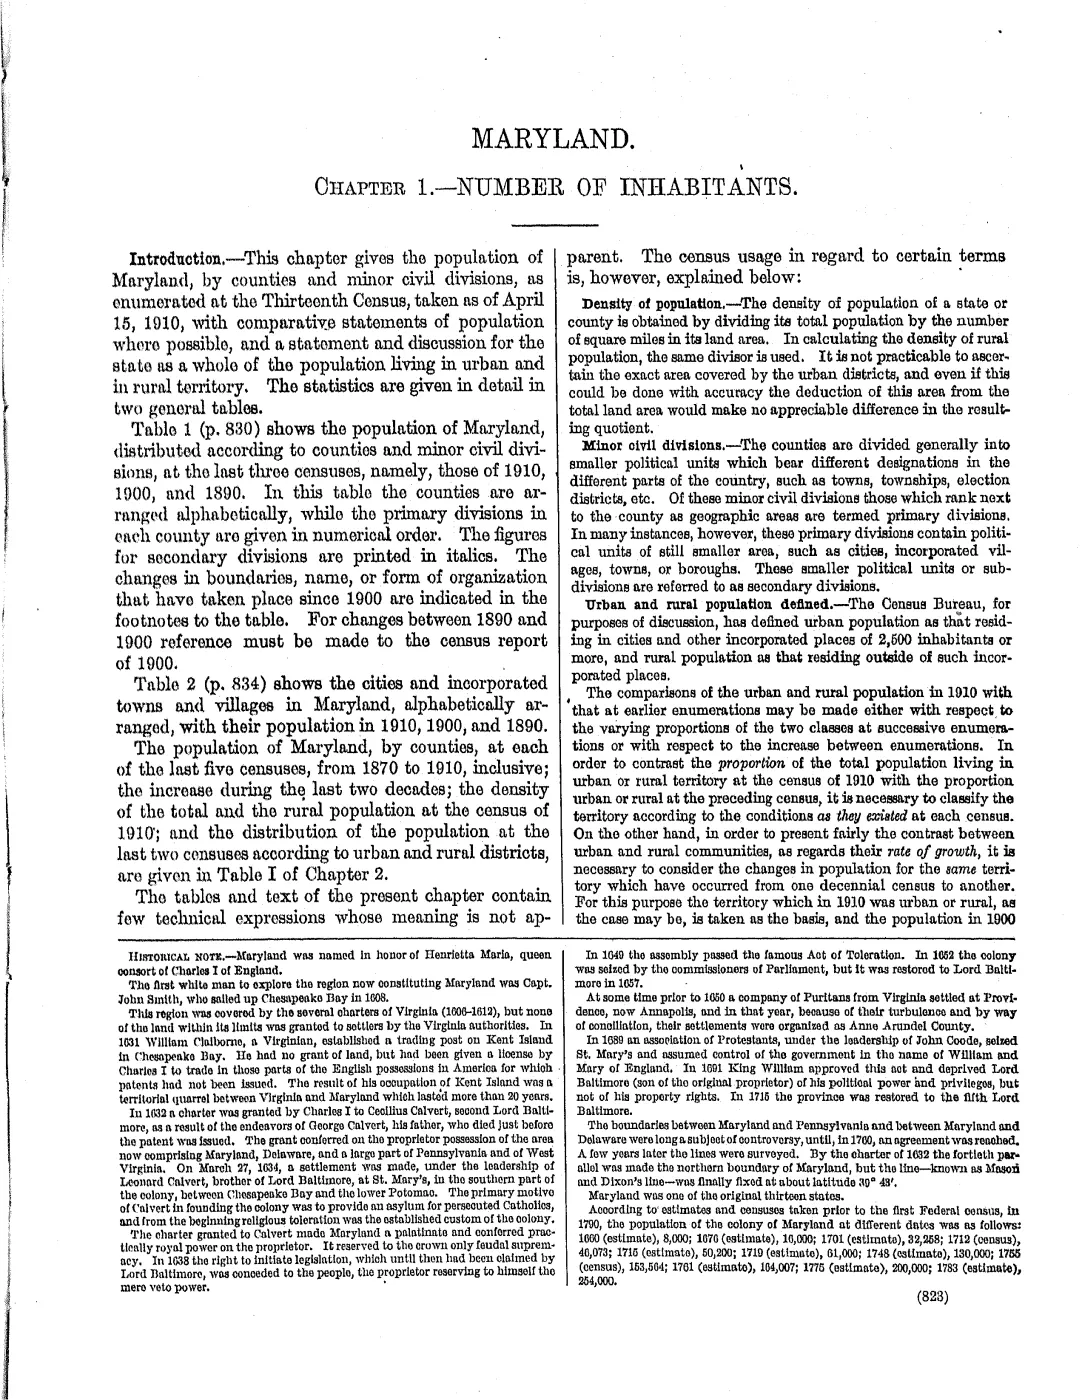
133 pages, rendered from the held scan.
Jump to a page — 133 in all
Read the document
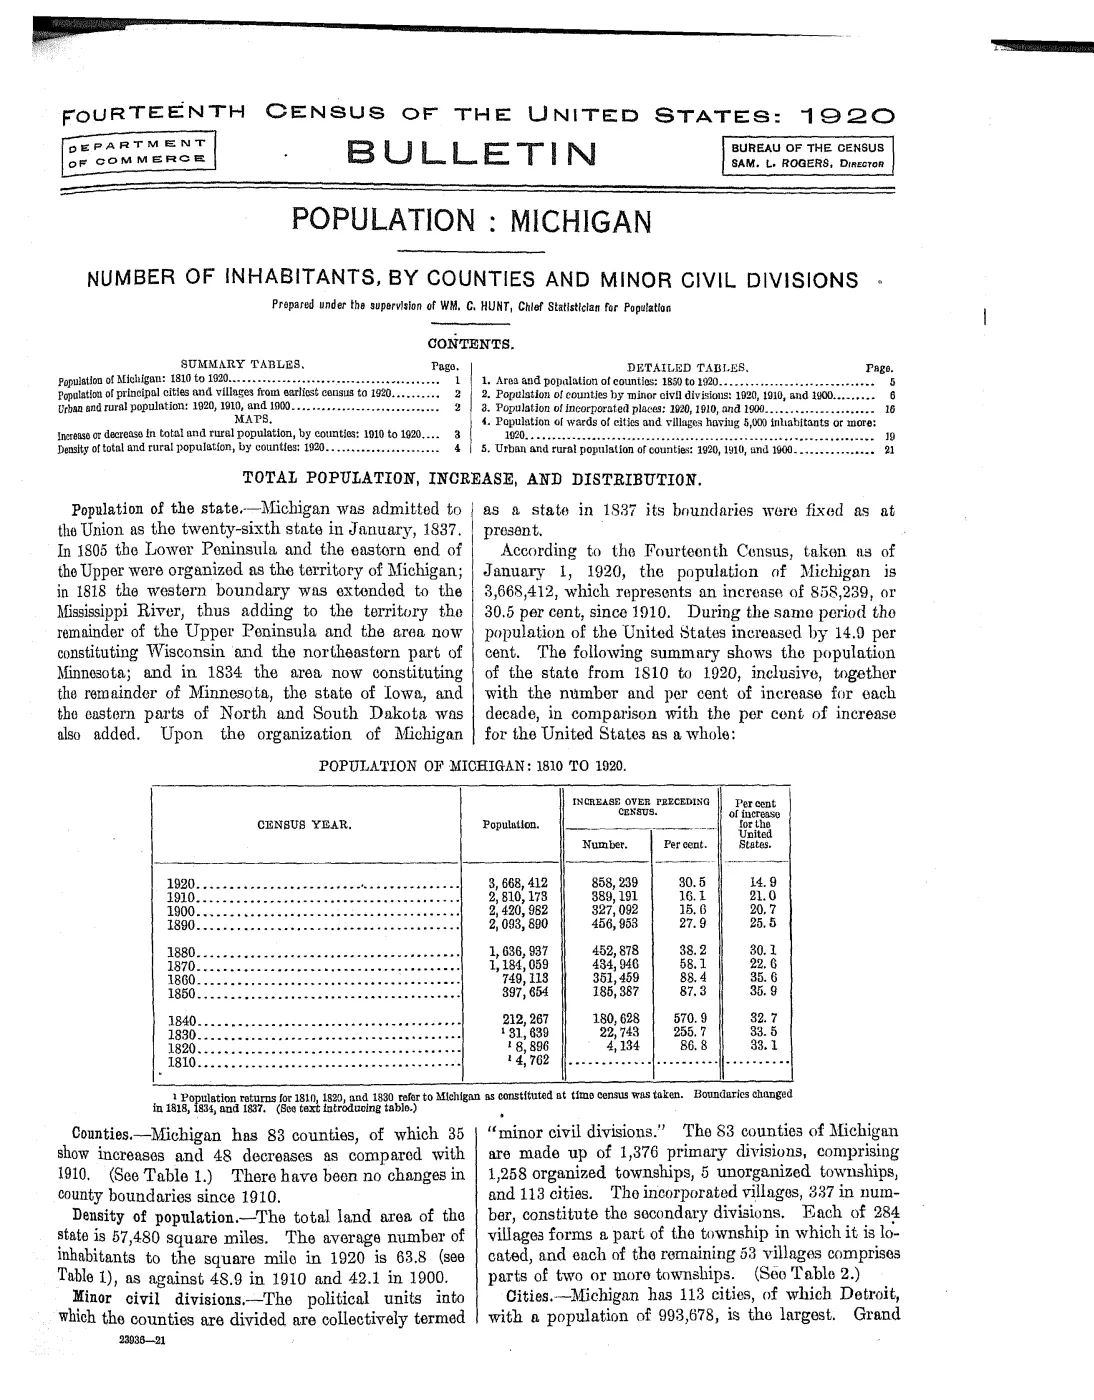
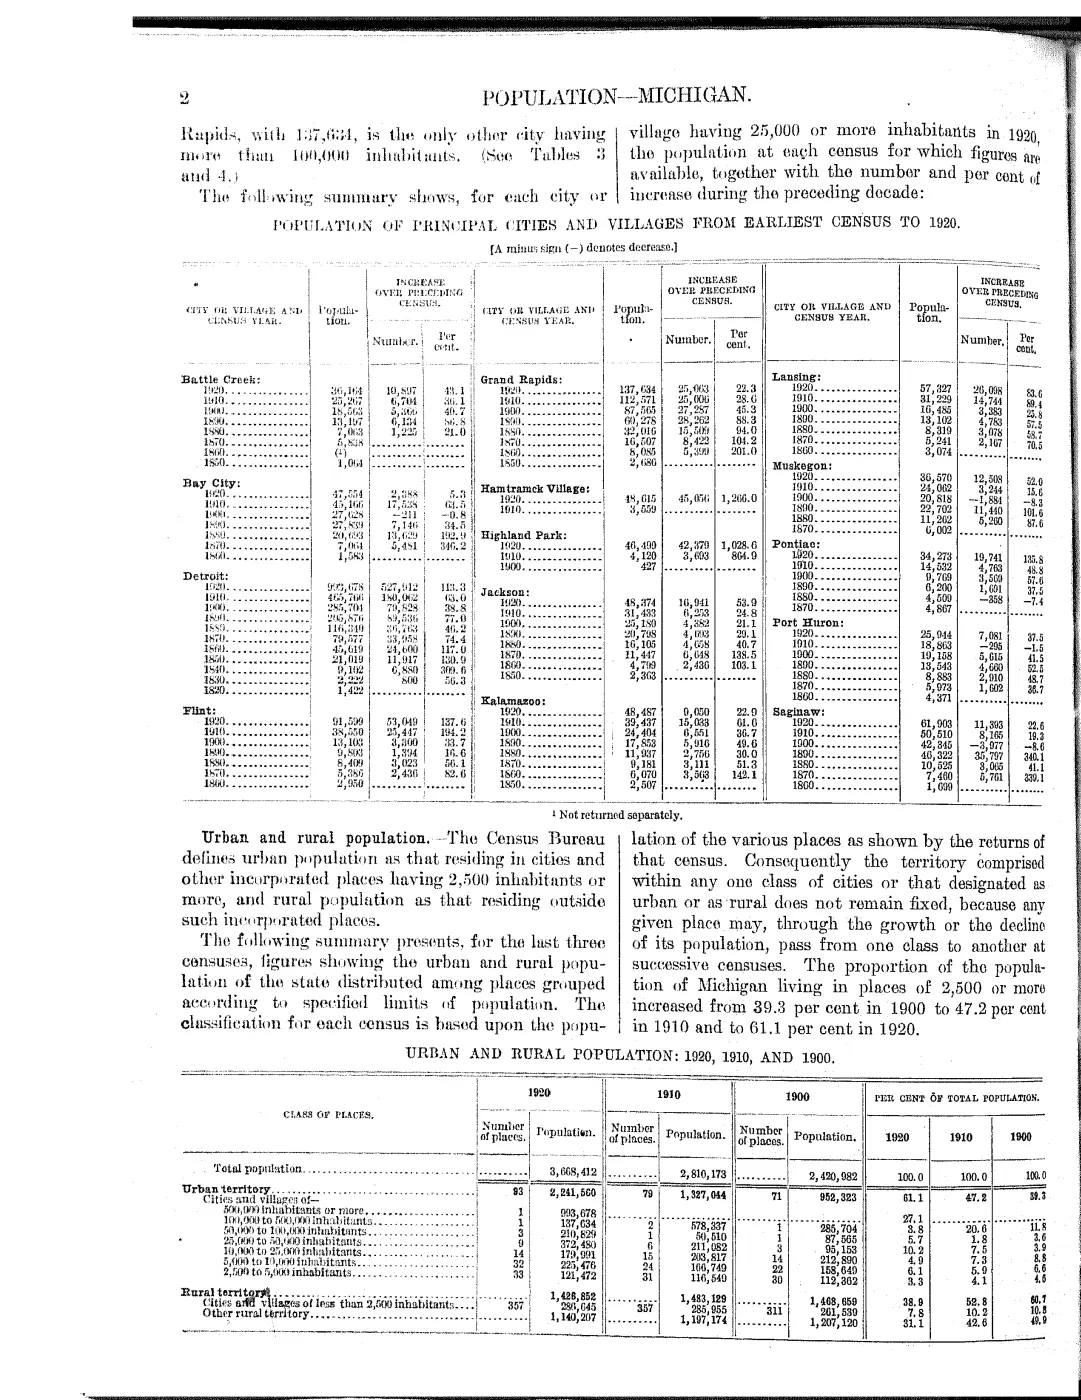
21 pages, rendered from the held scan.
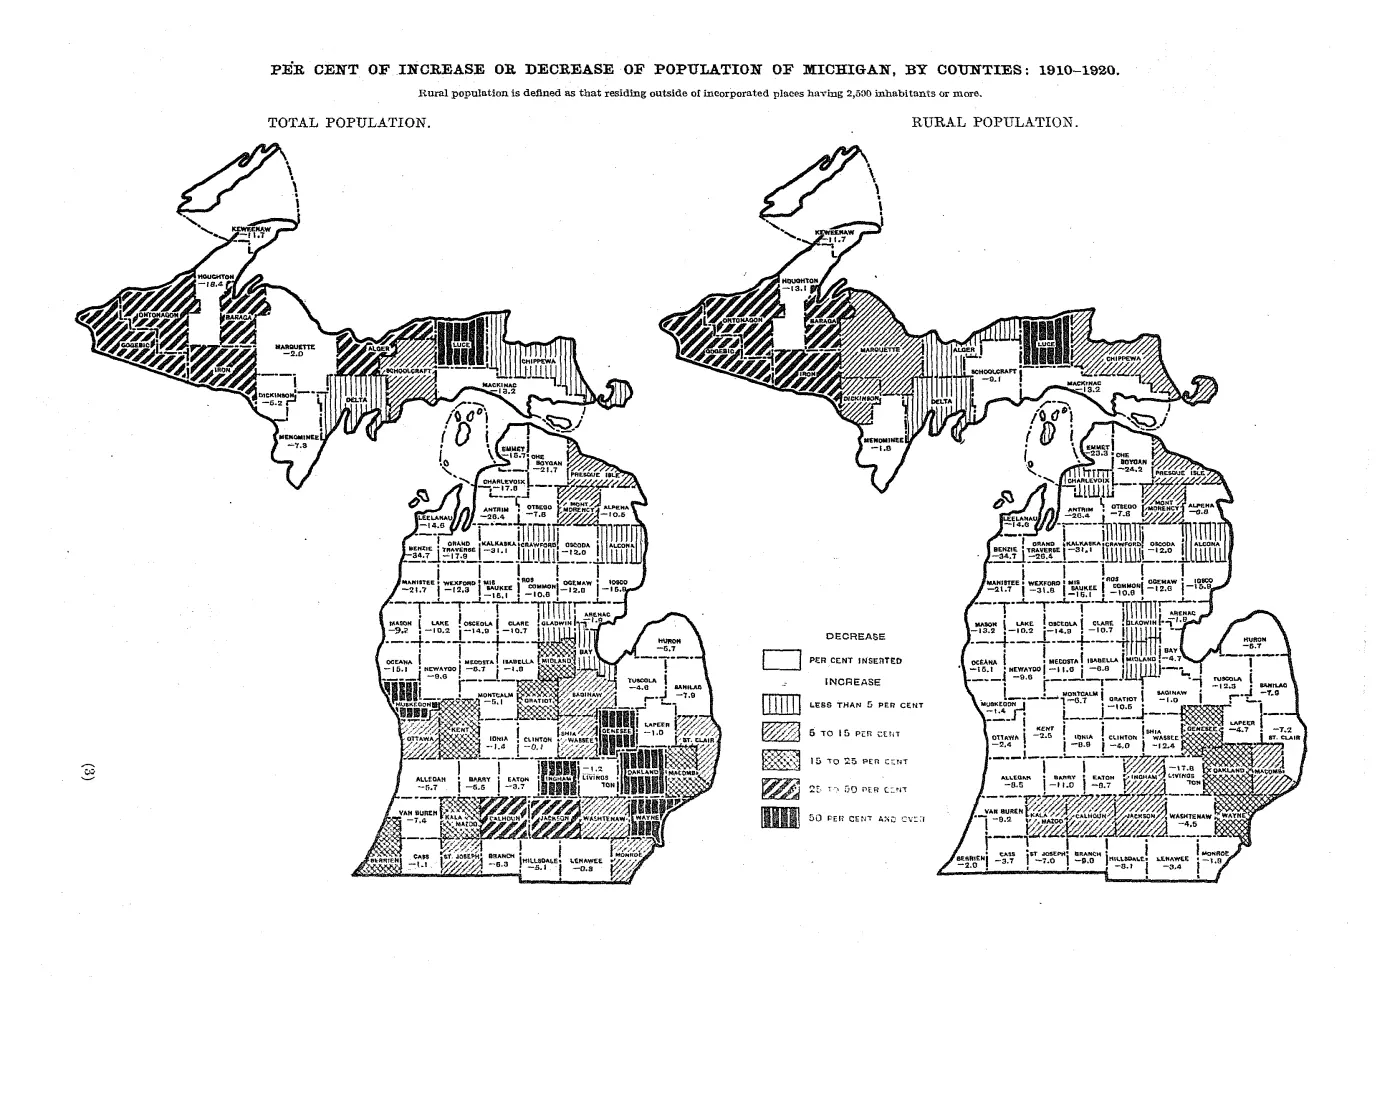
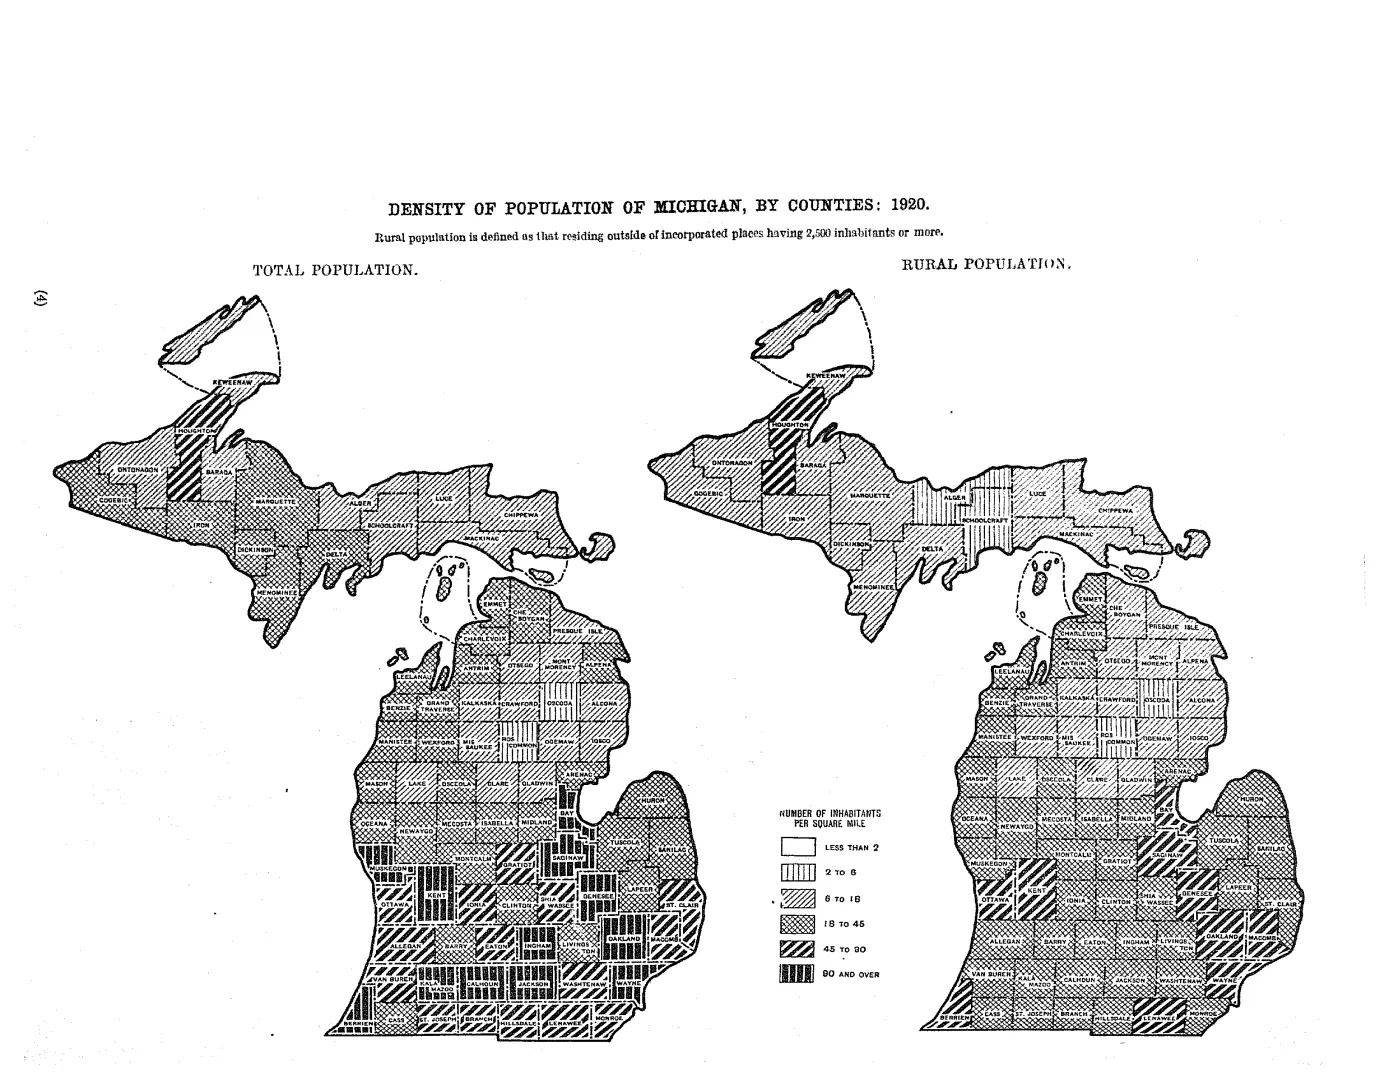
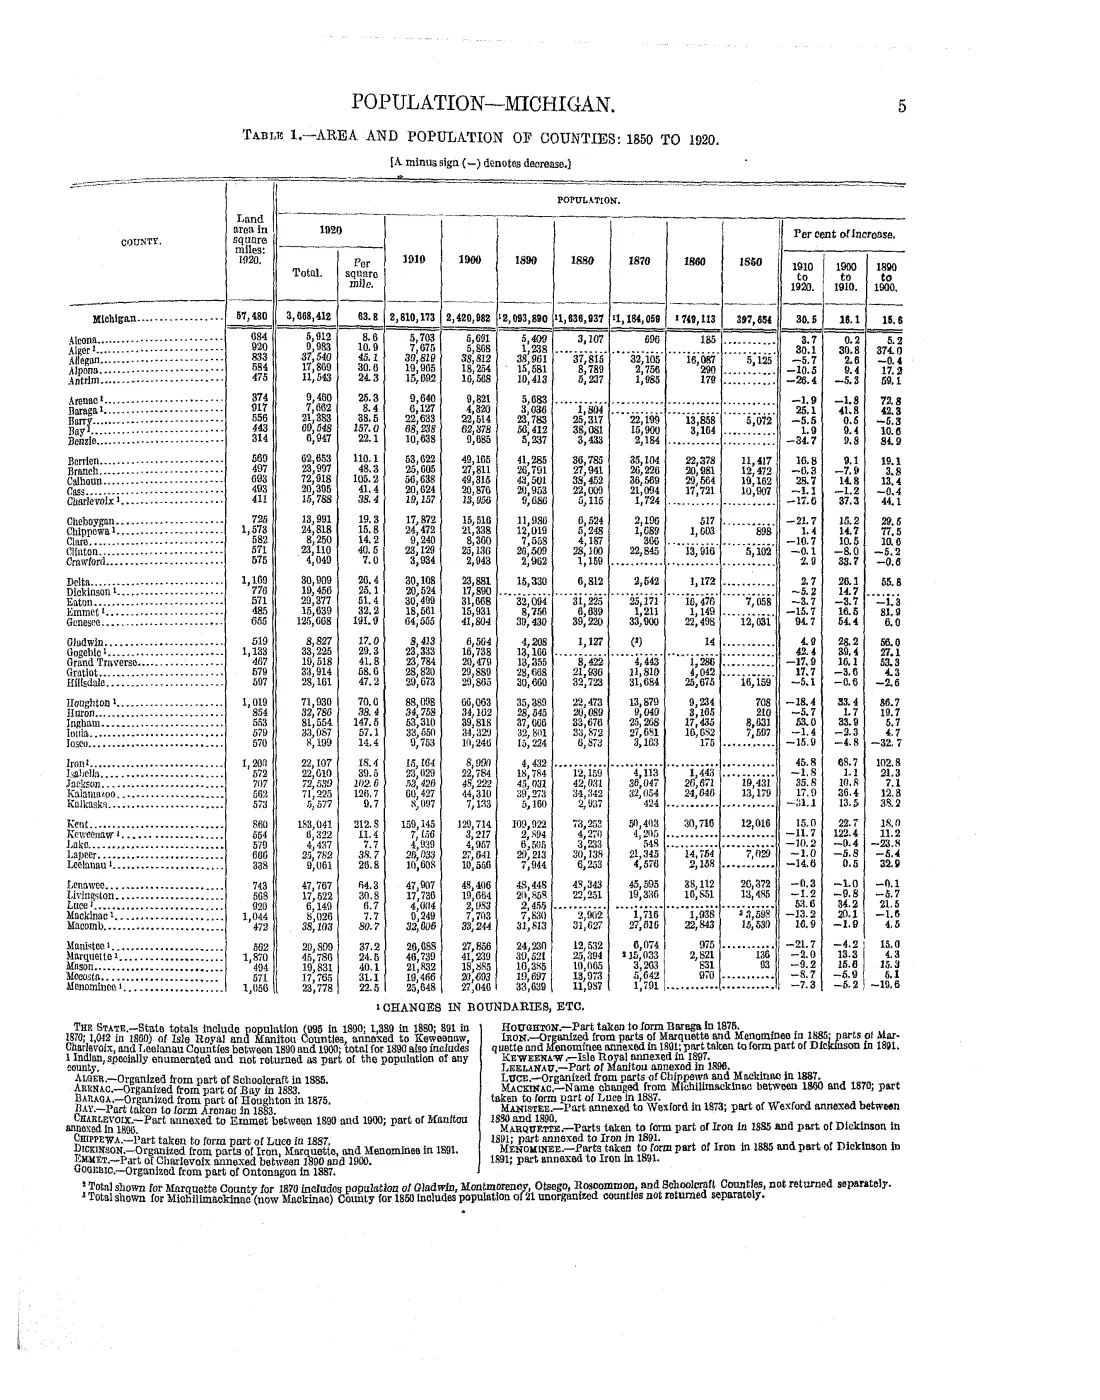
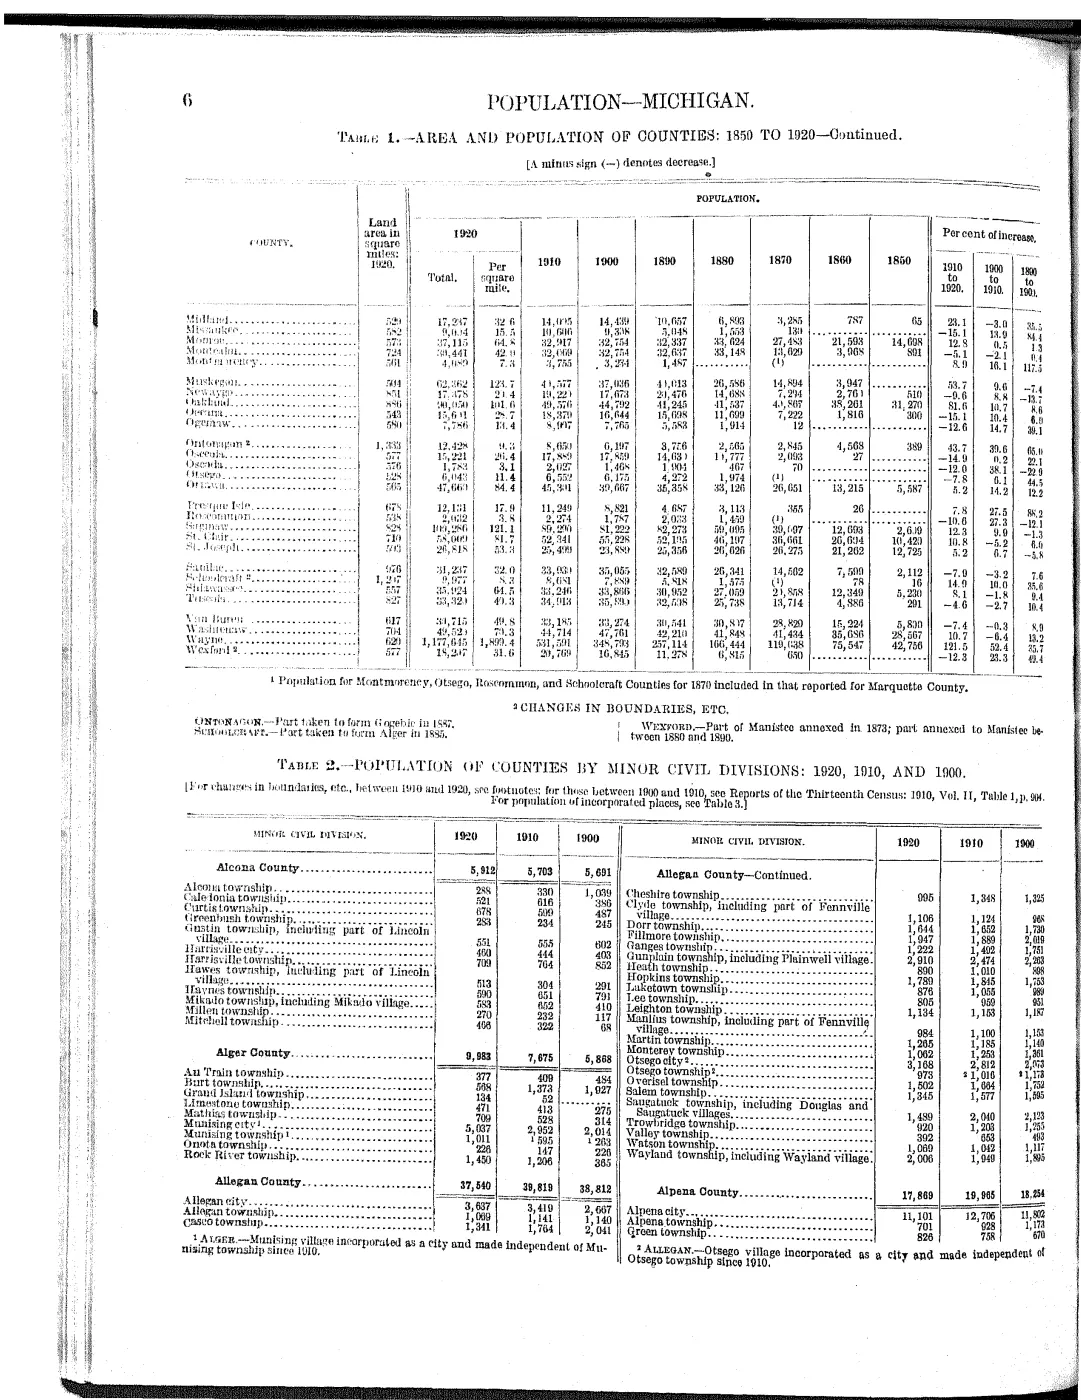

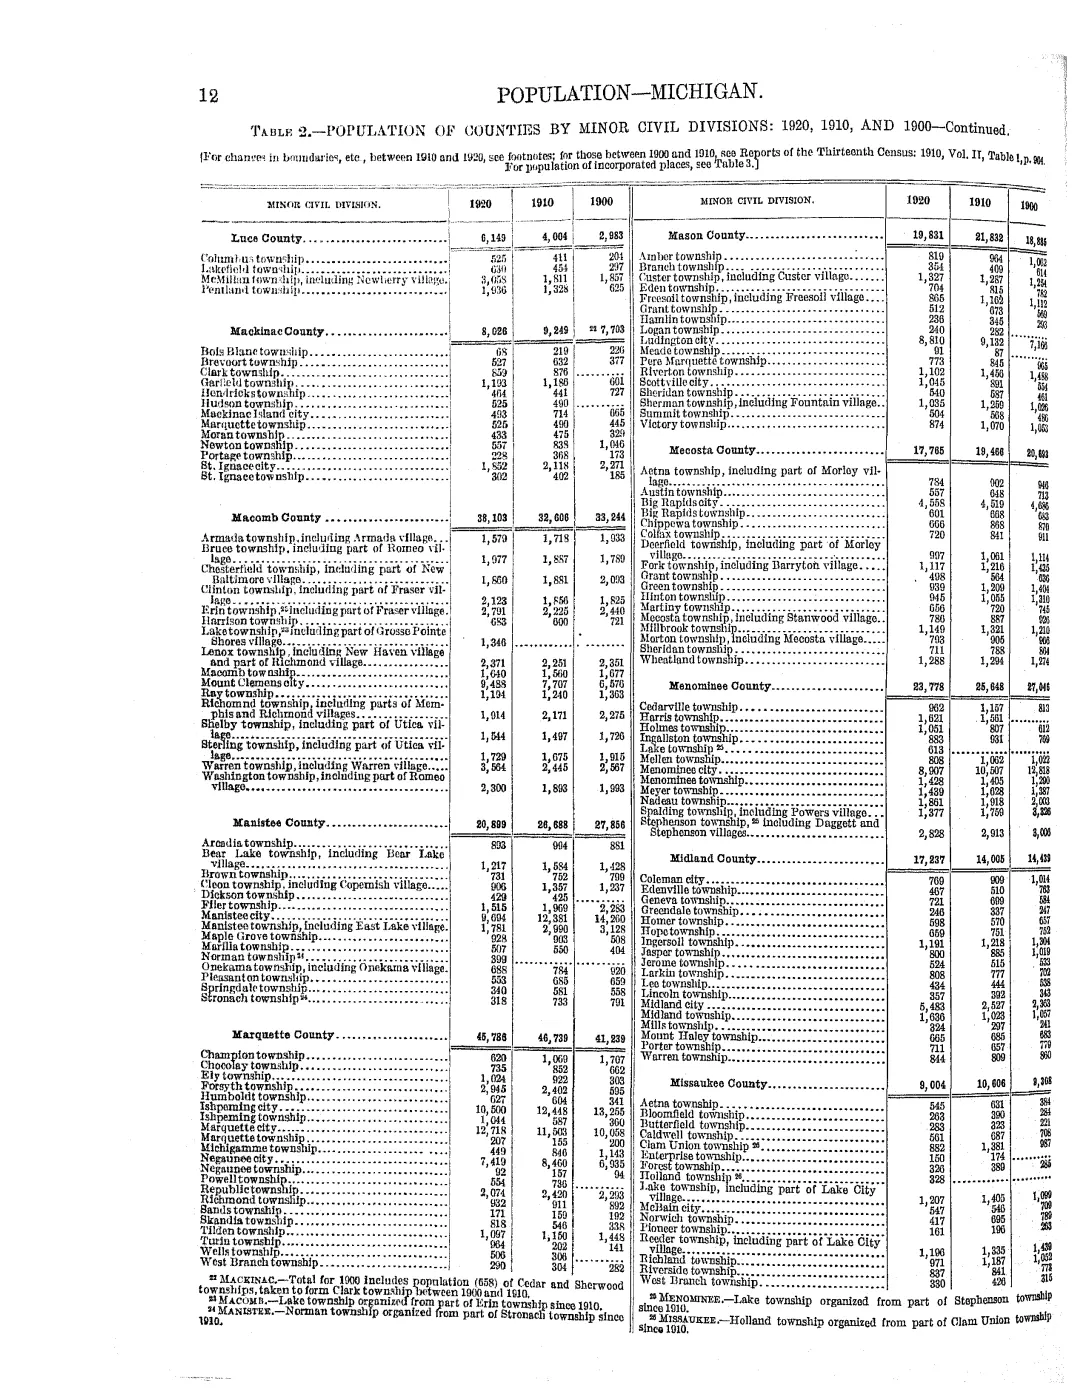
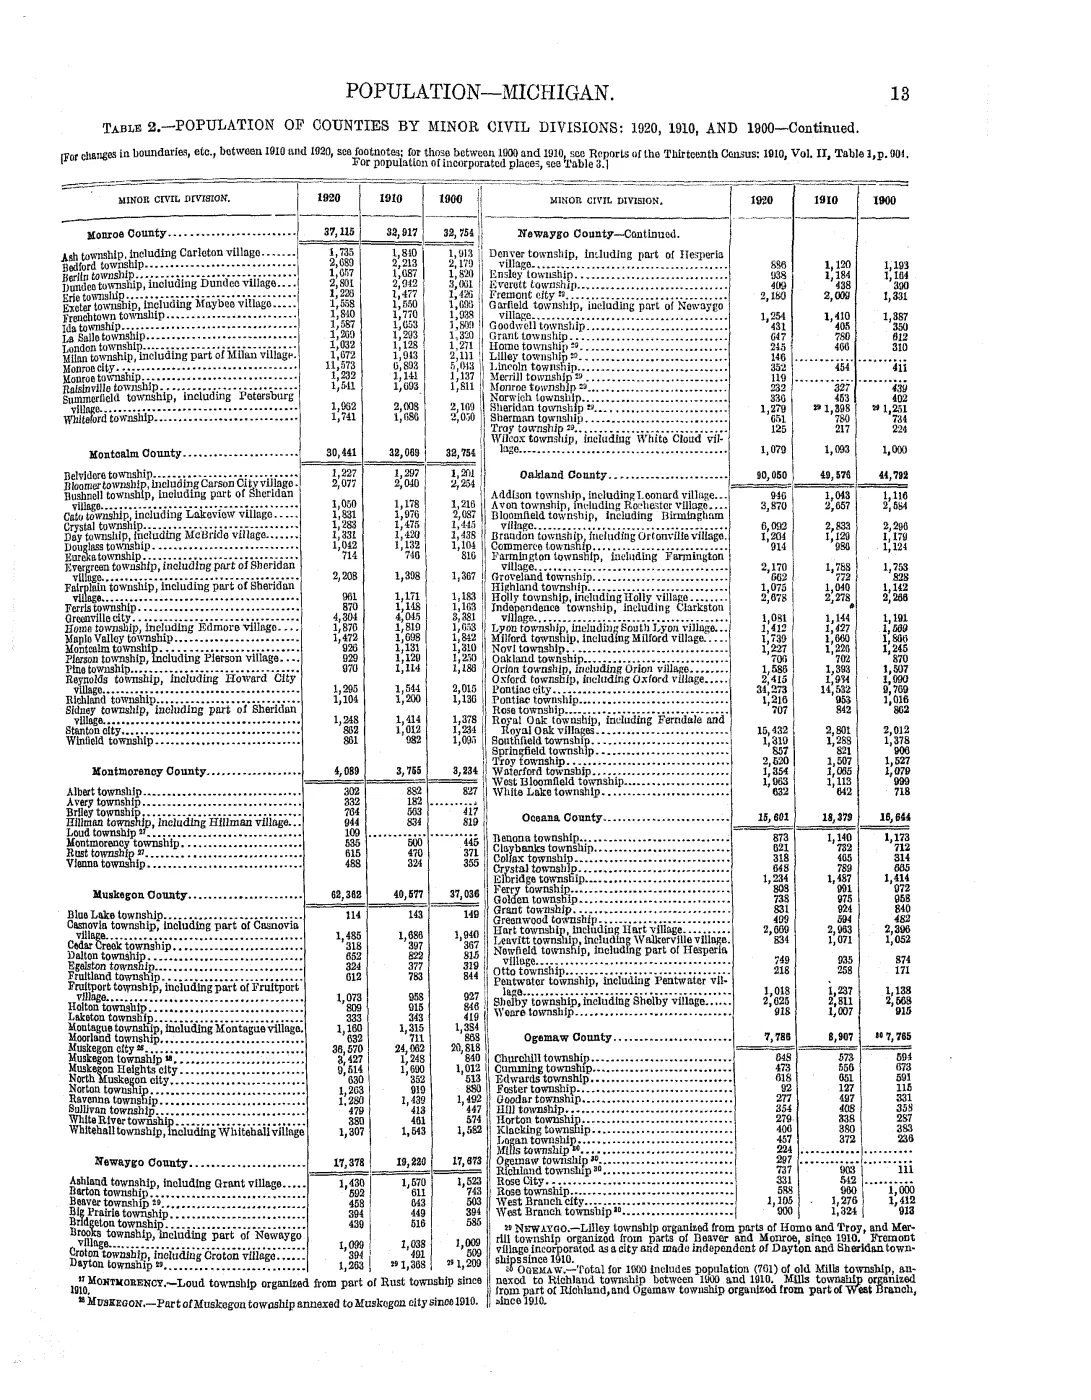
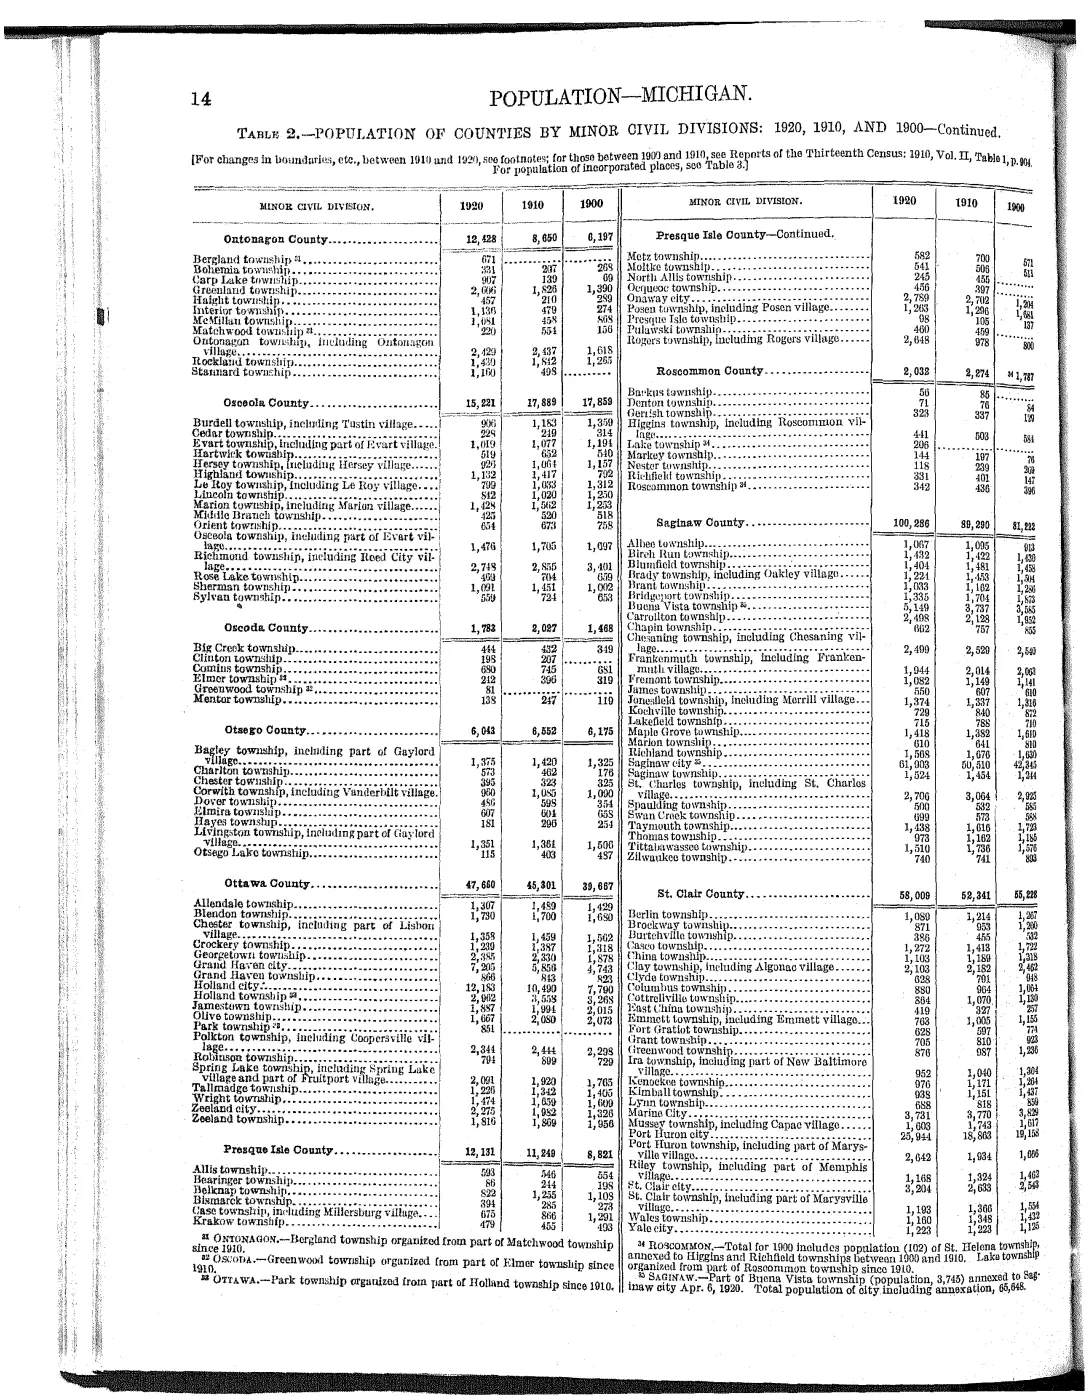
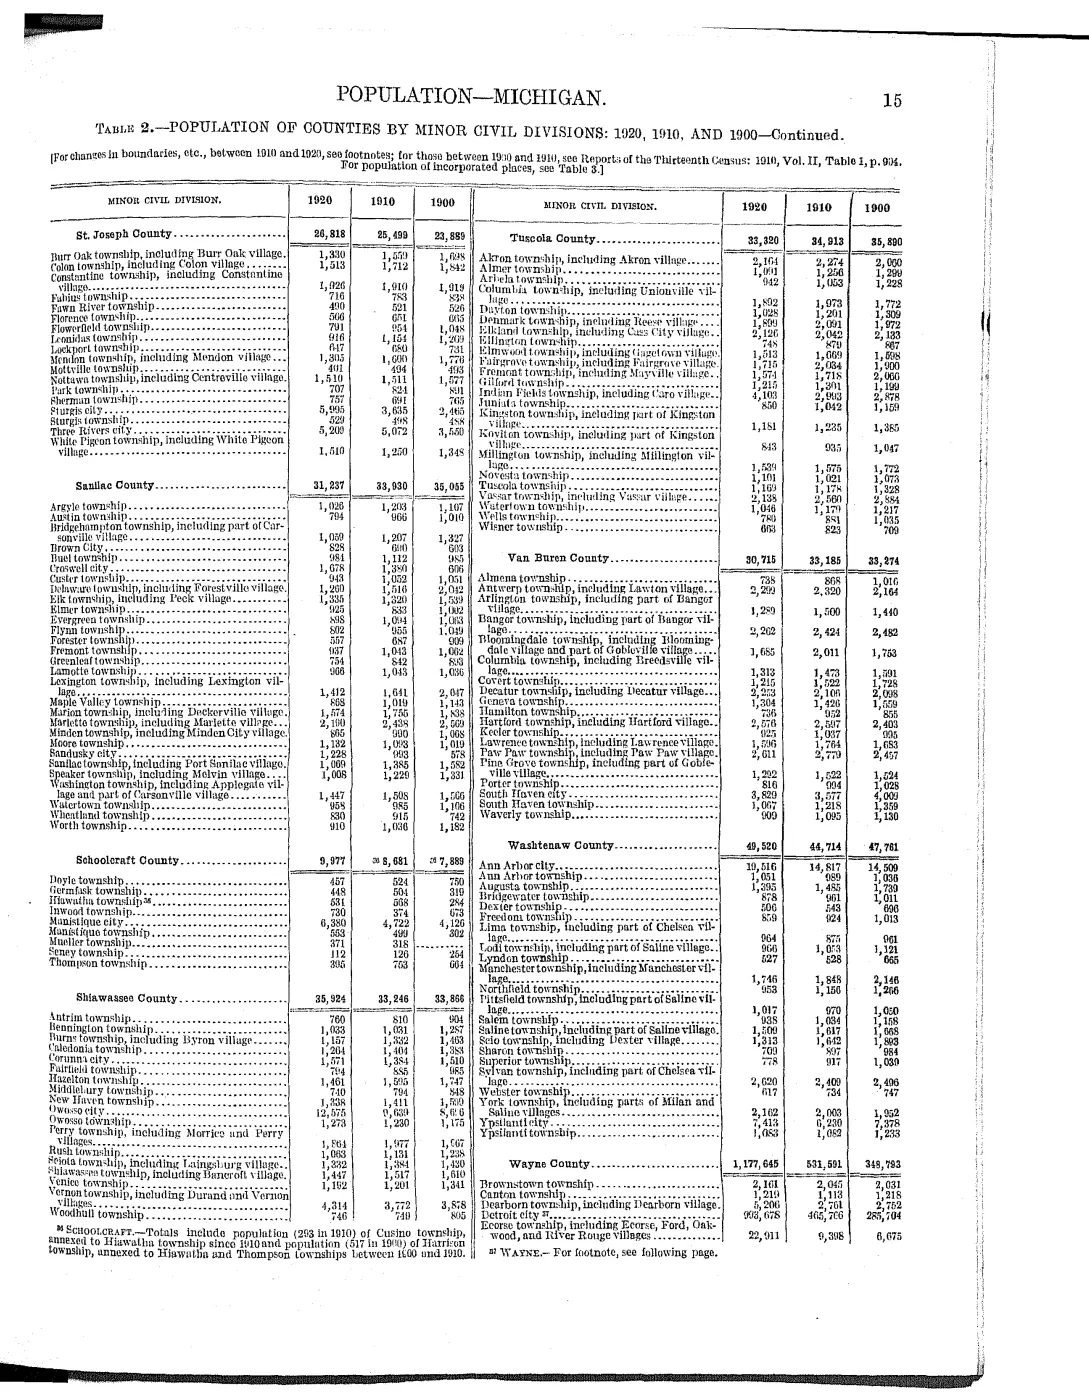
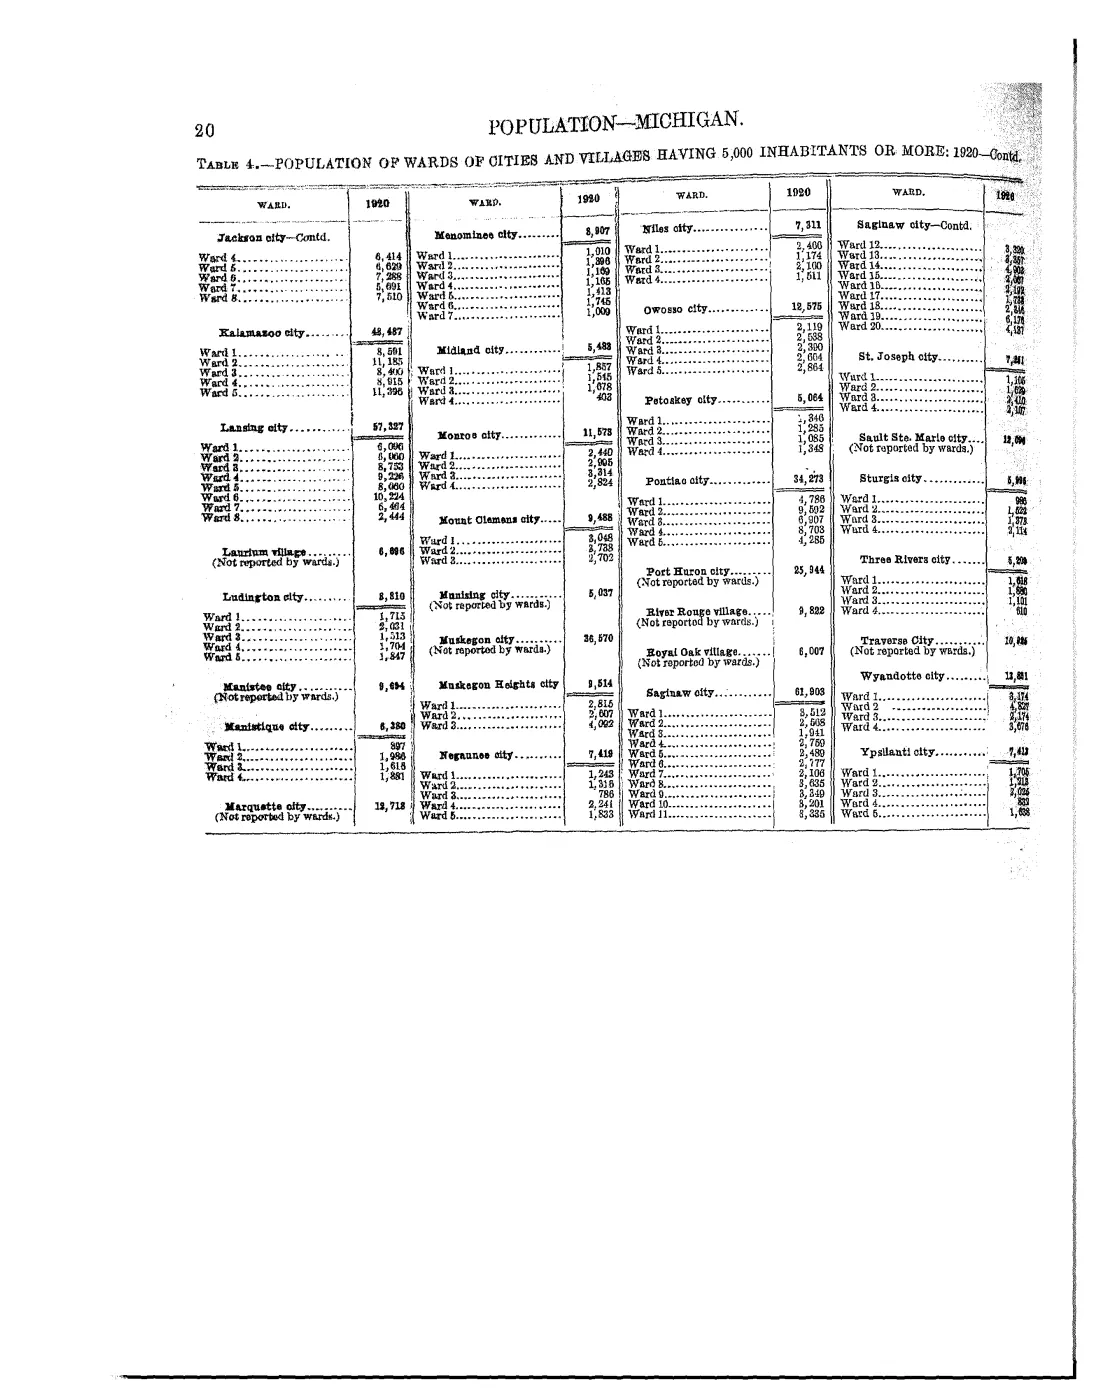
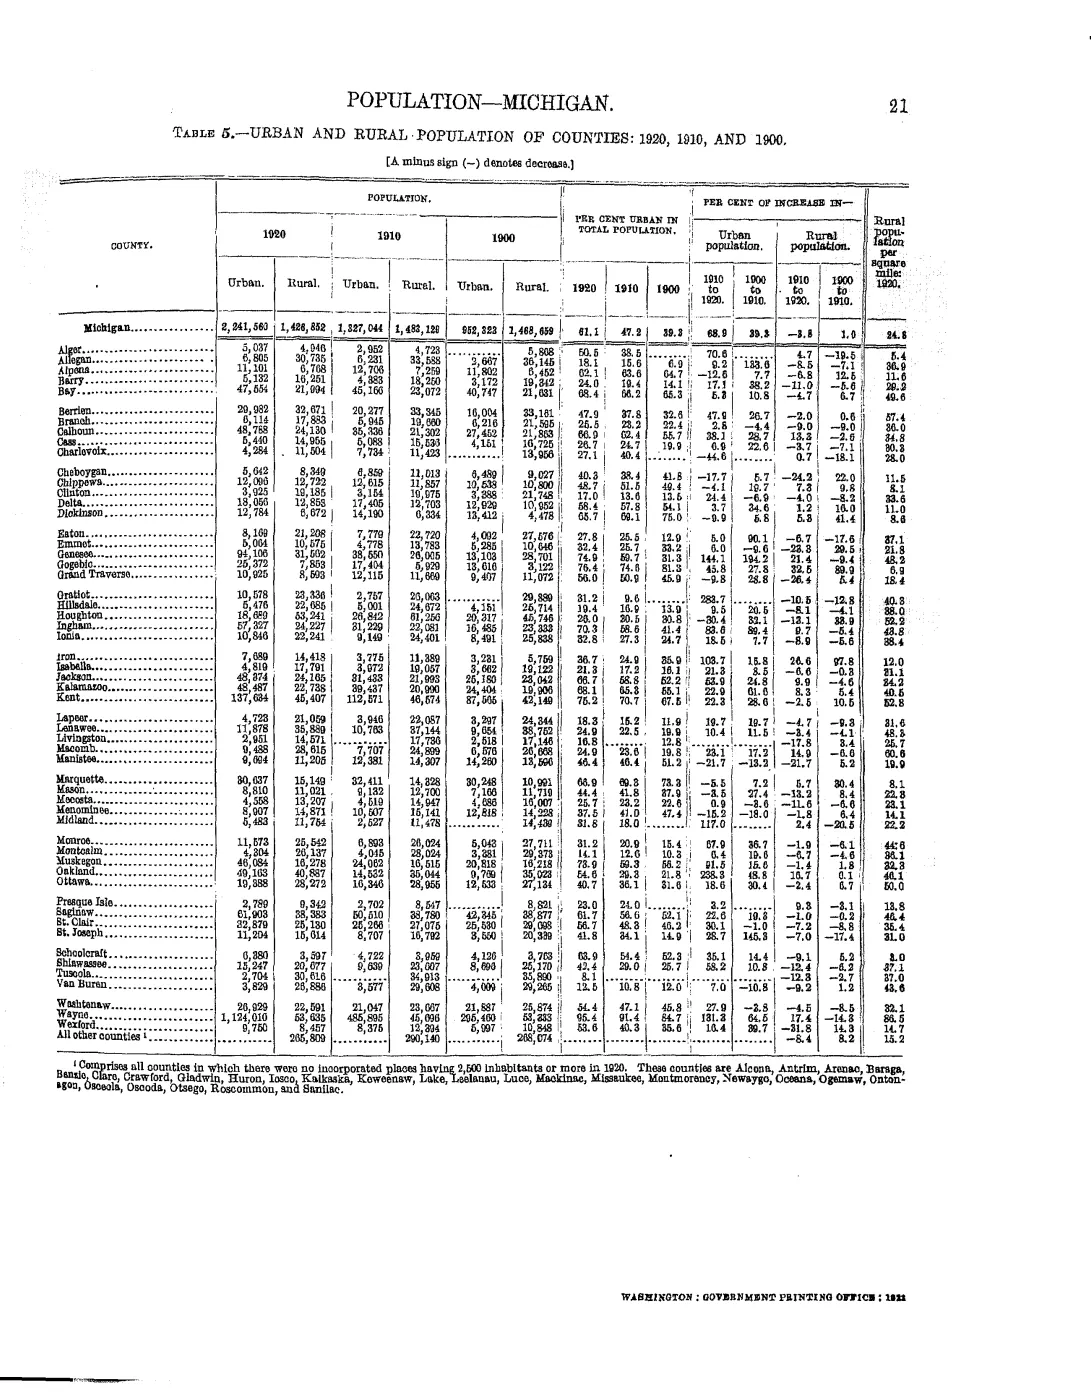
Read the document
38 pages, rendered from the held scan.
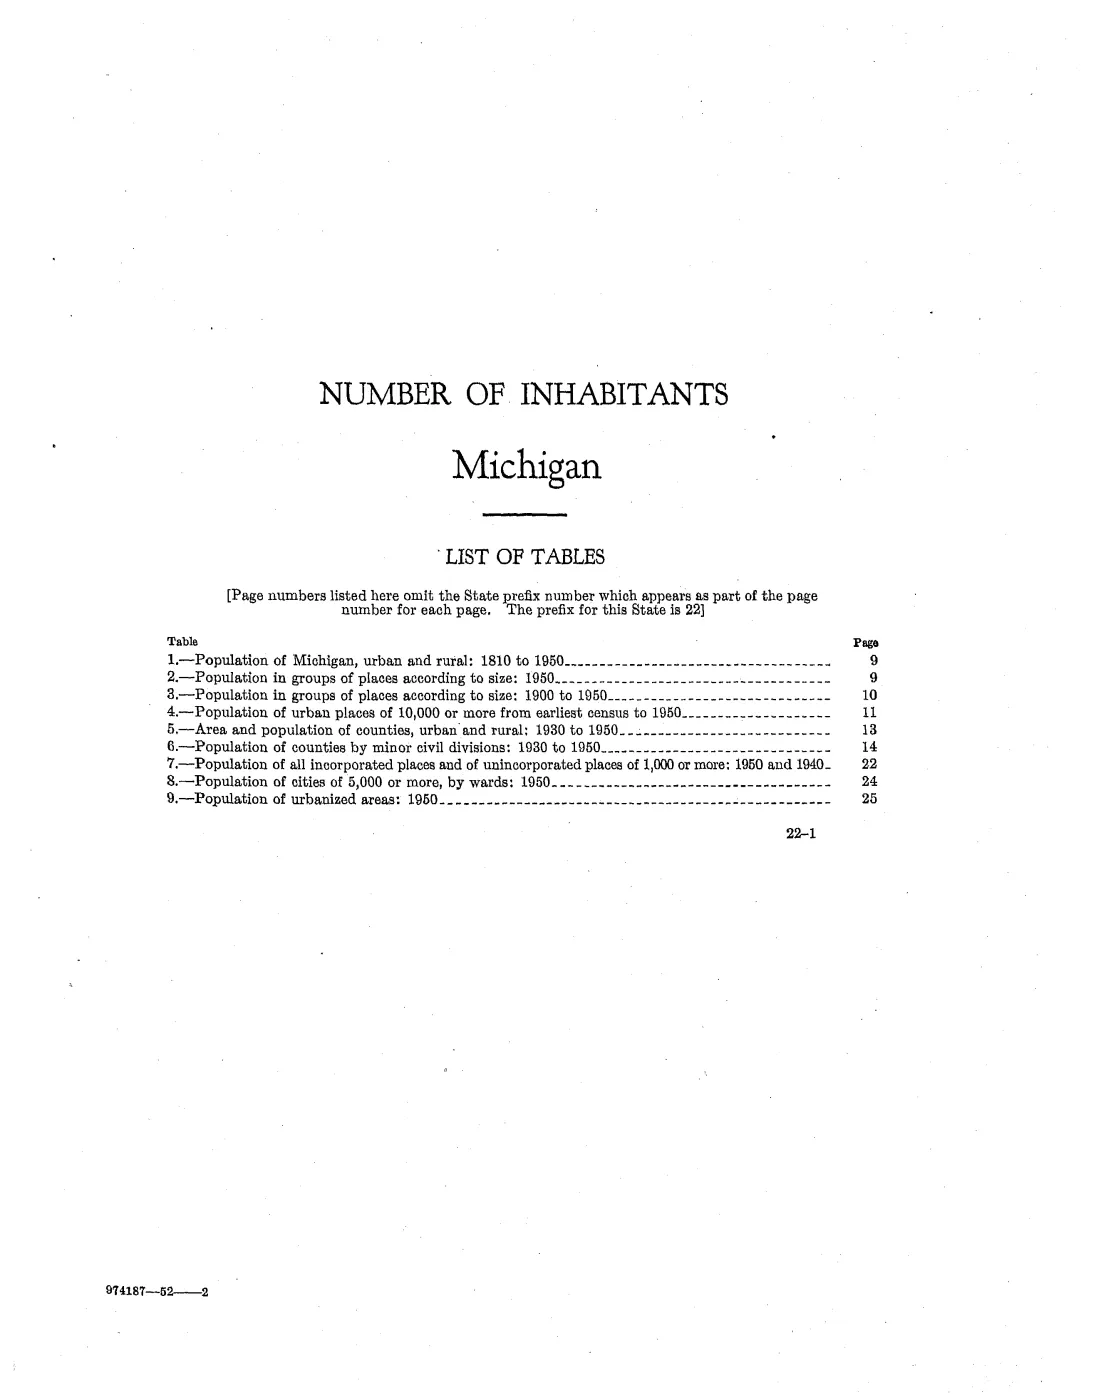
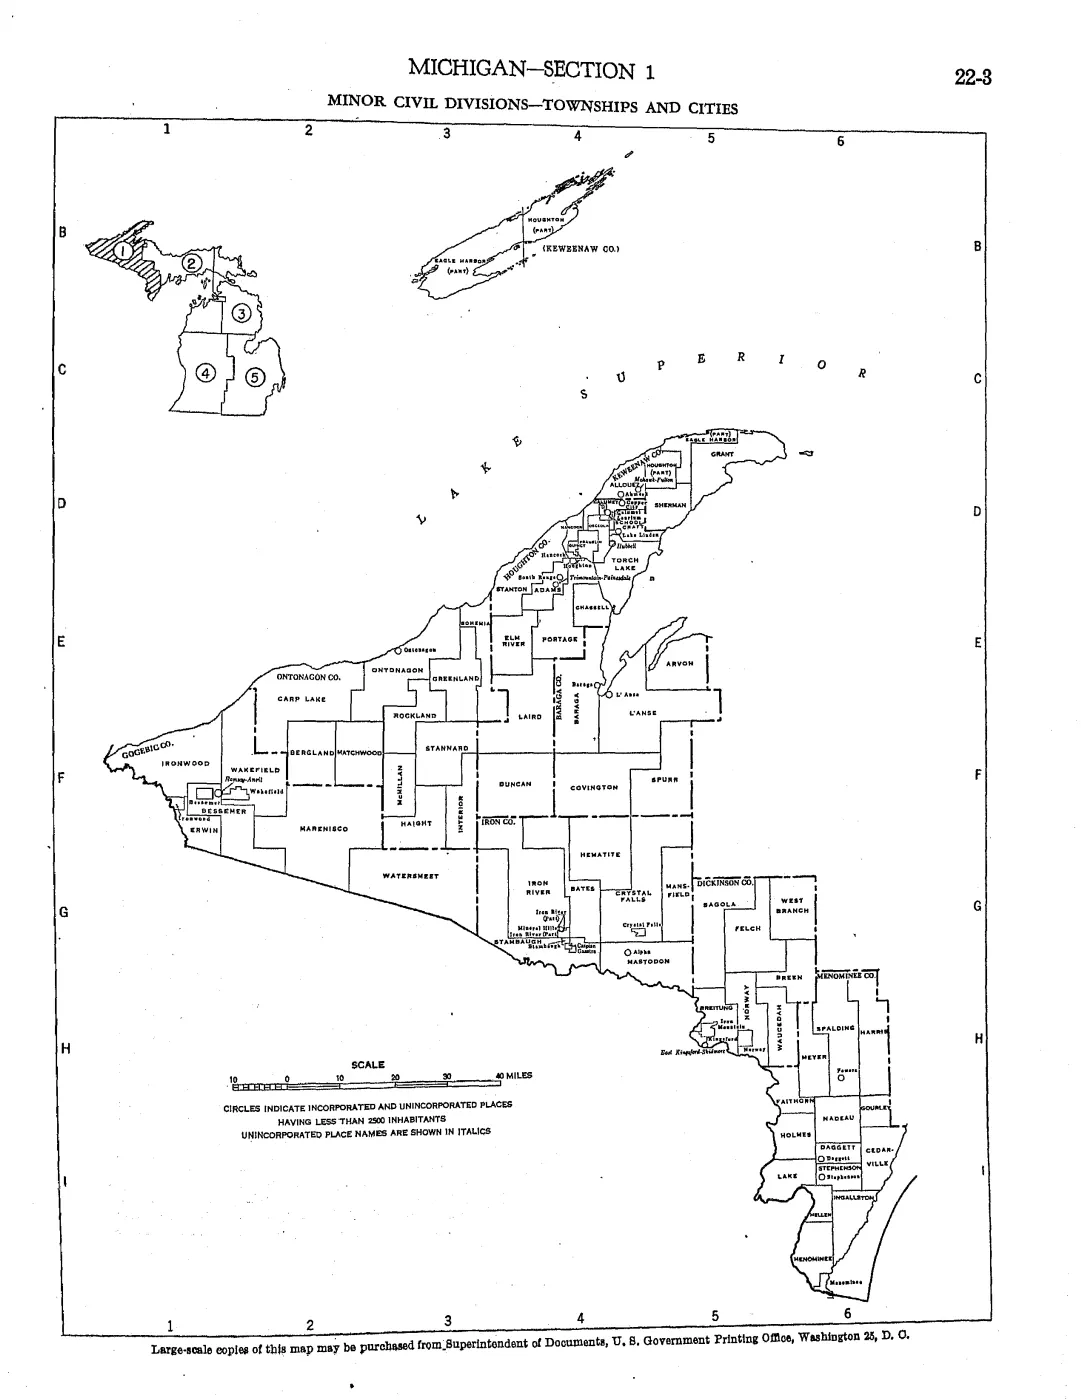
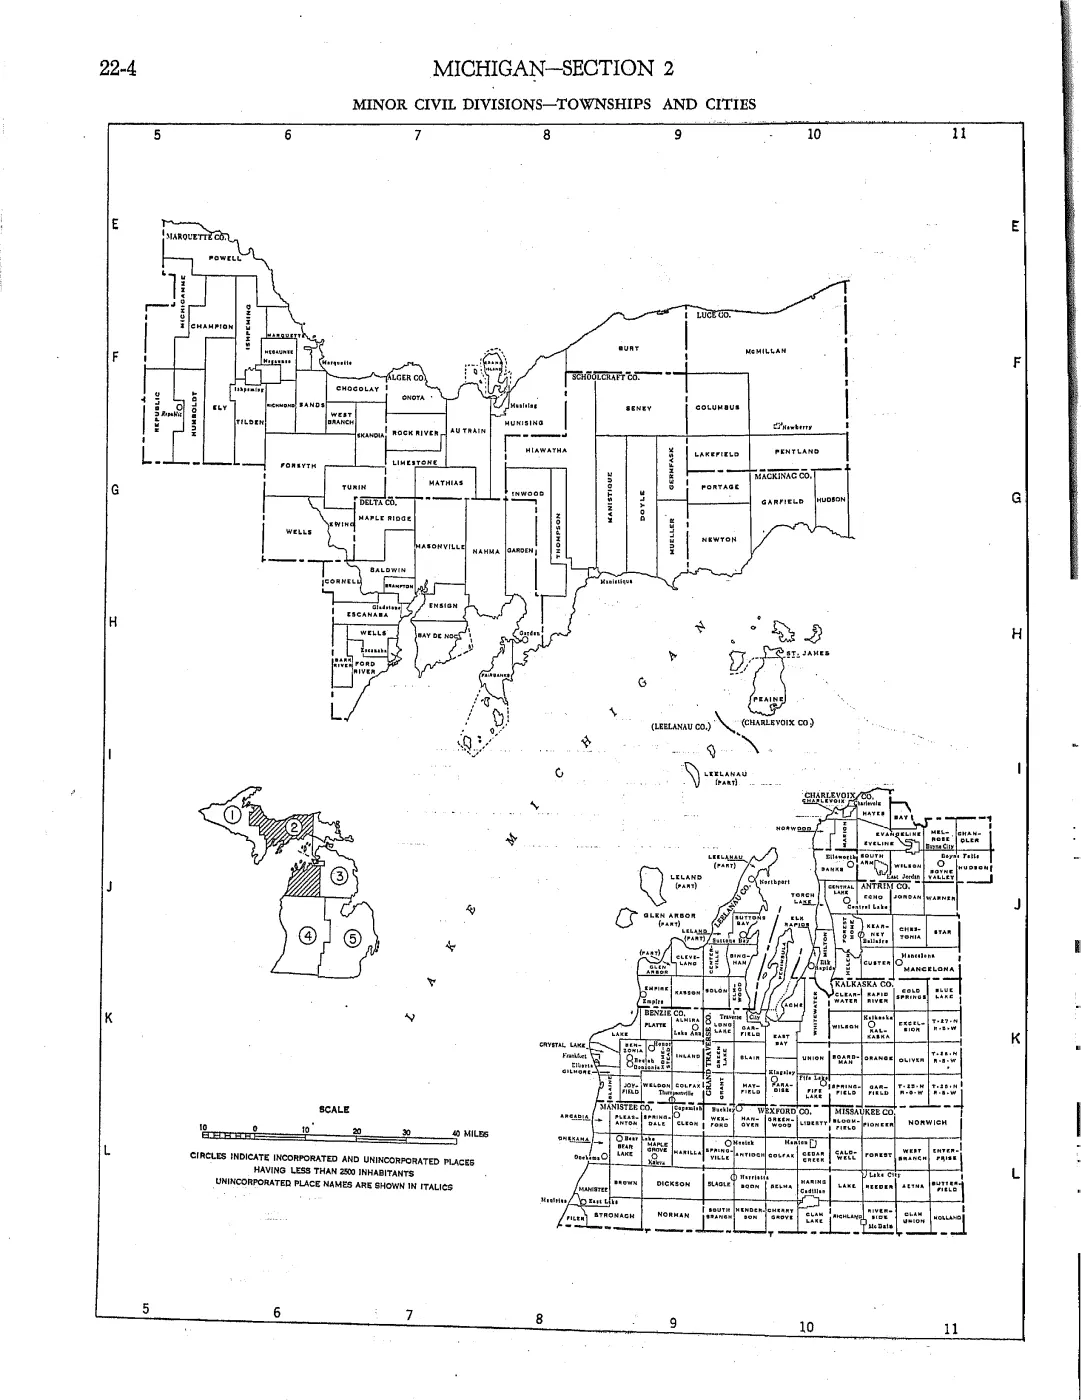
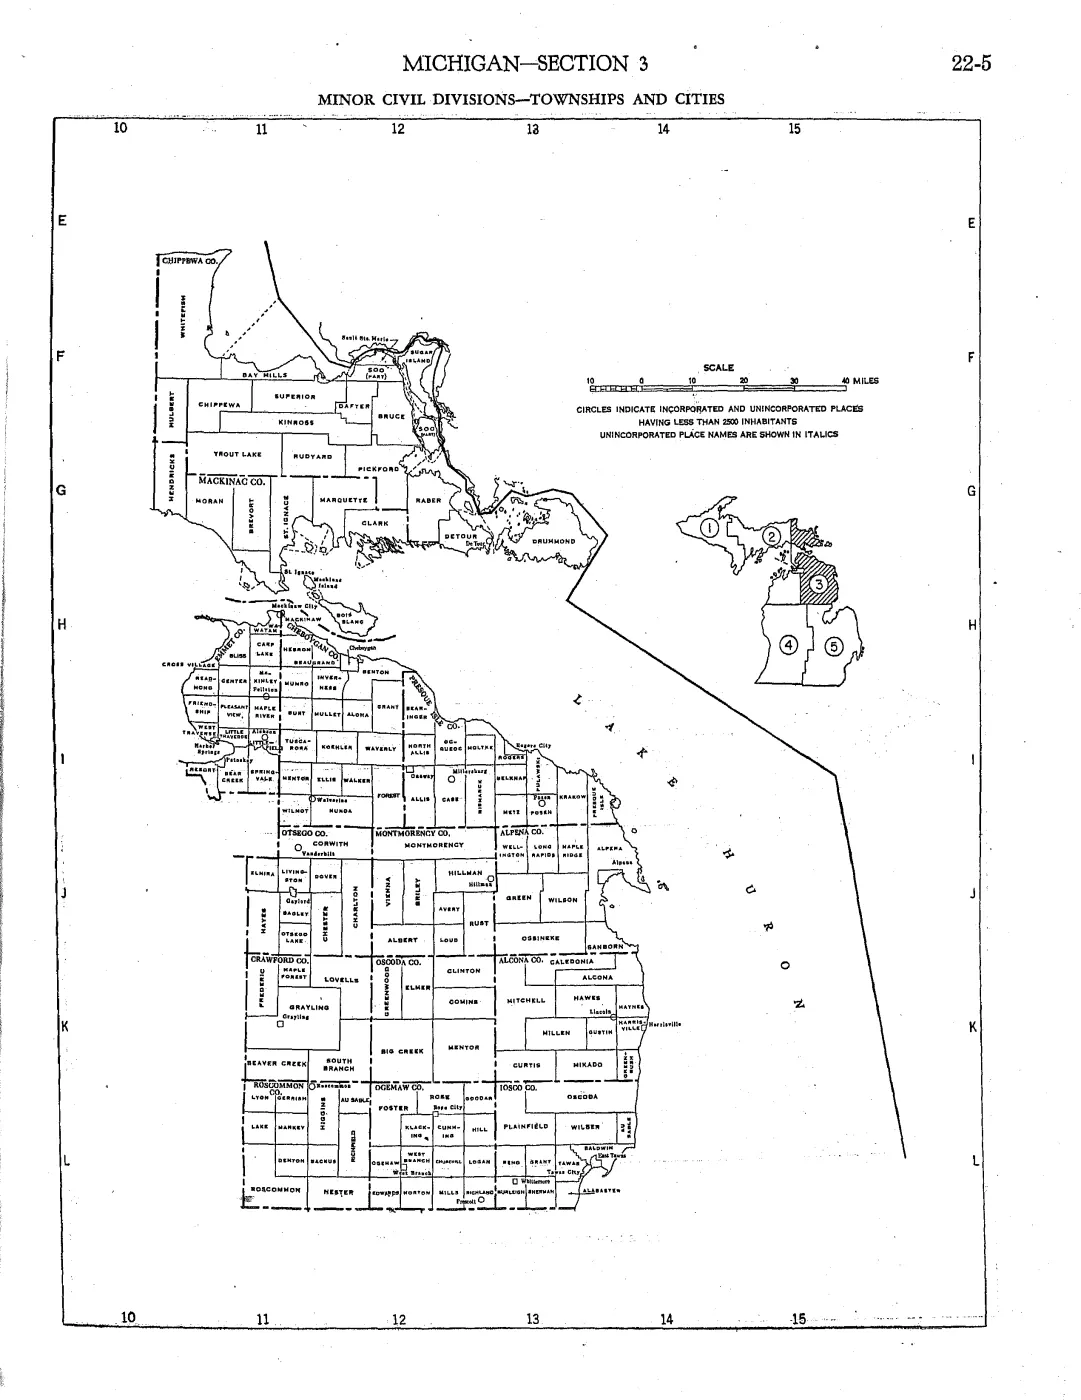
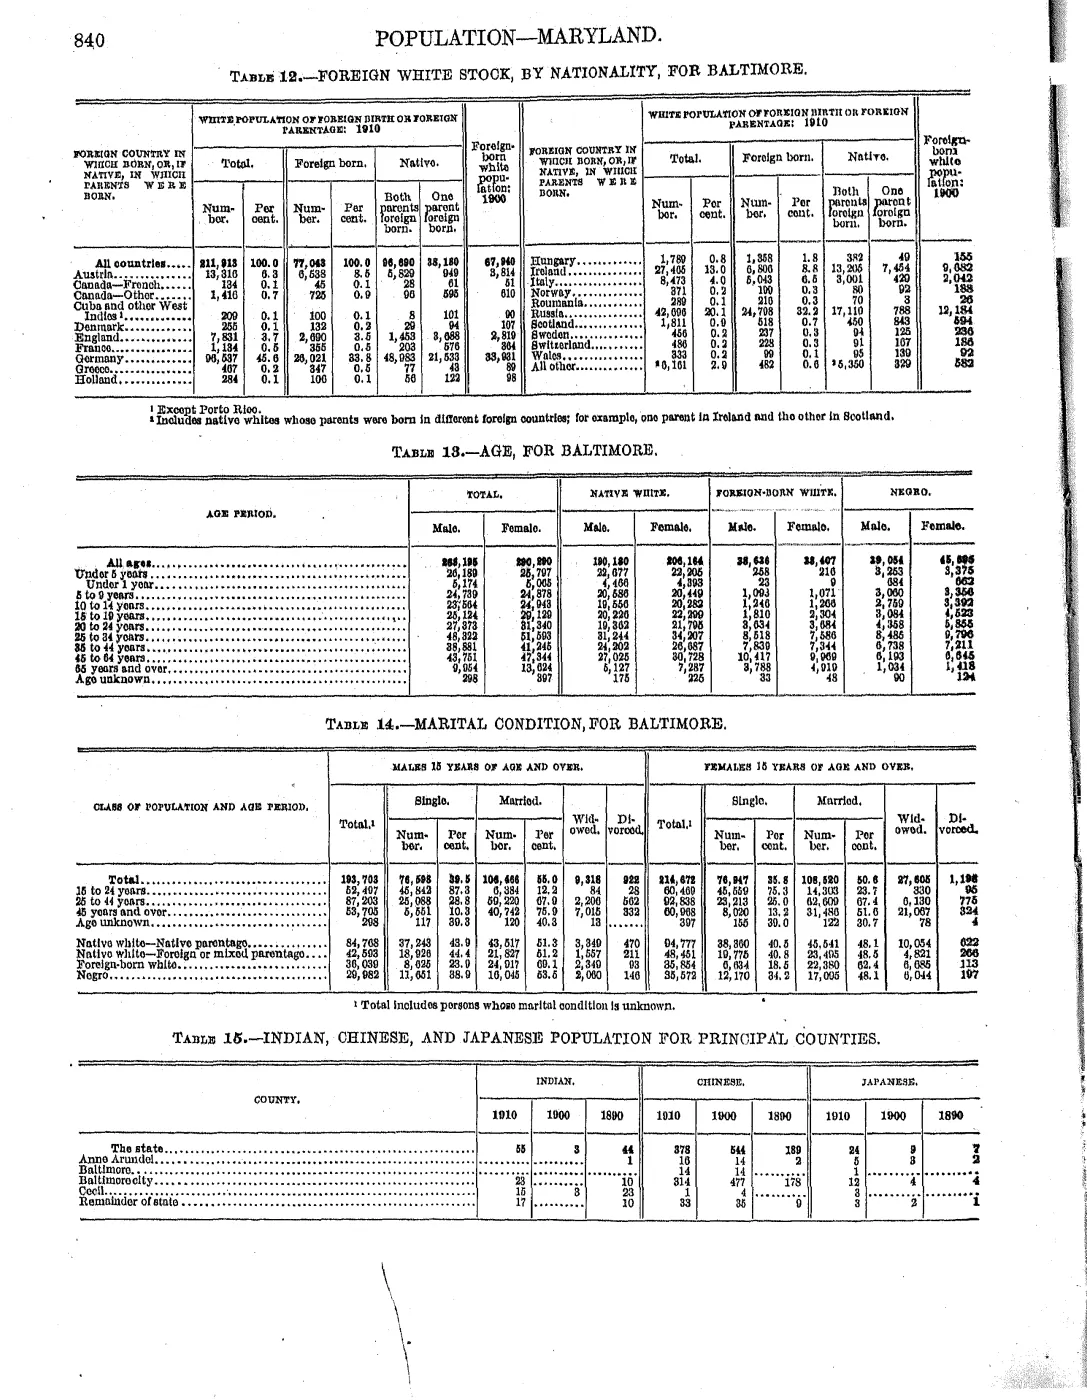
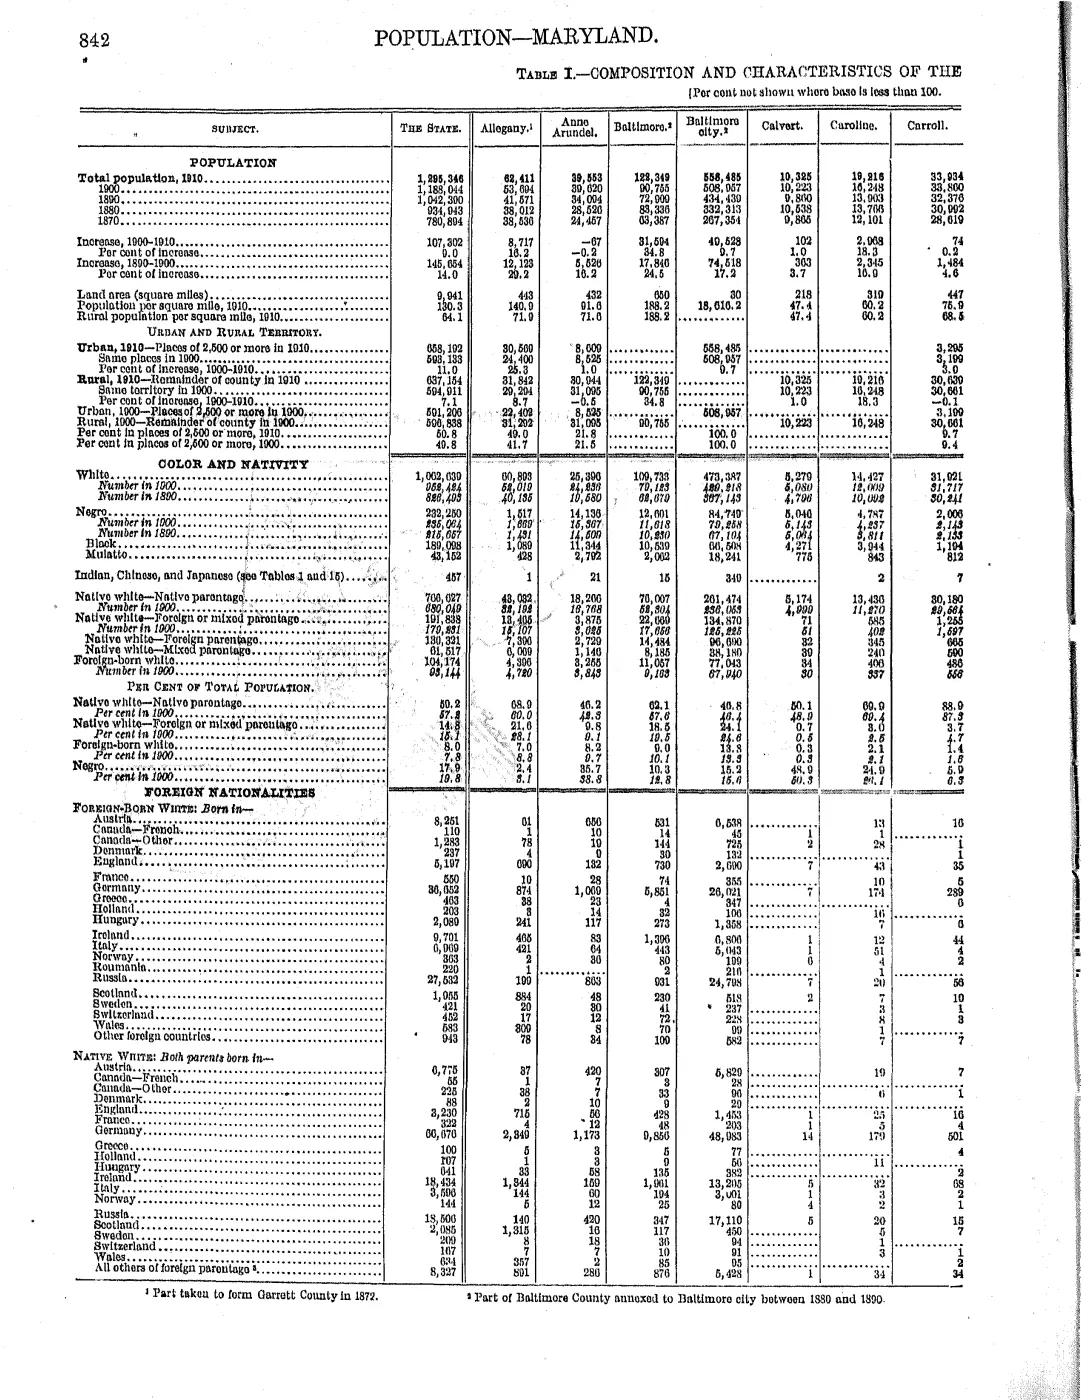
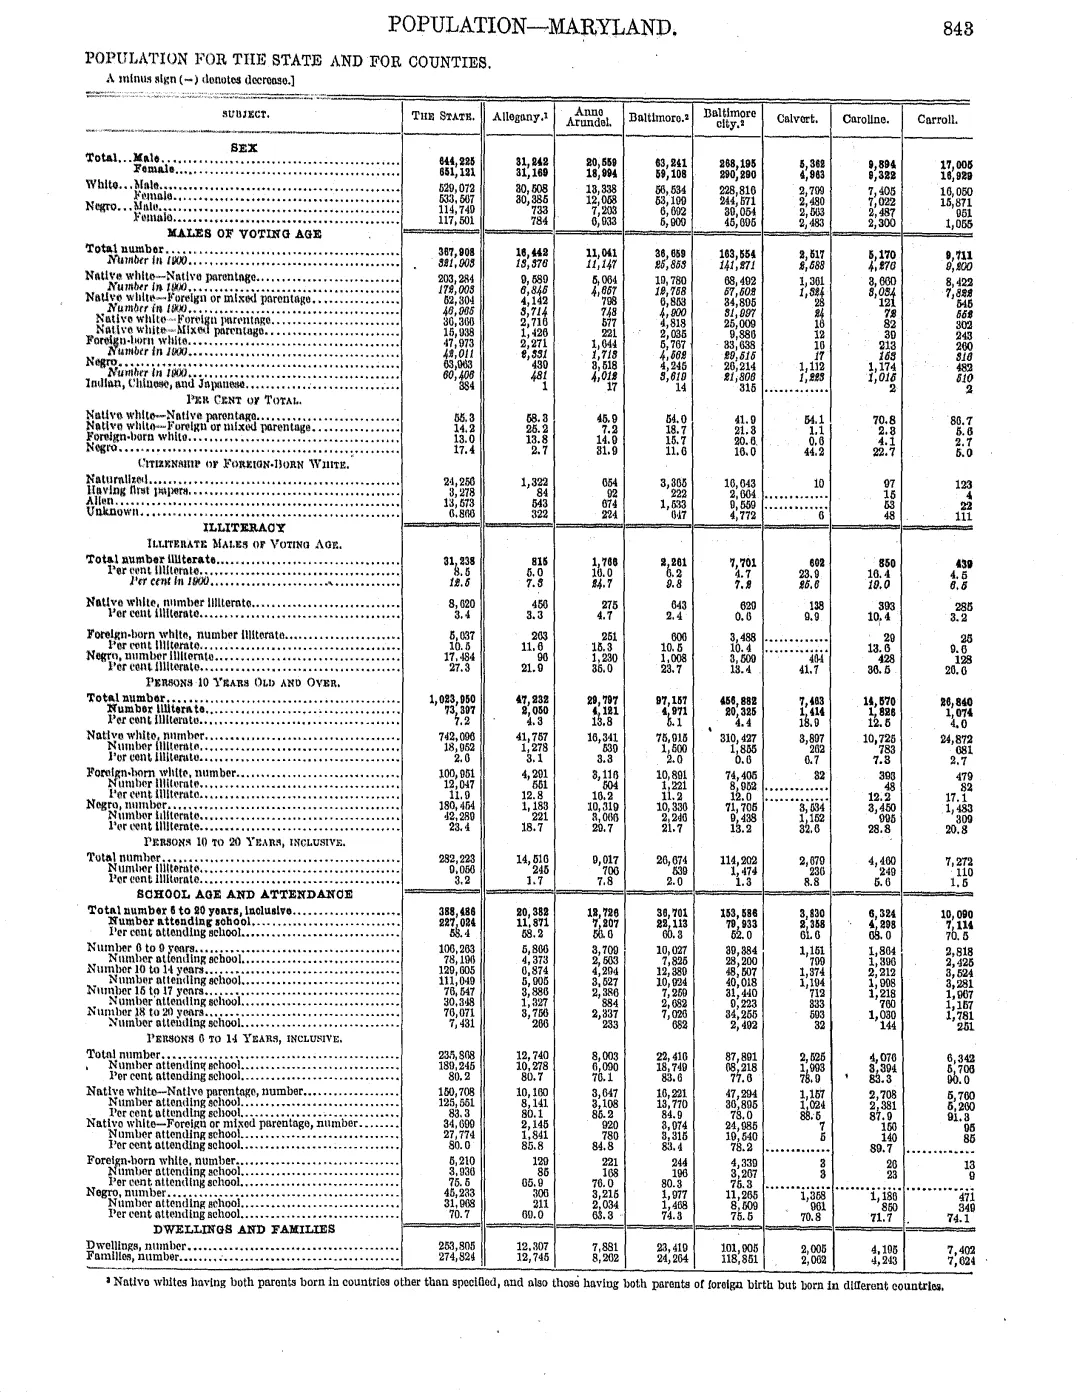
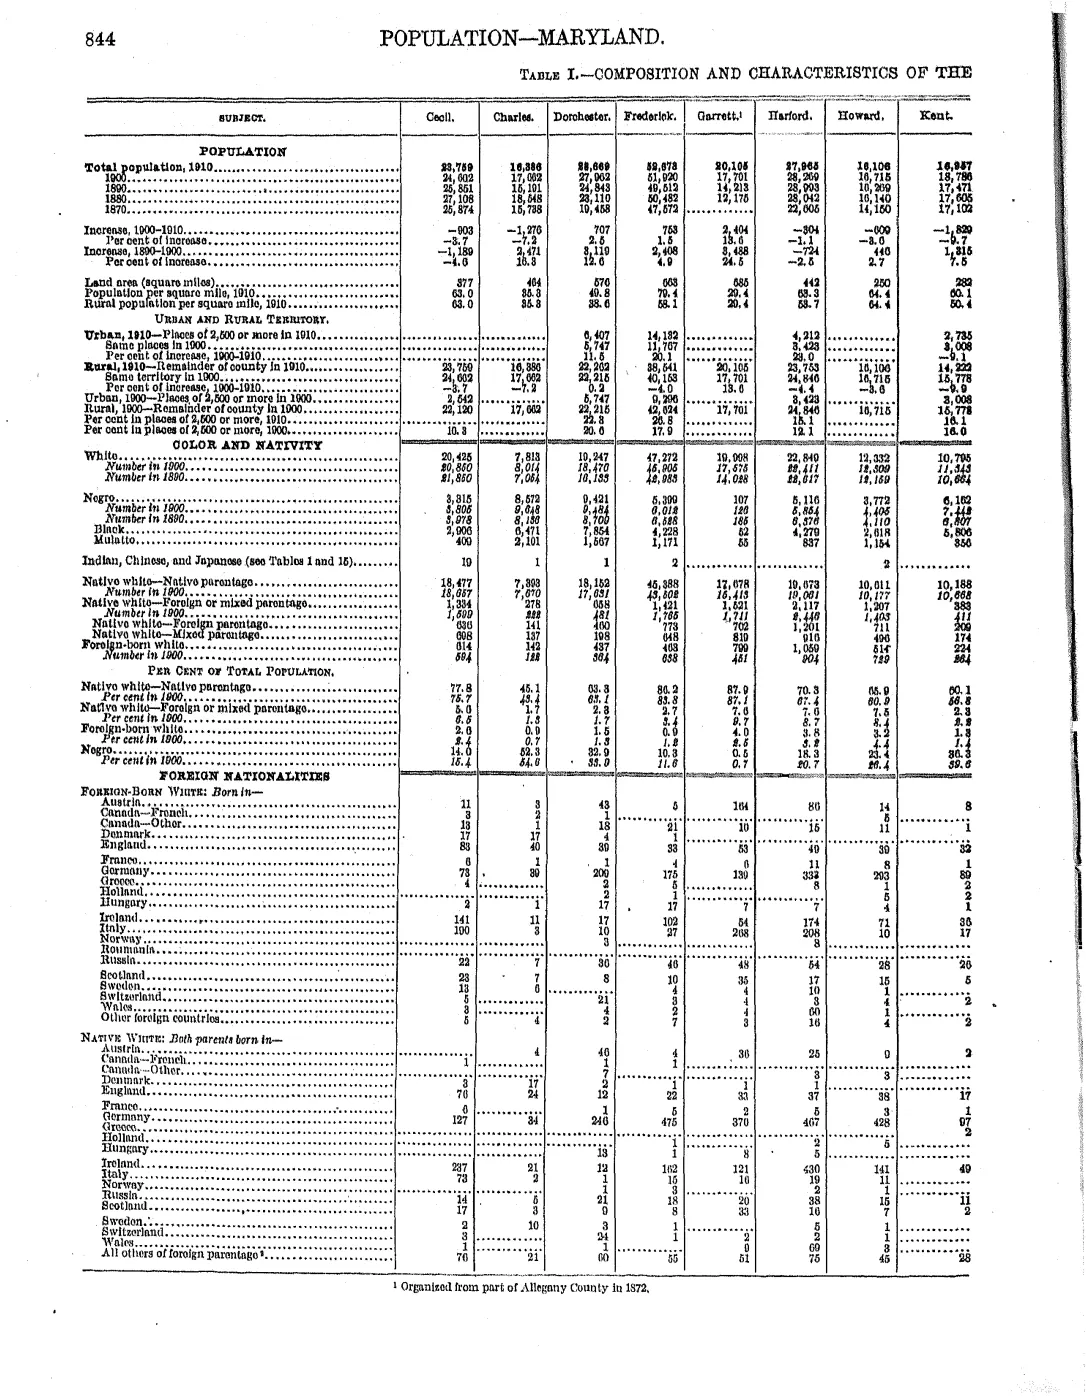
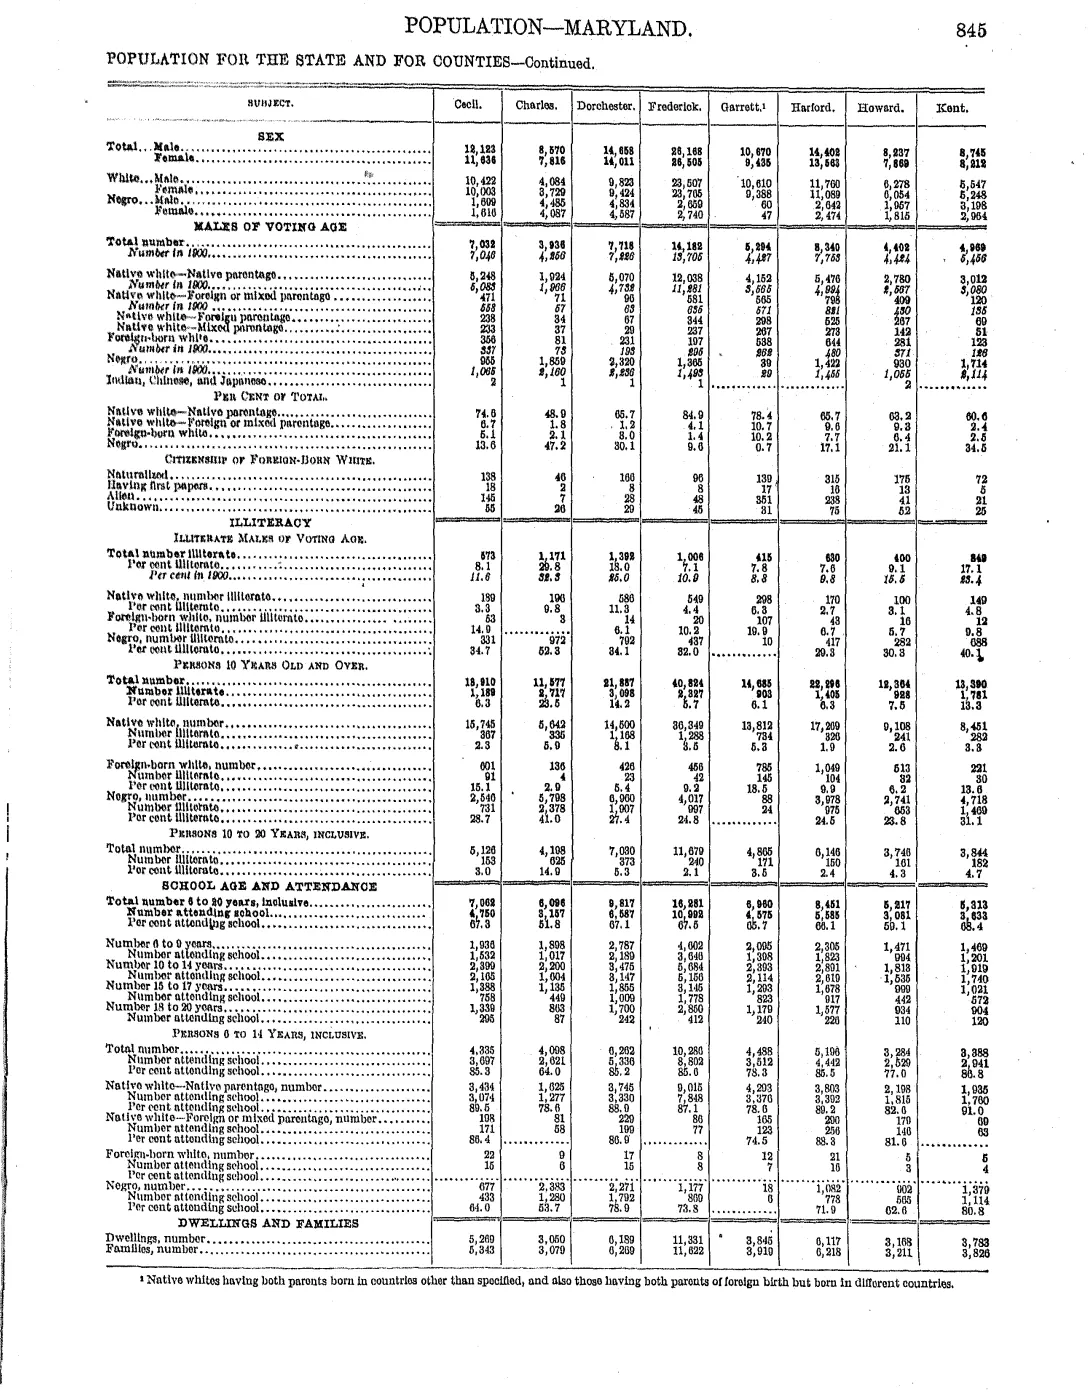
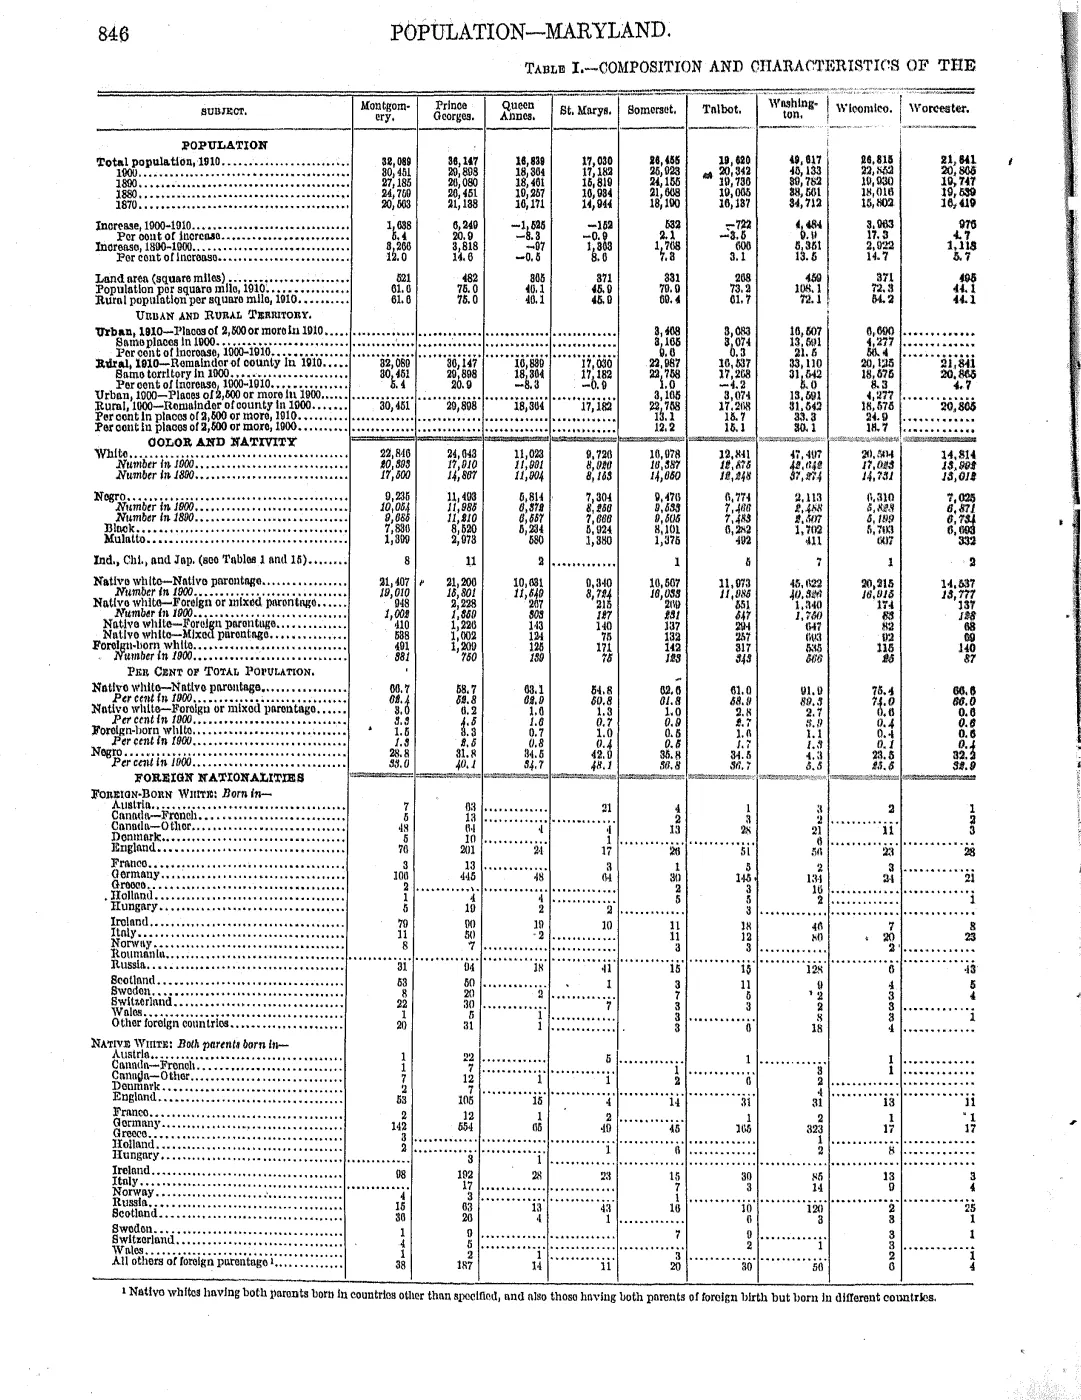
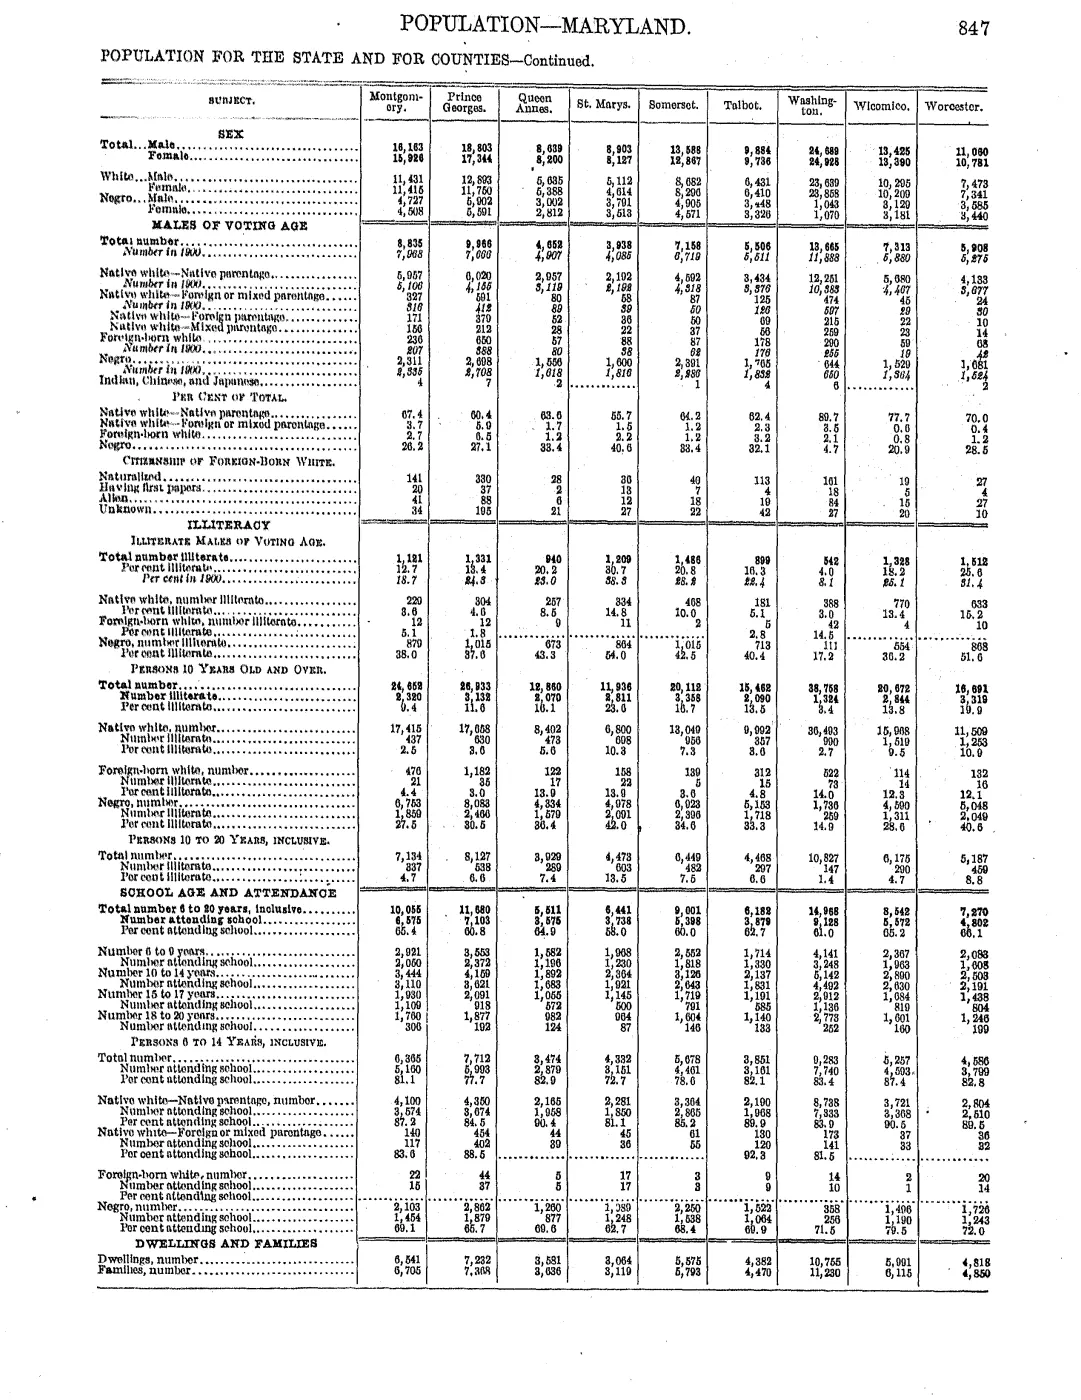
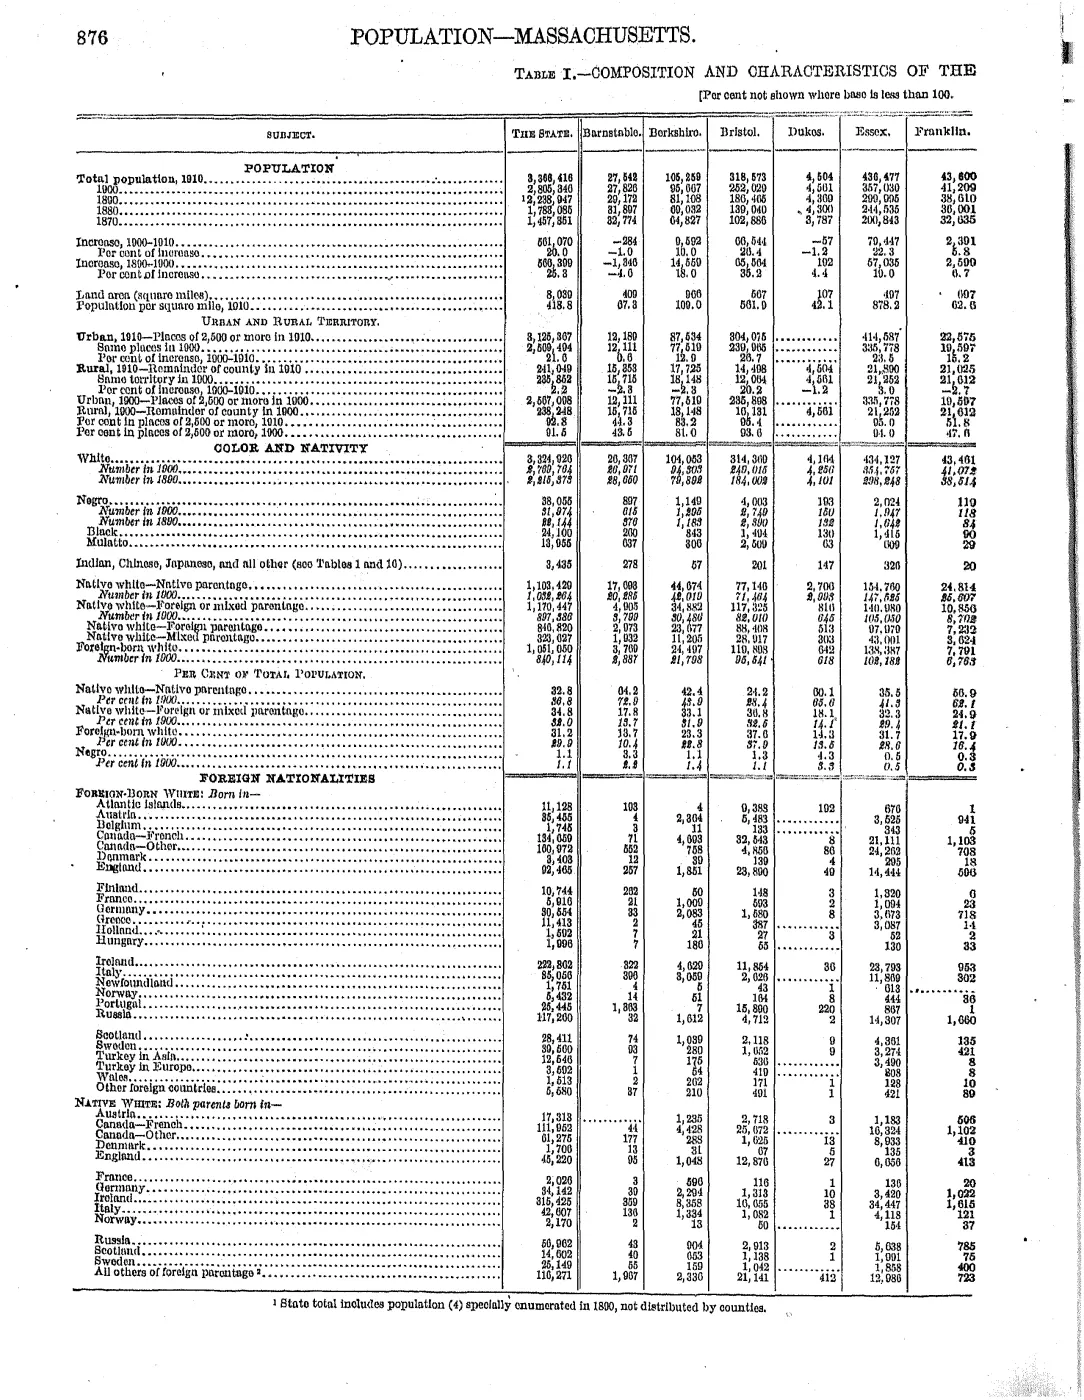
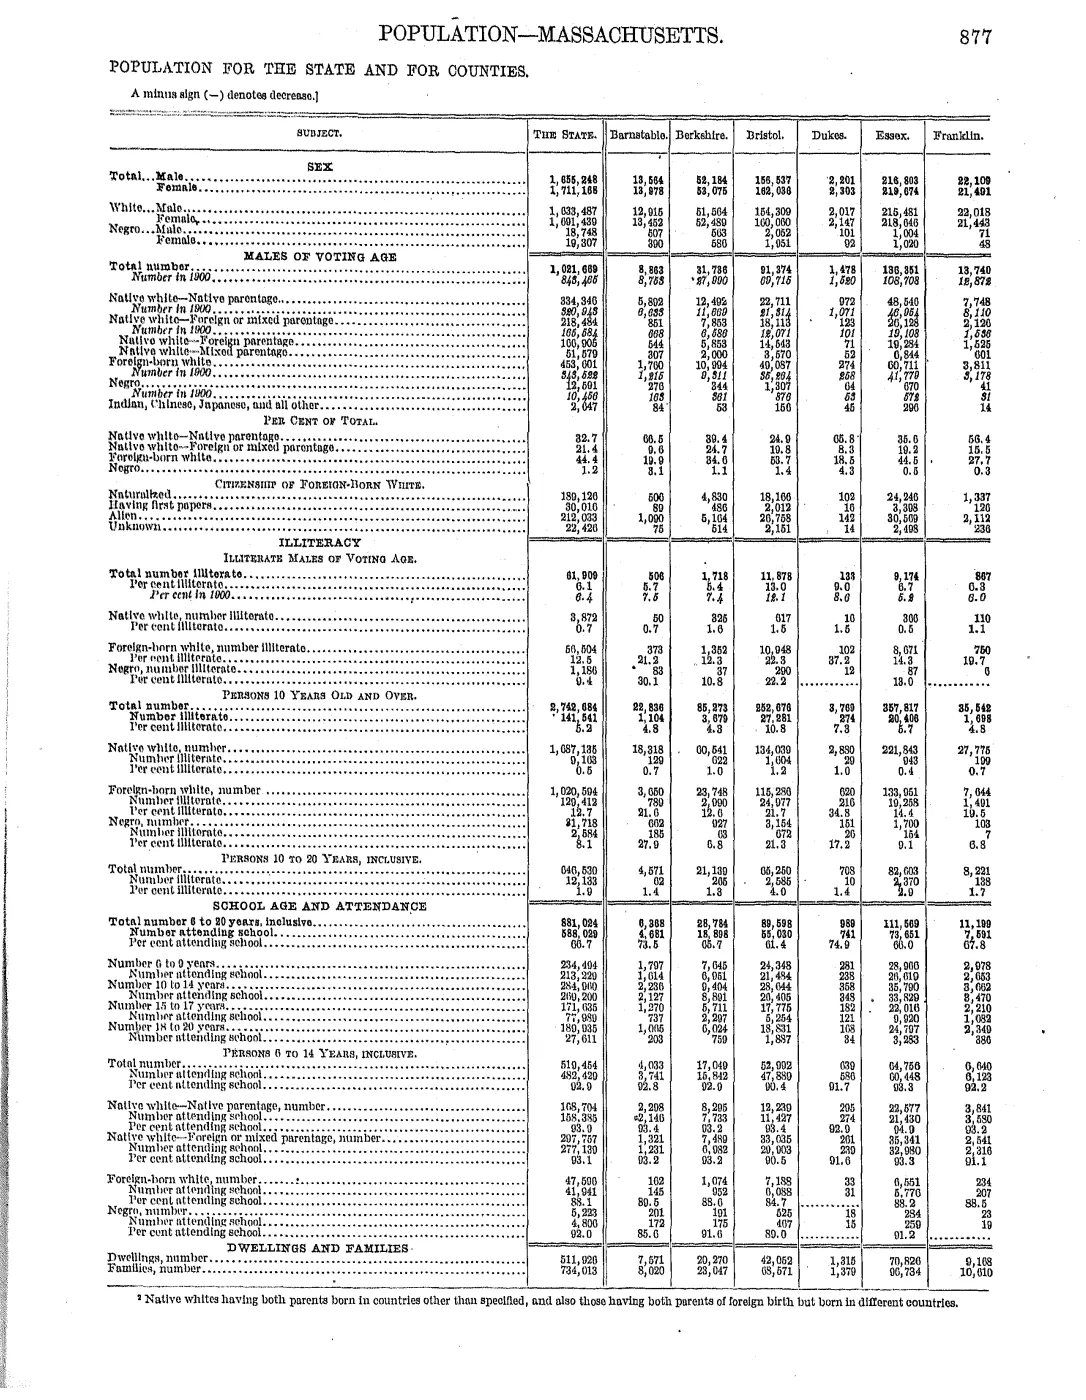
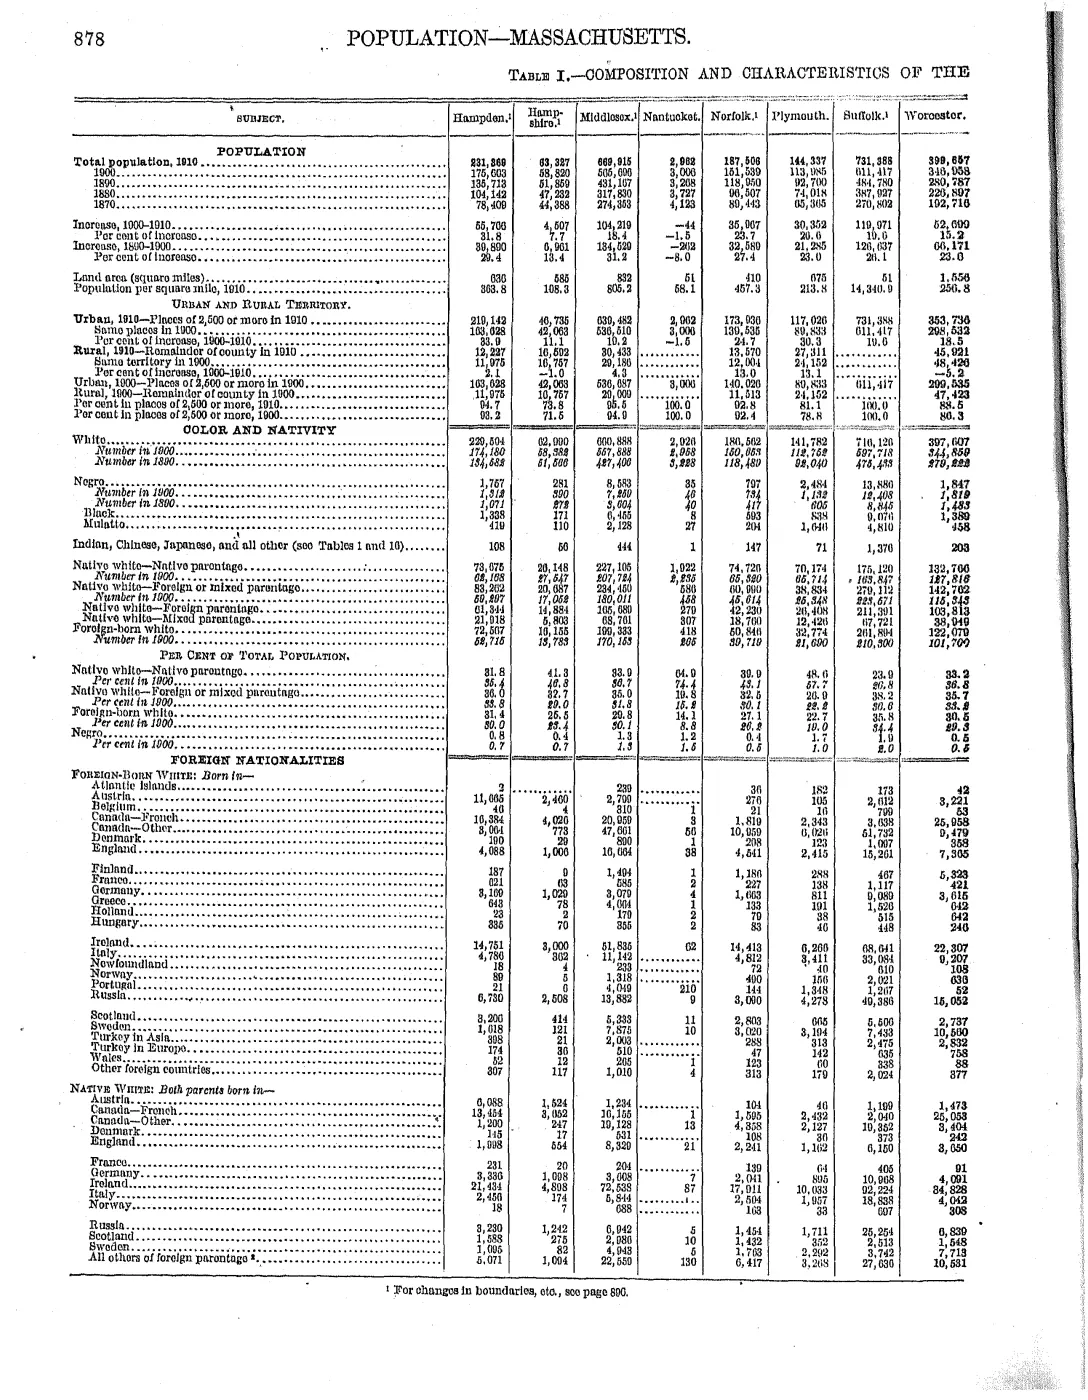
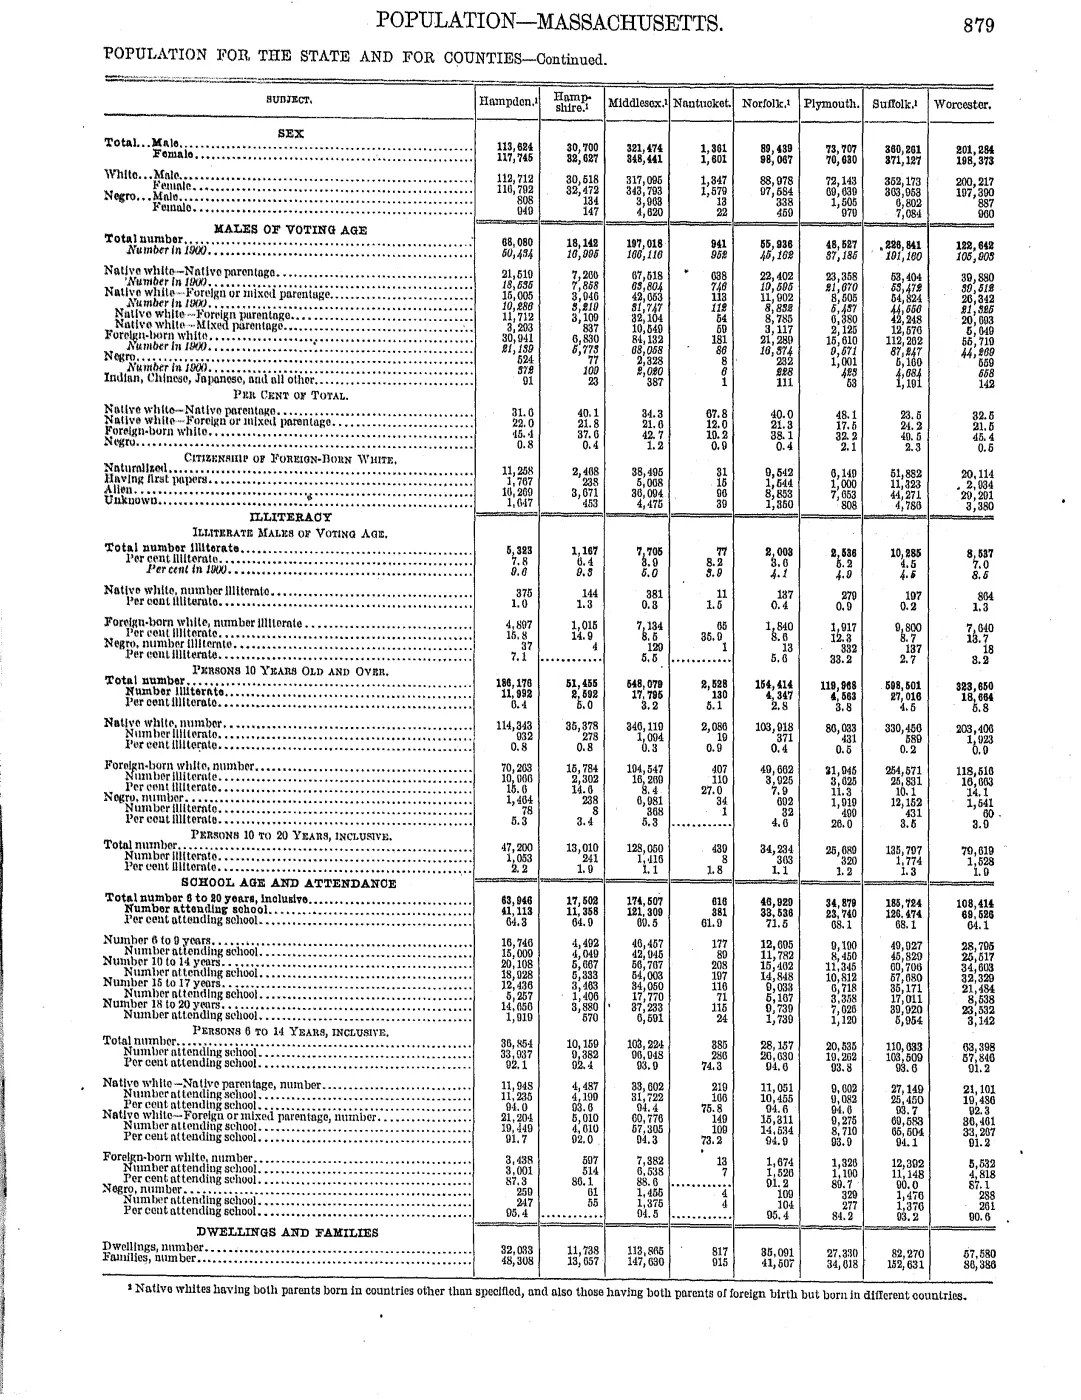
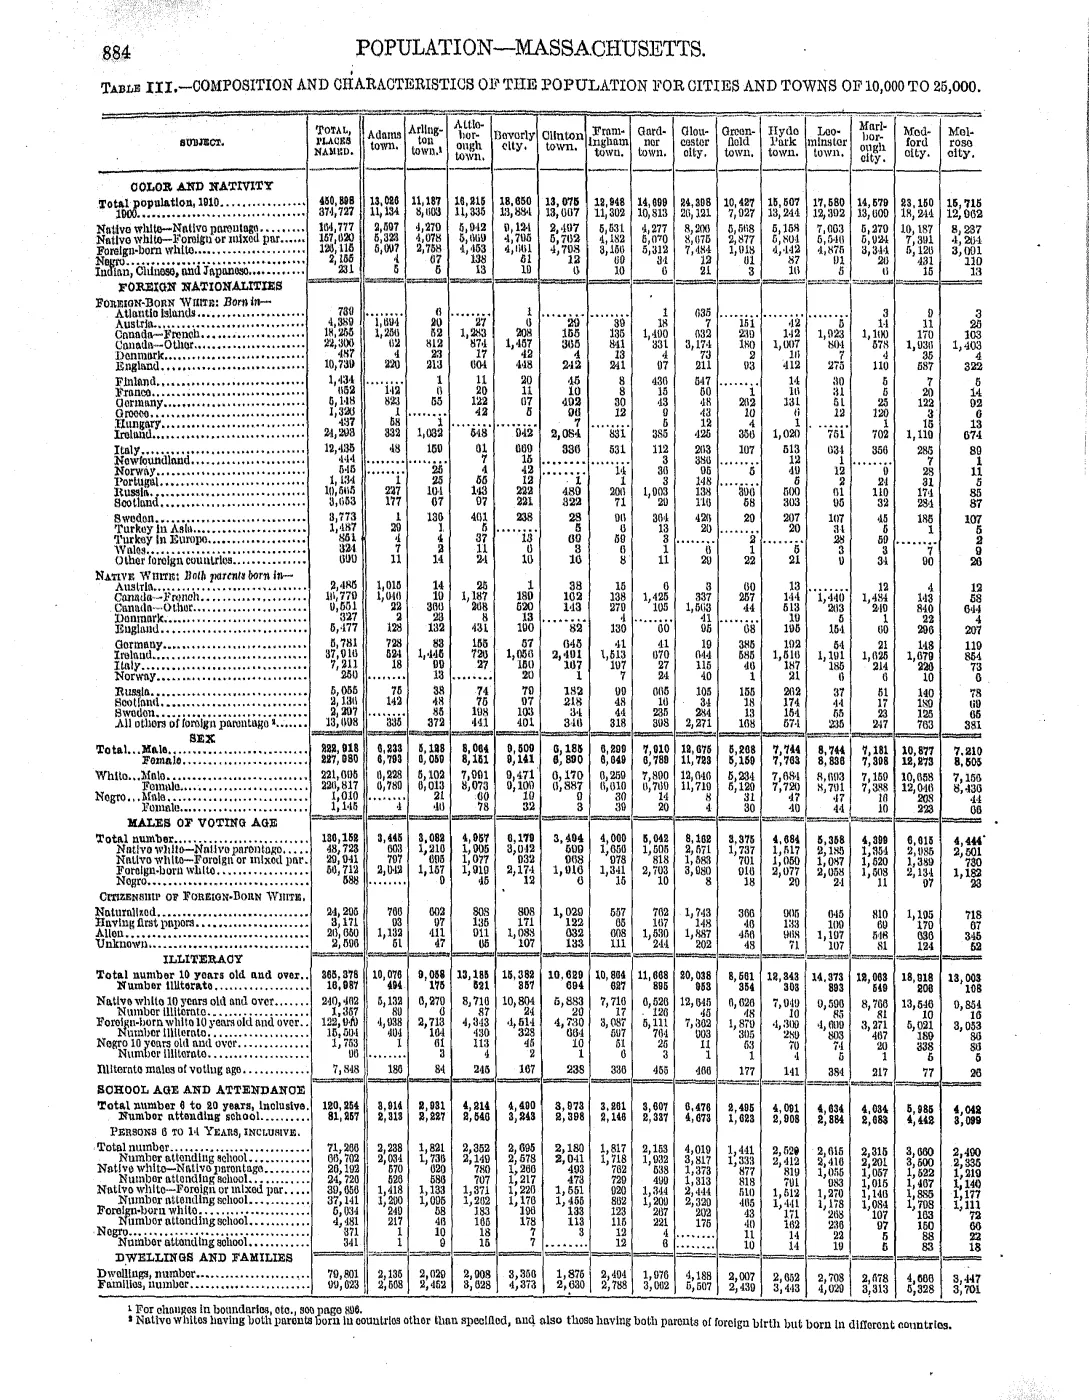
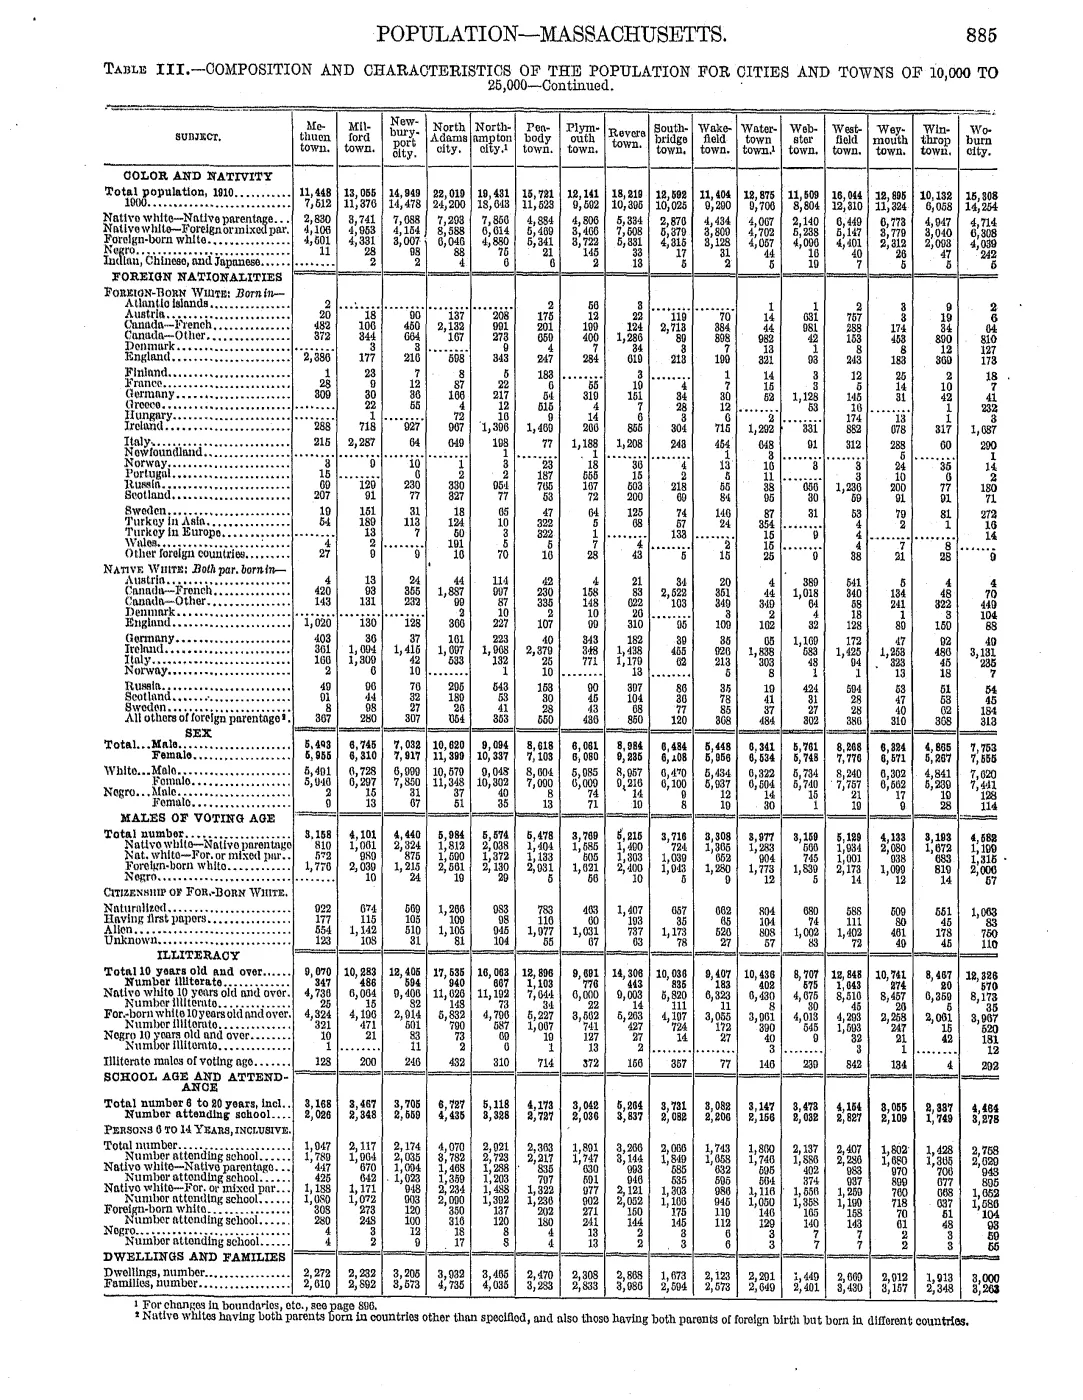
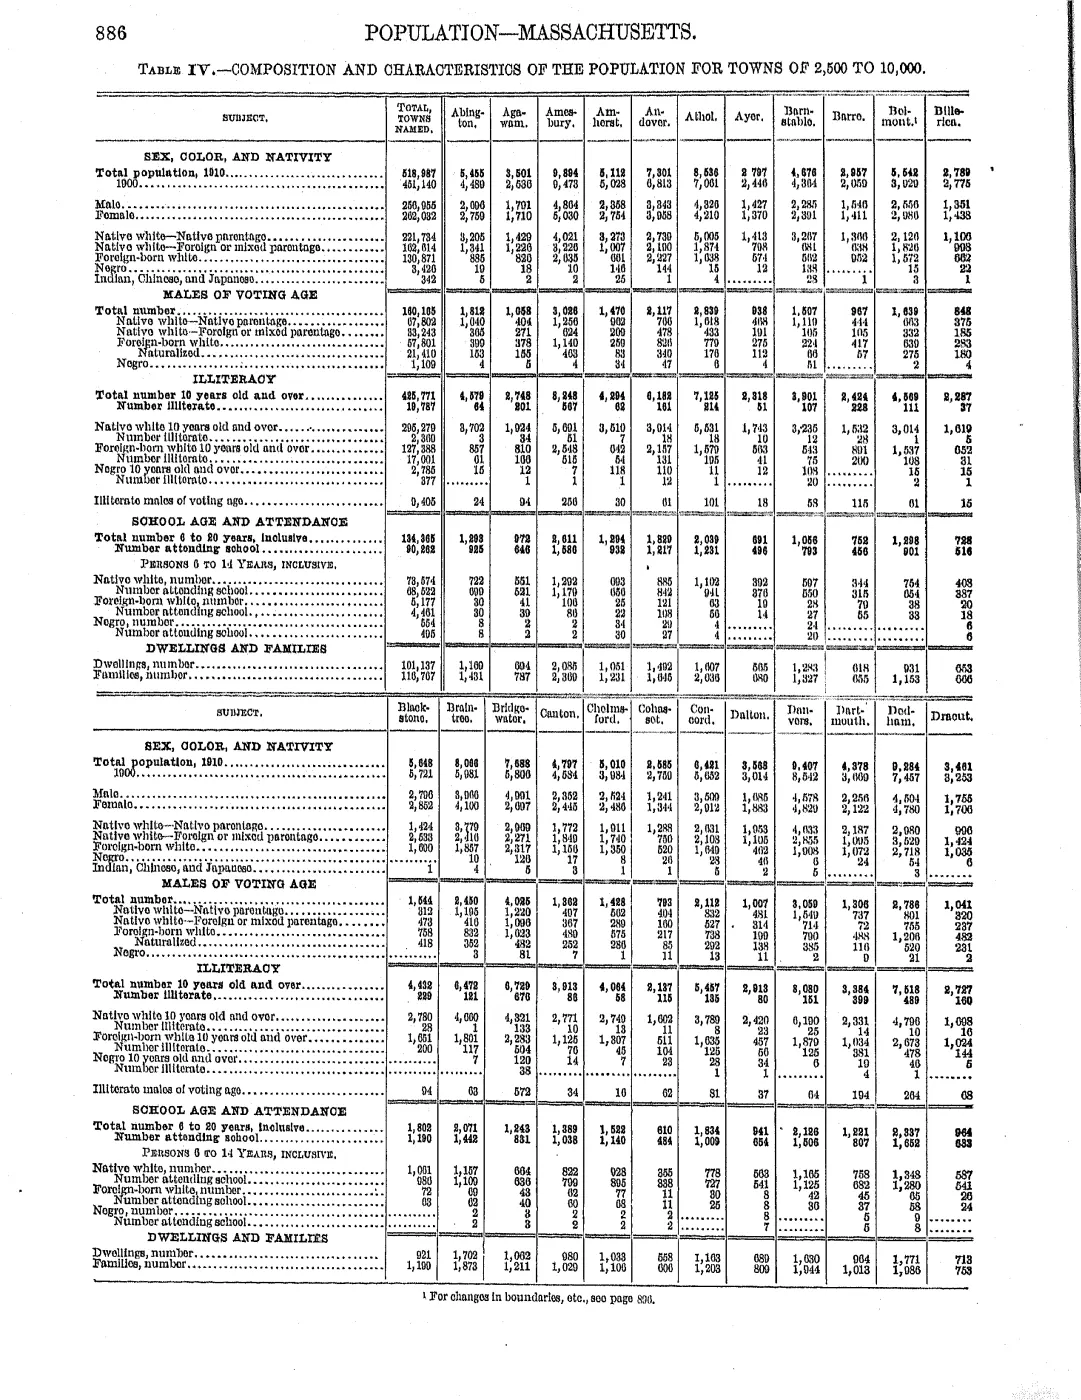
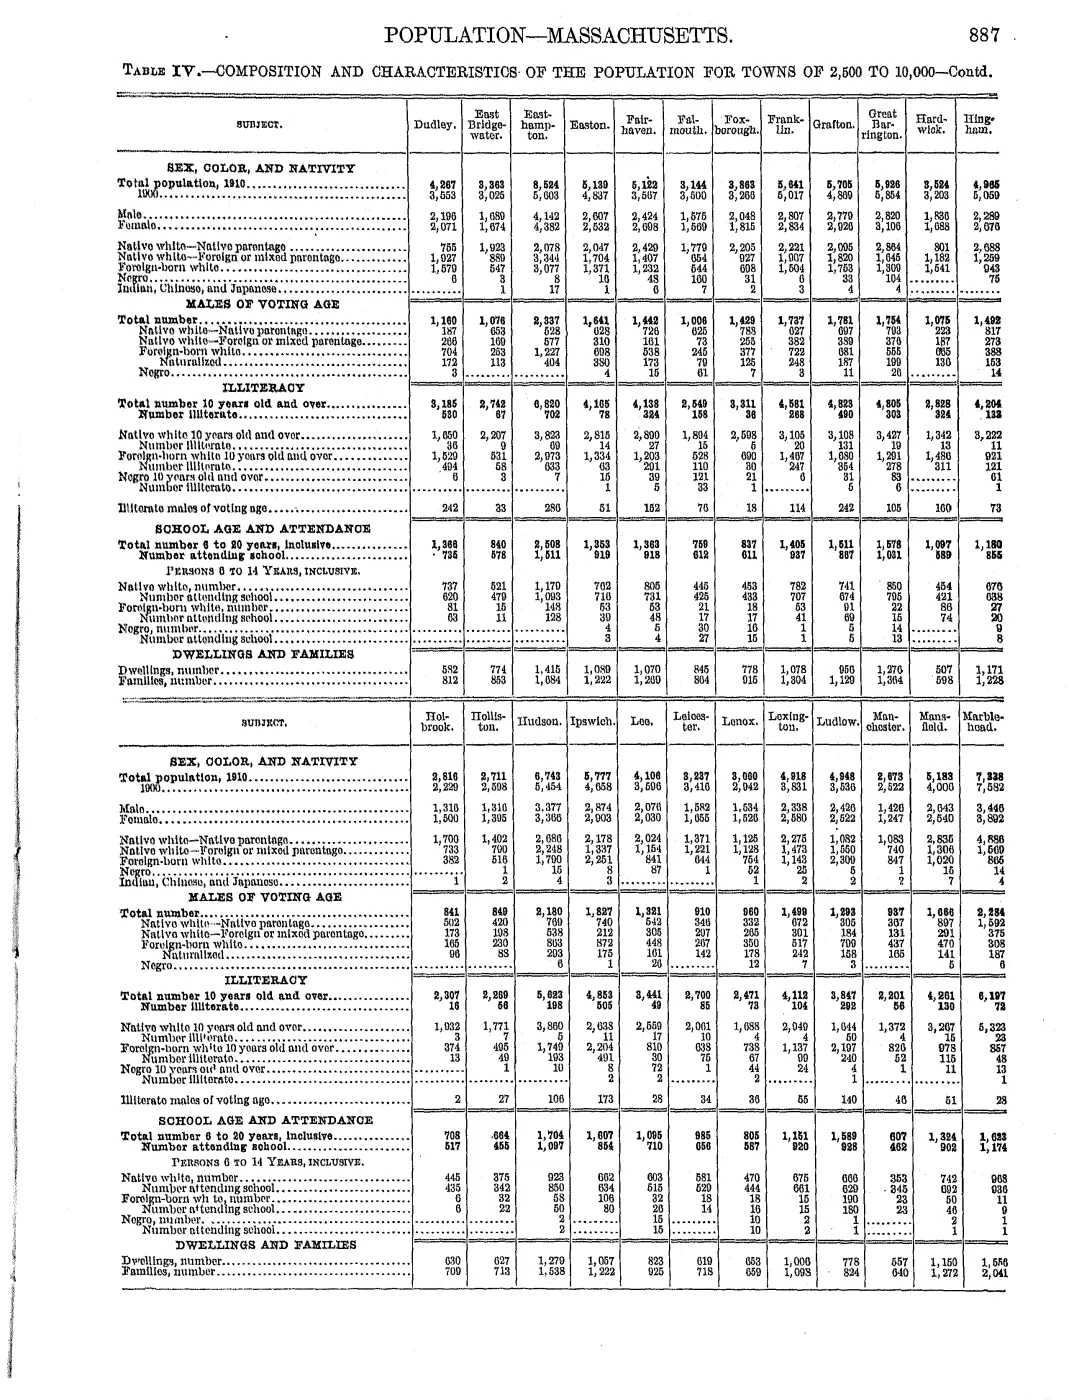
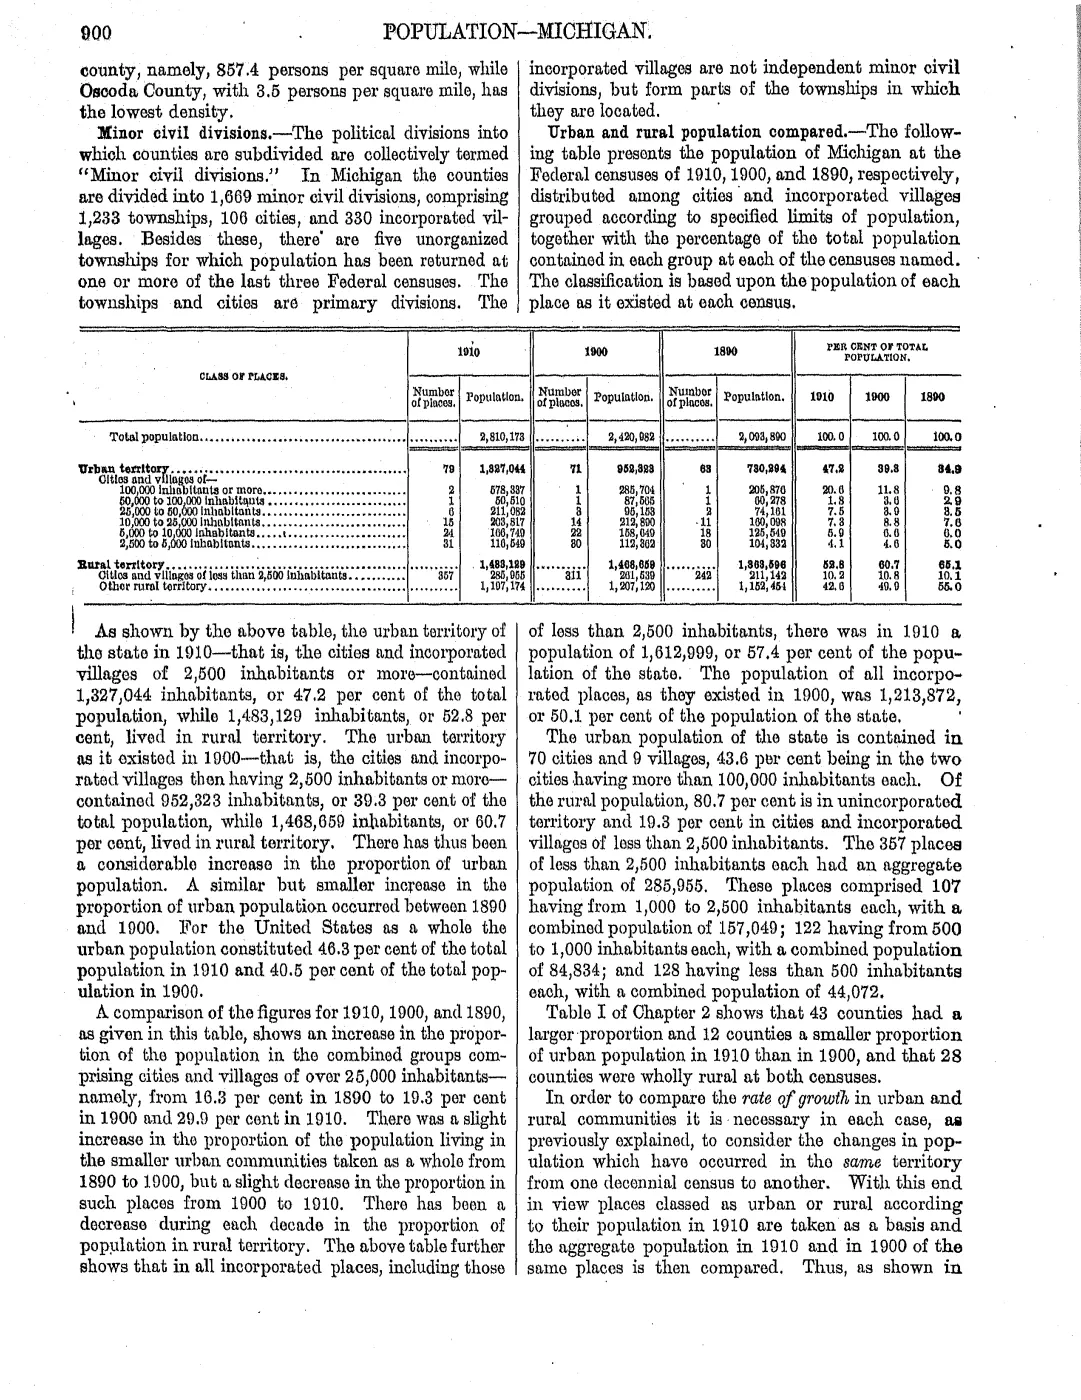
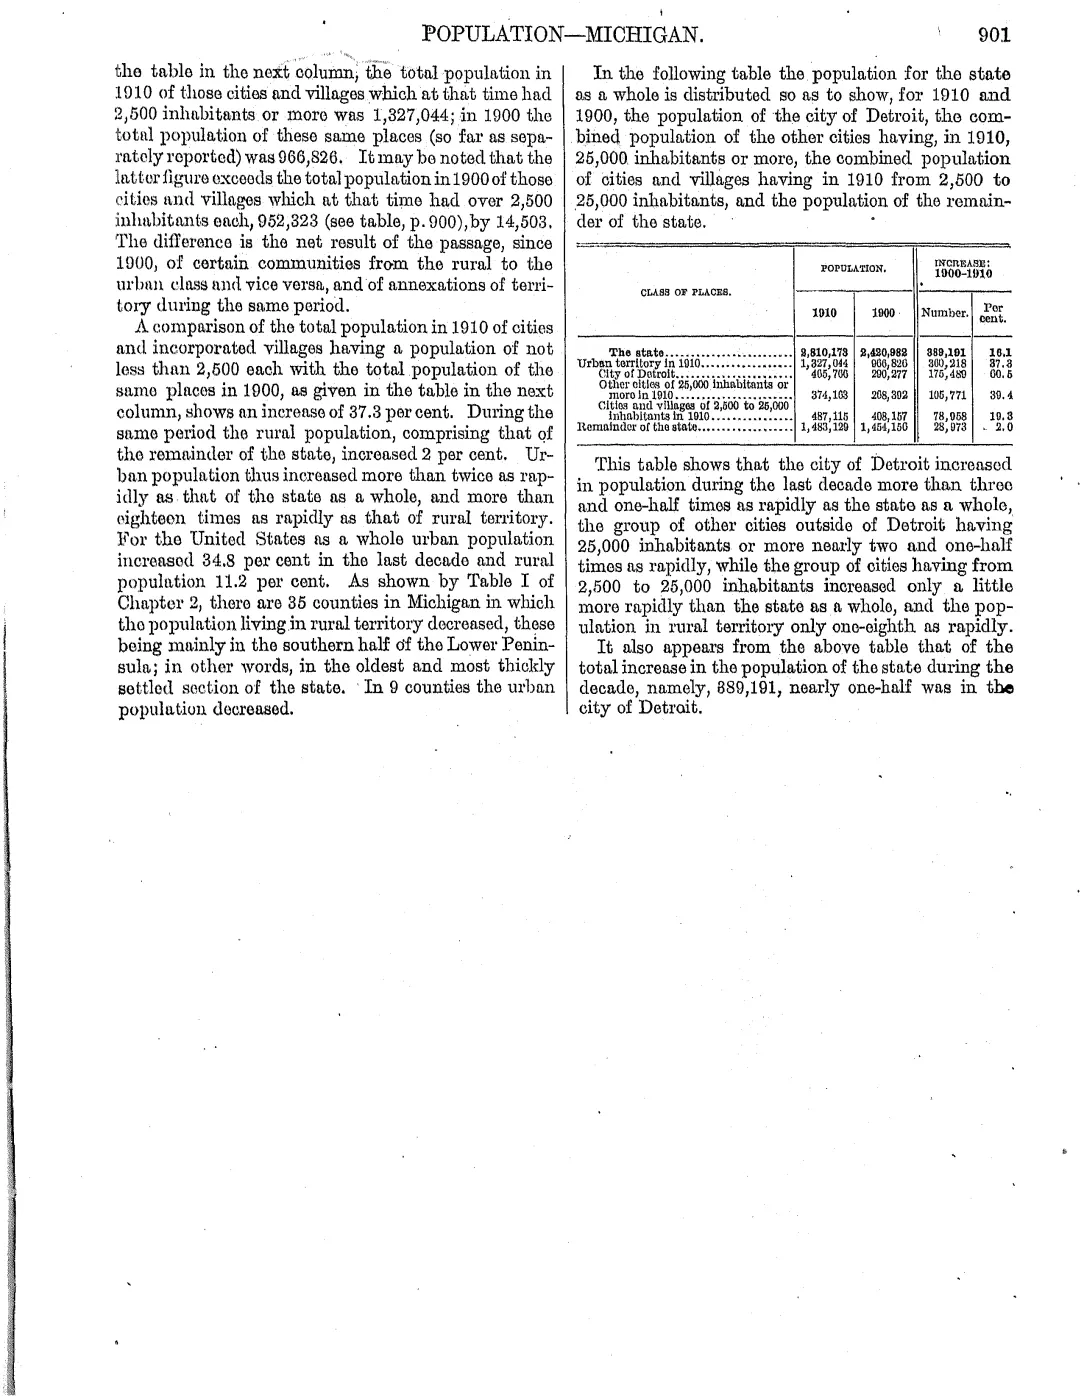
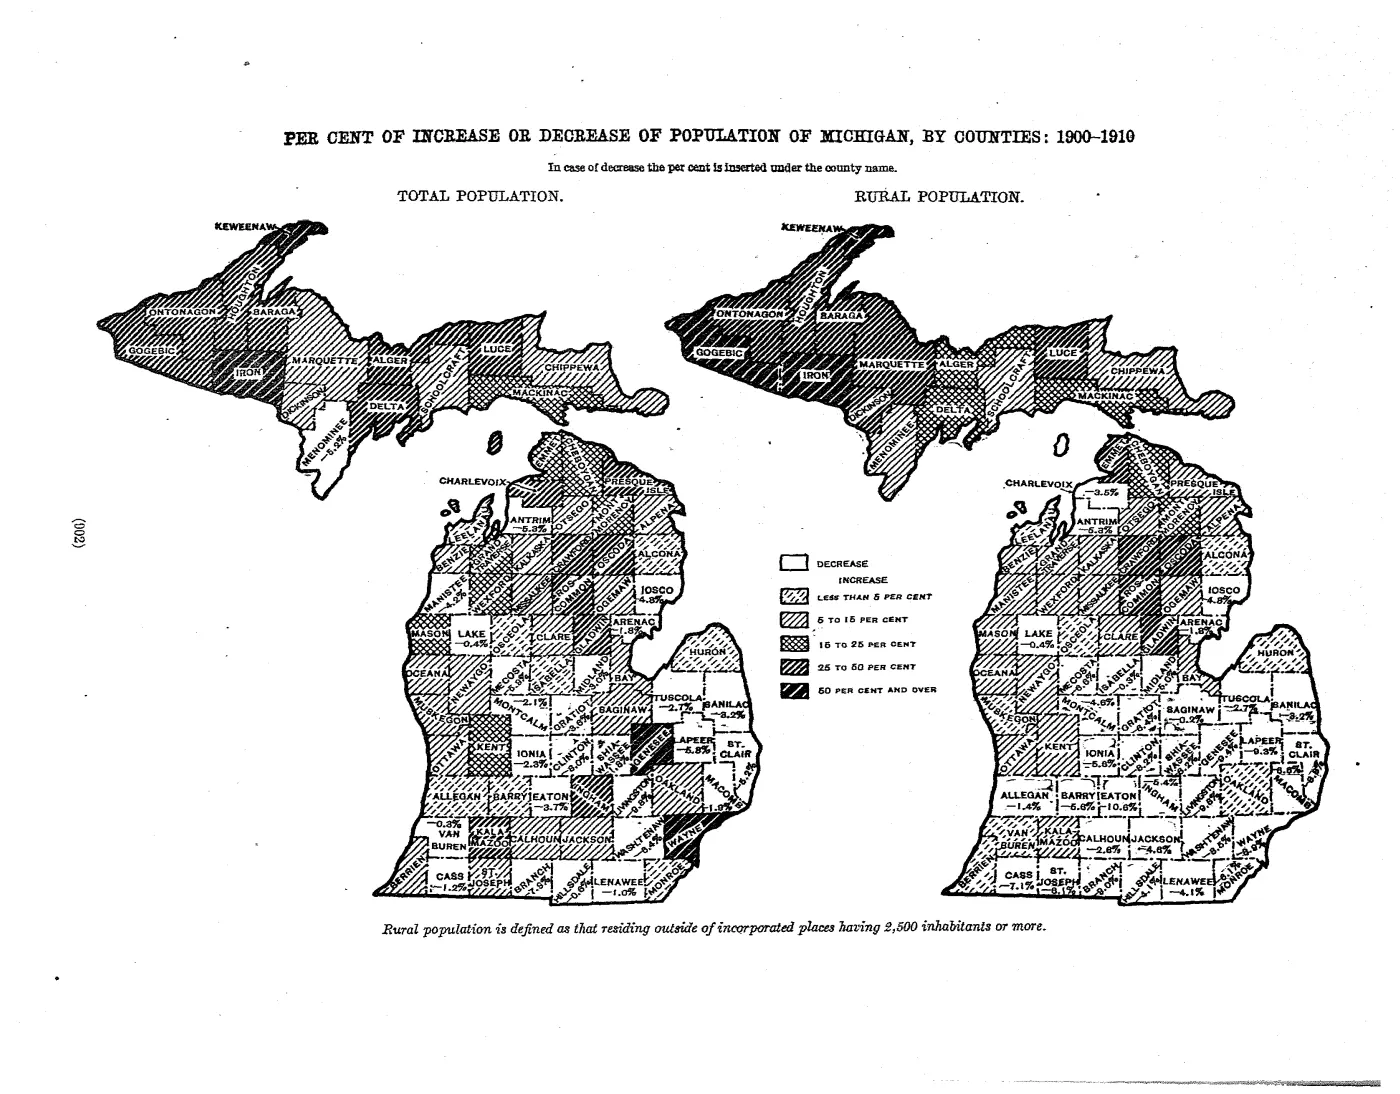
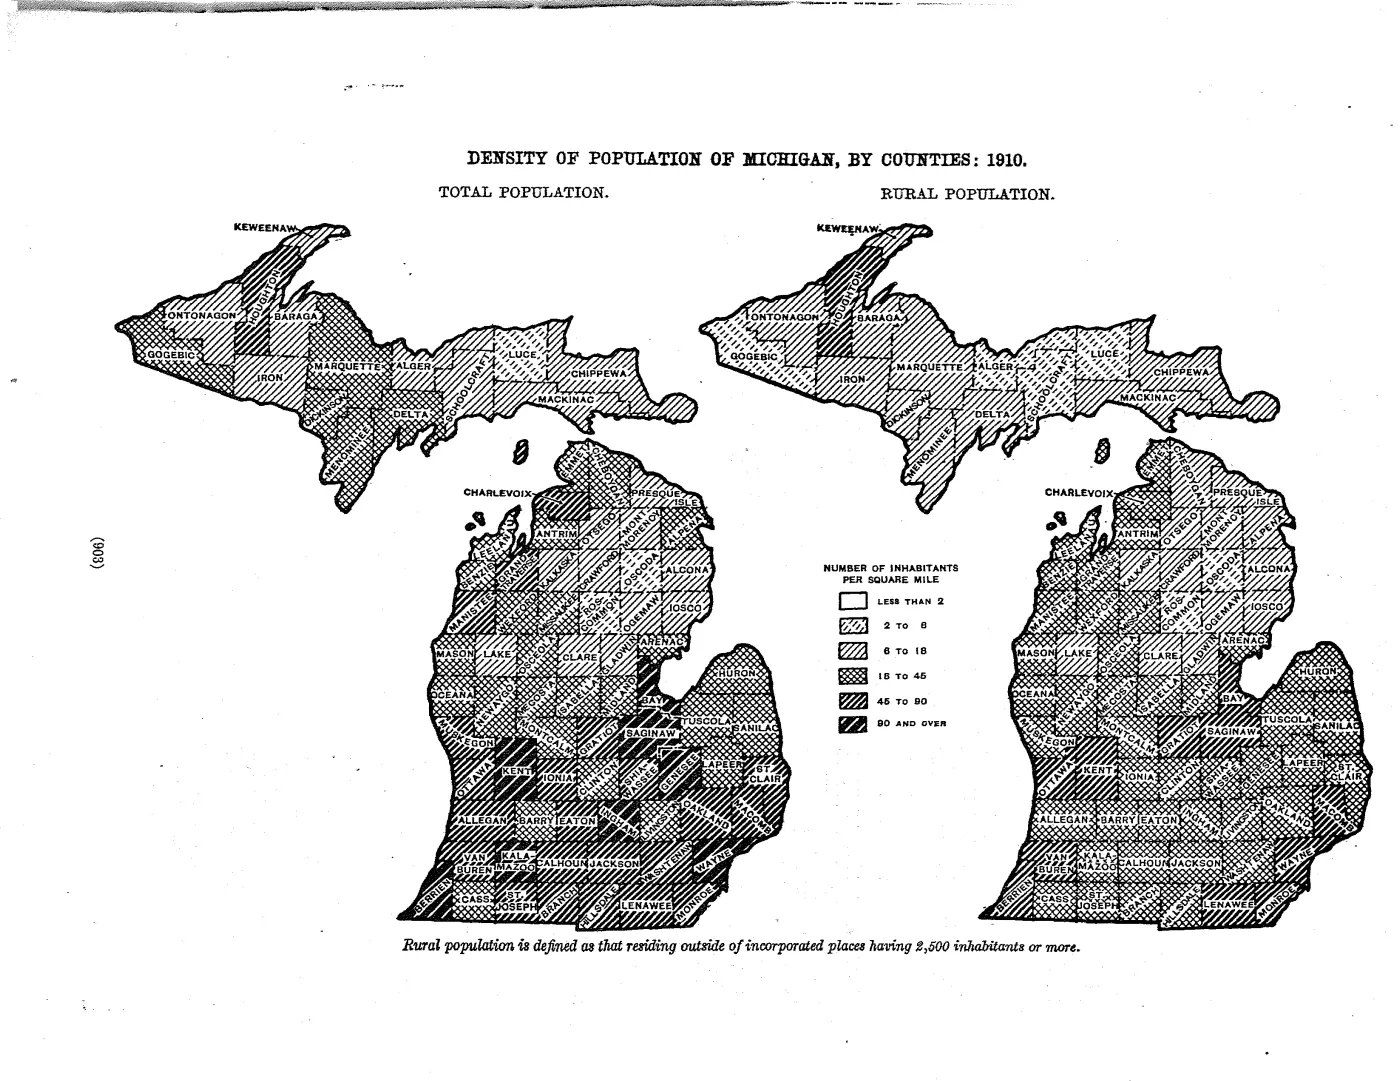
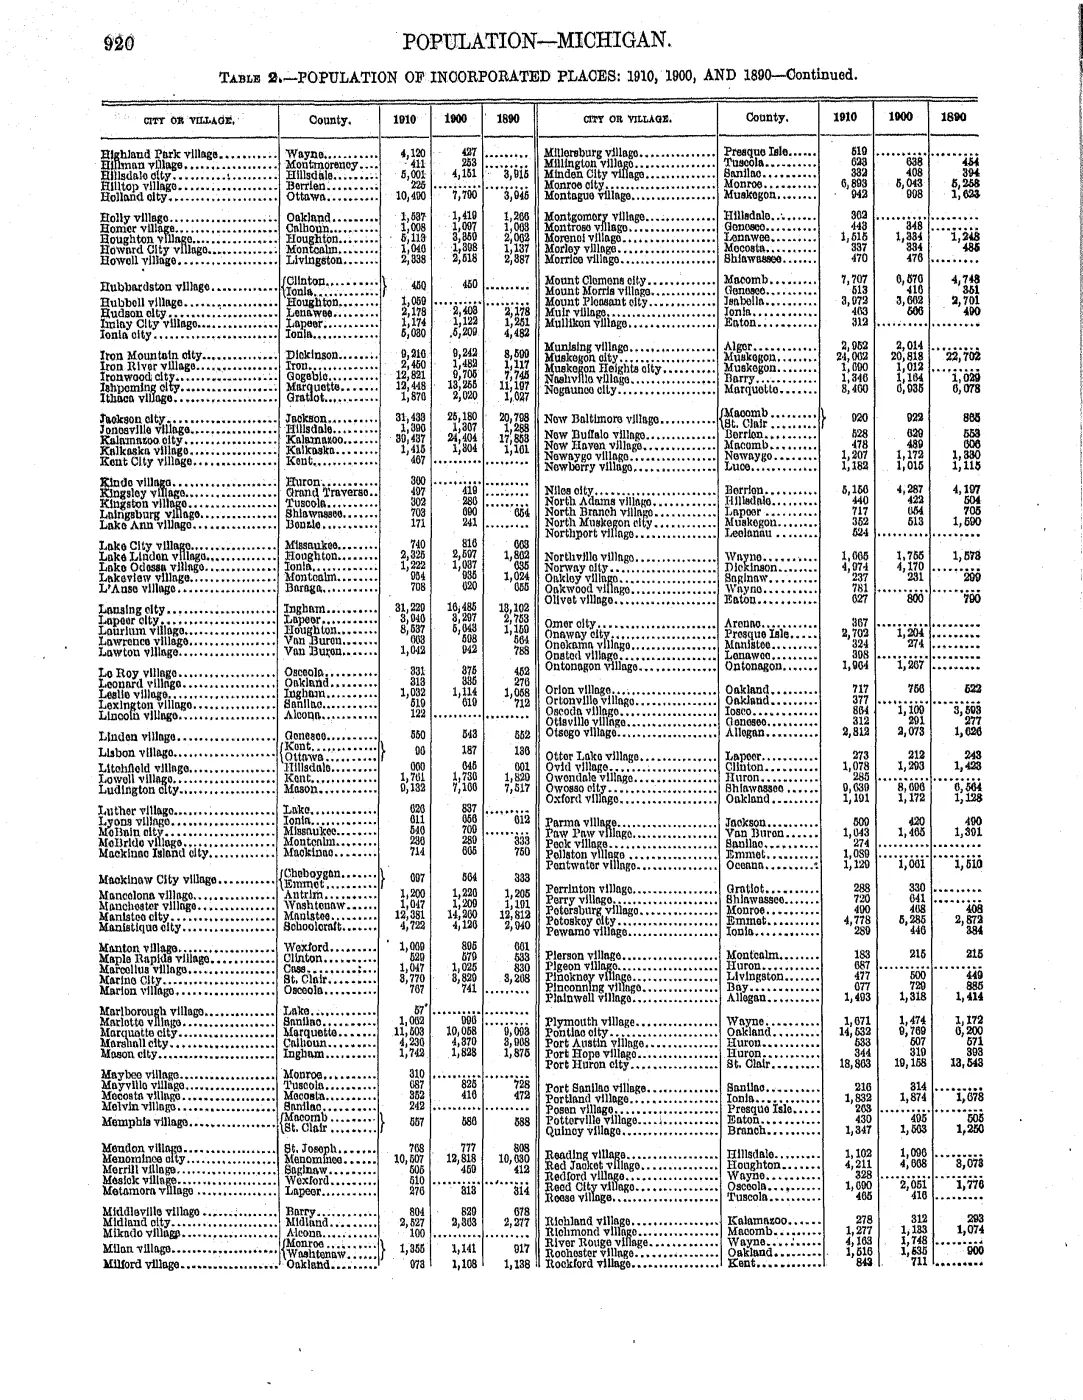
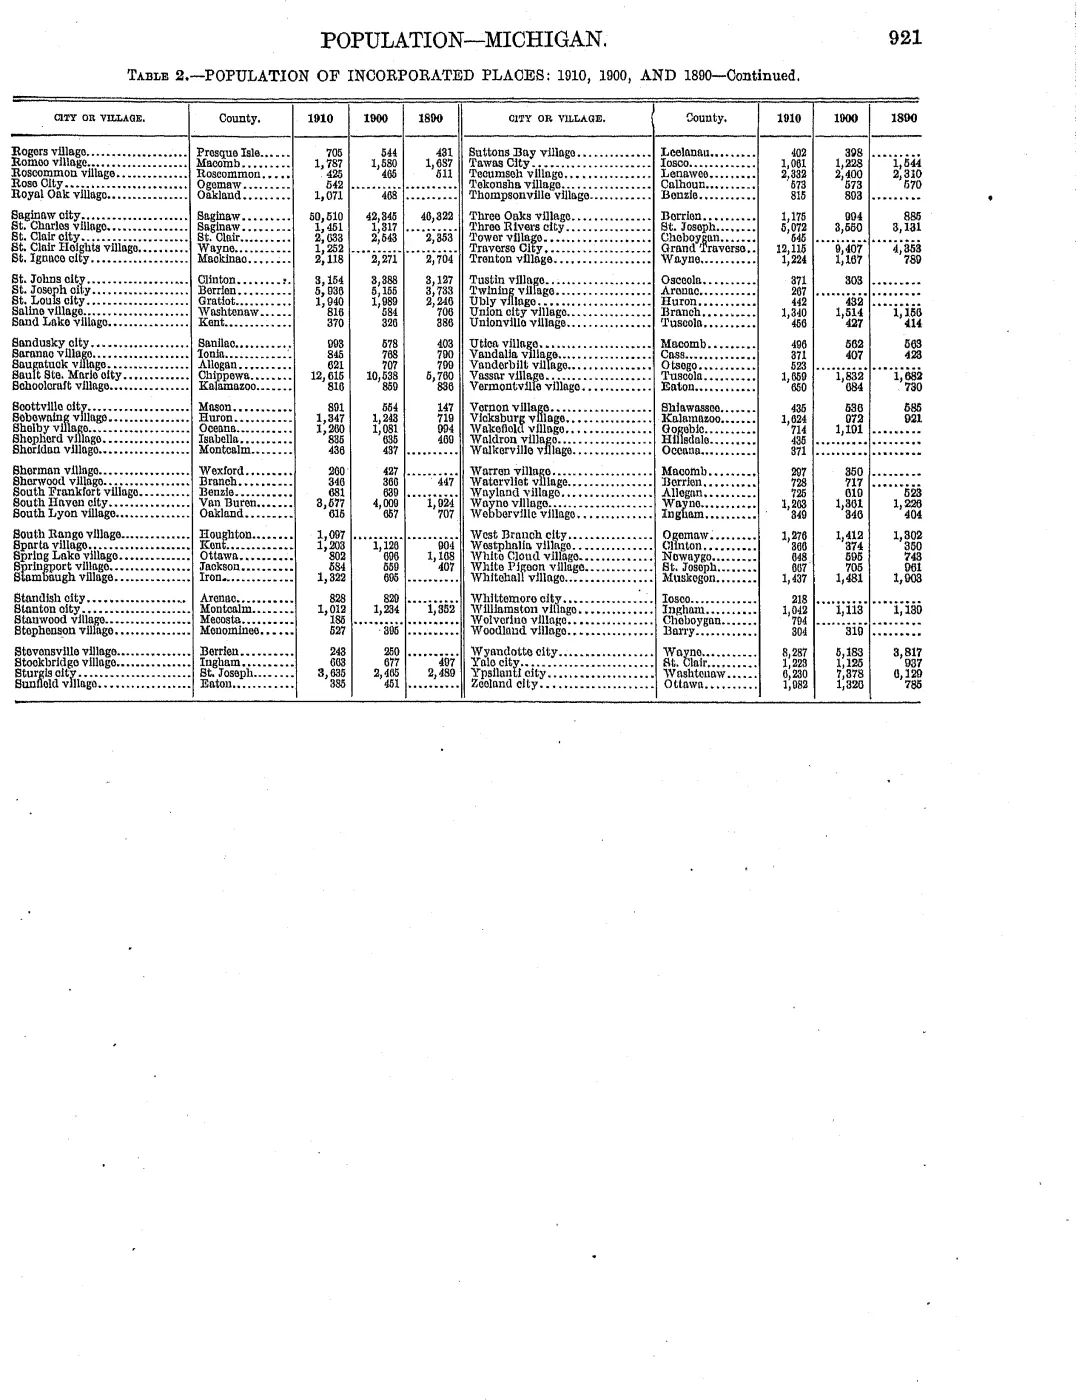

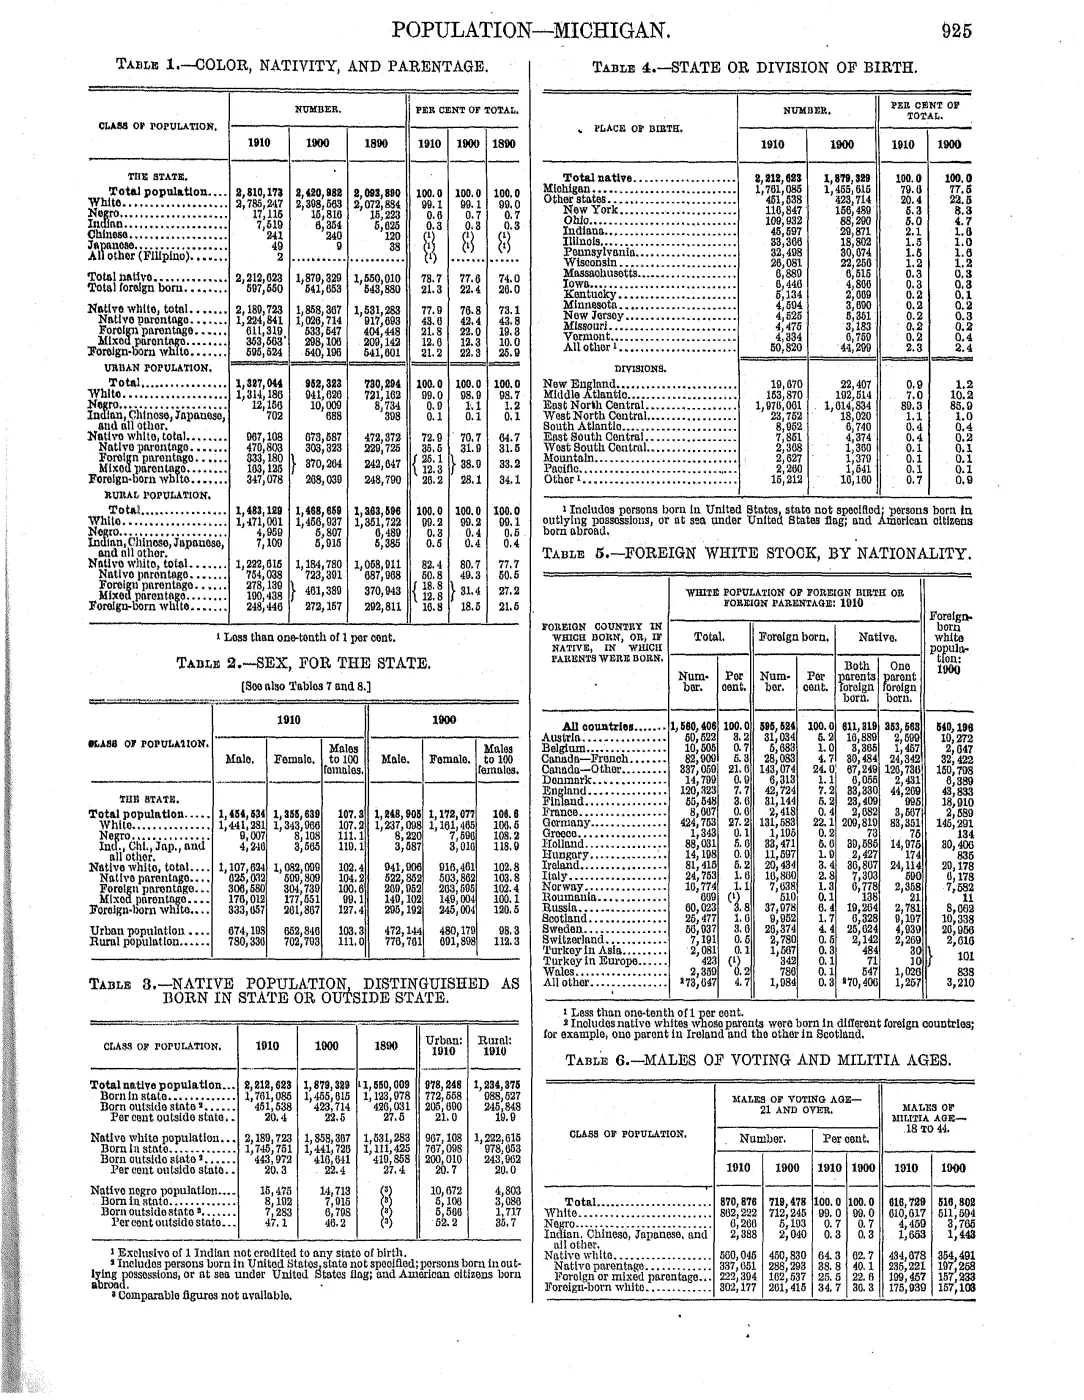
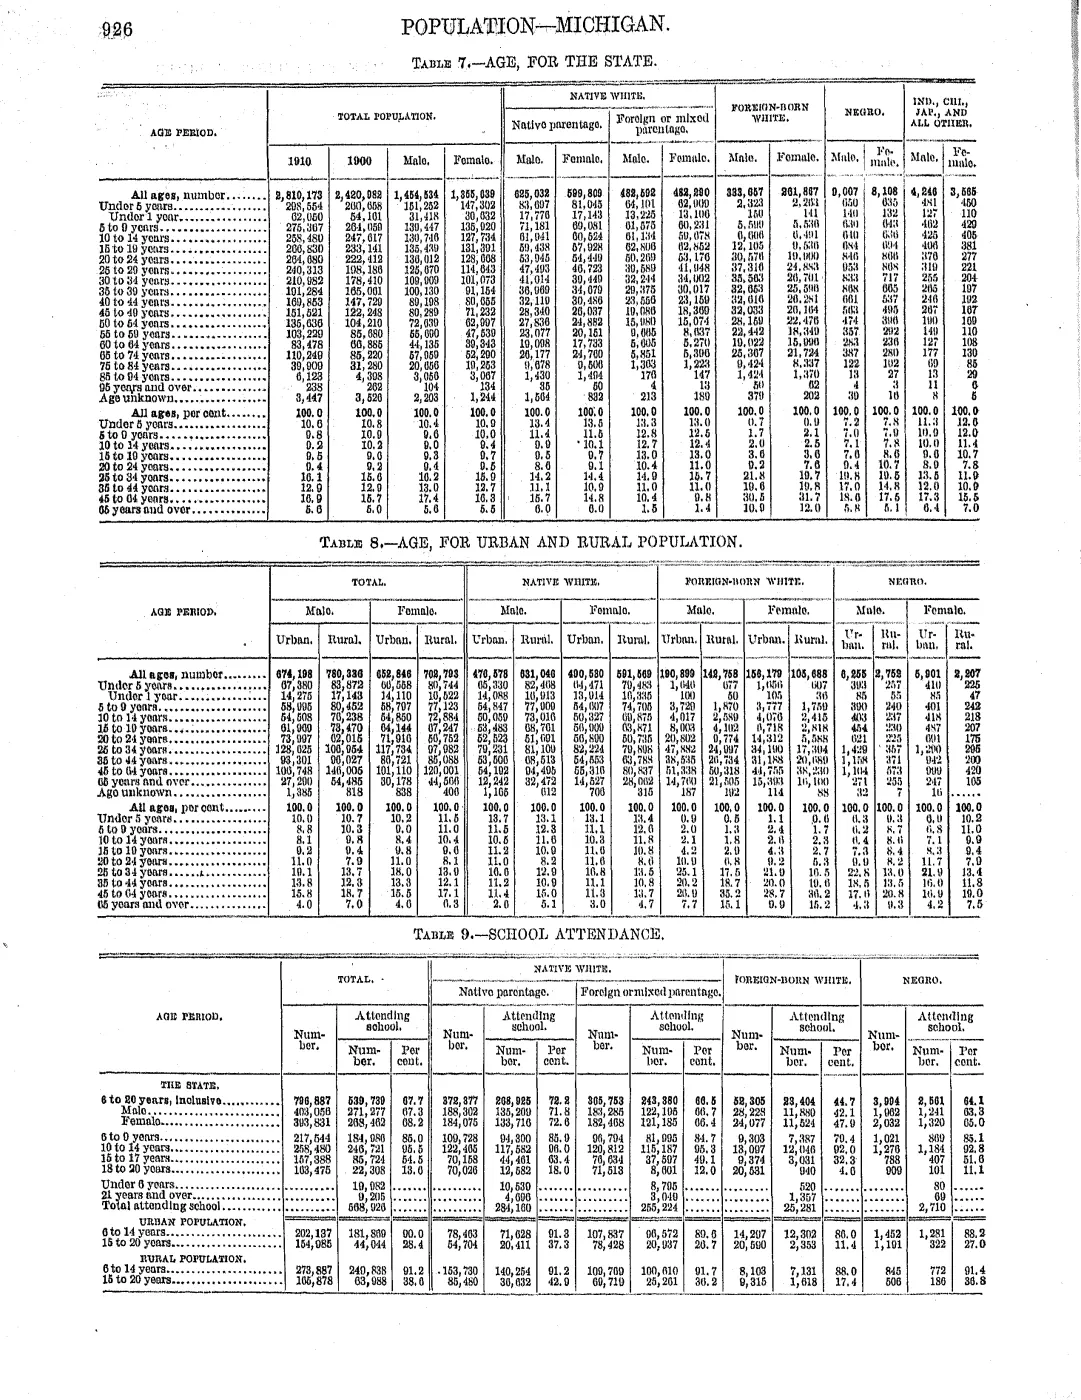
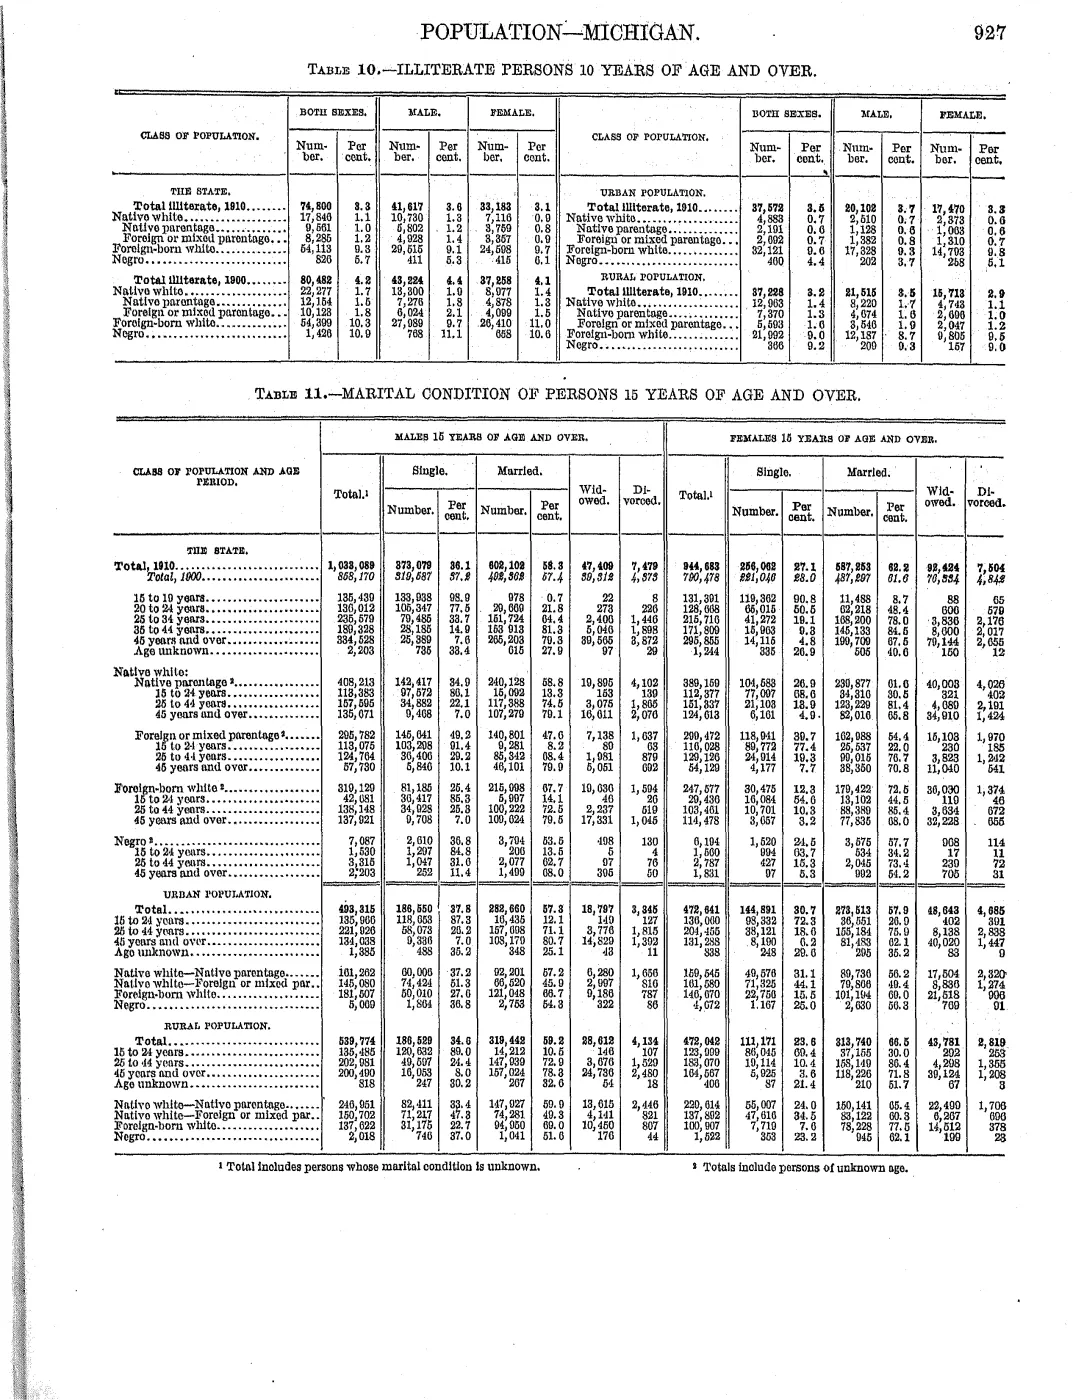
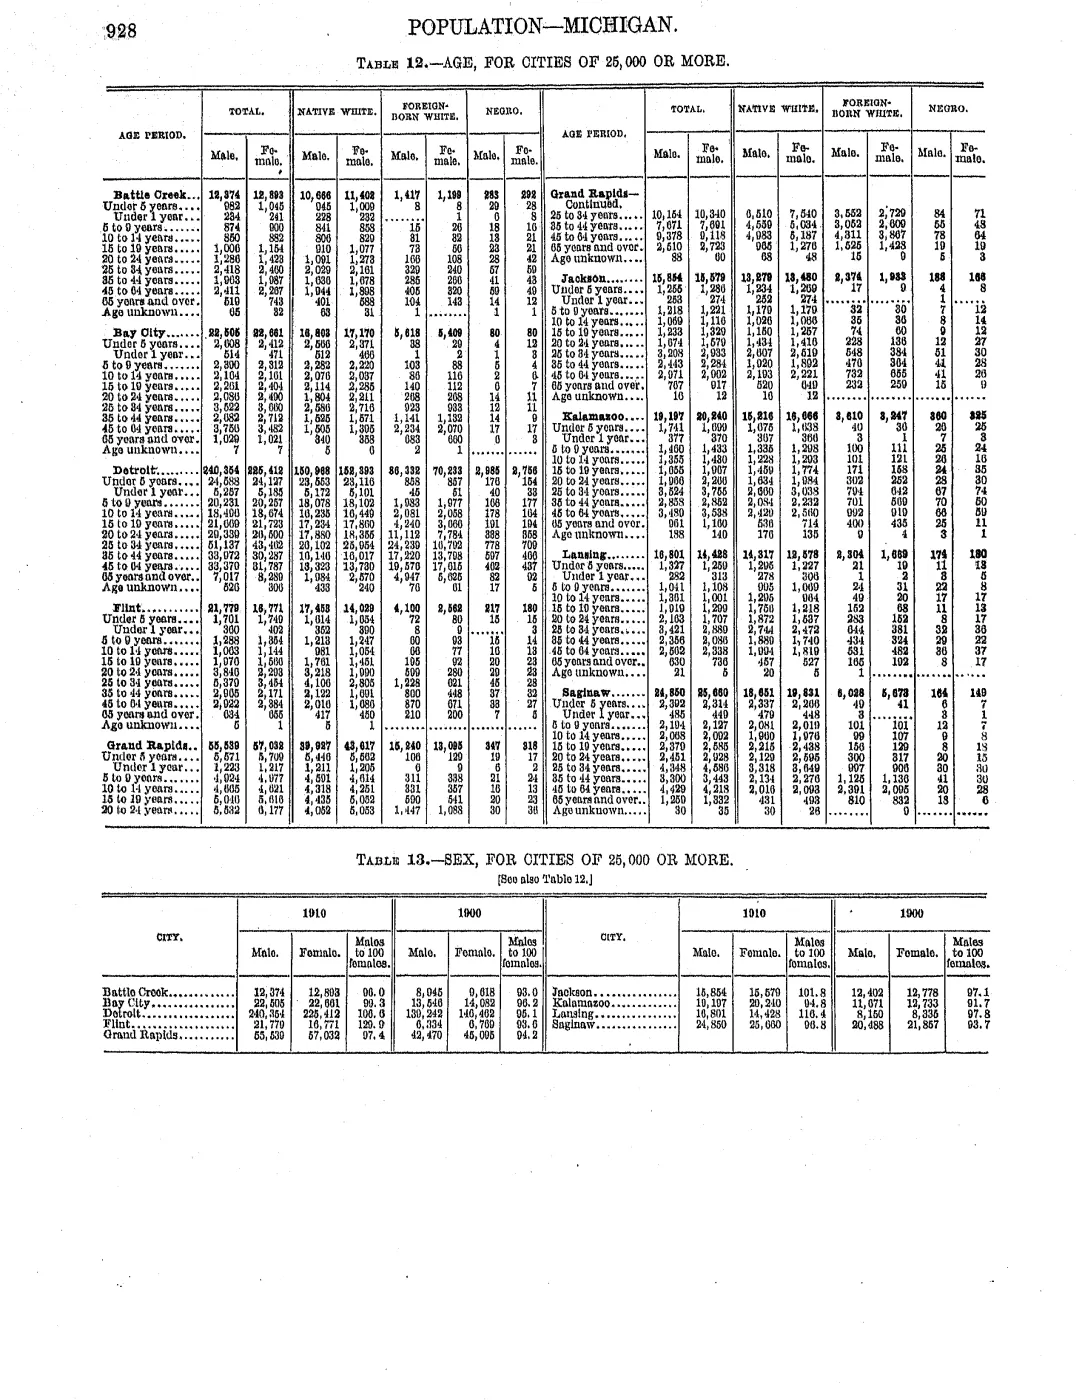
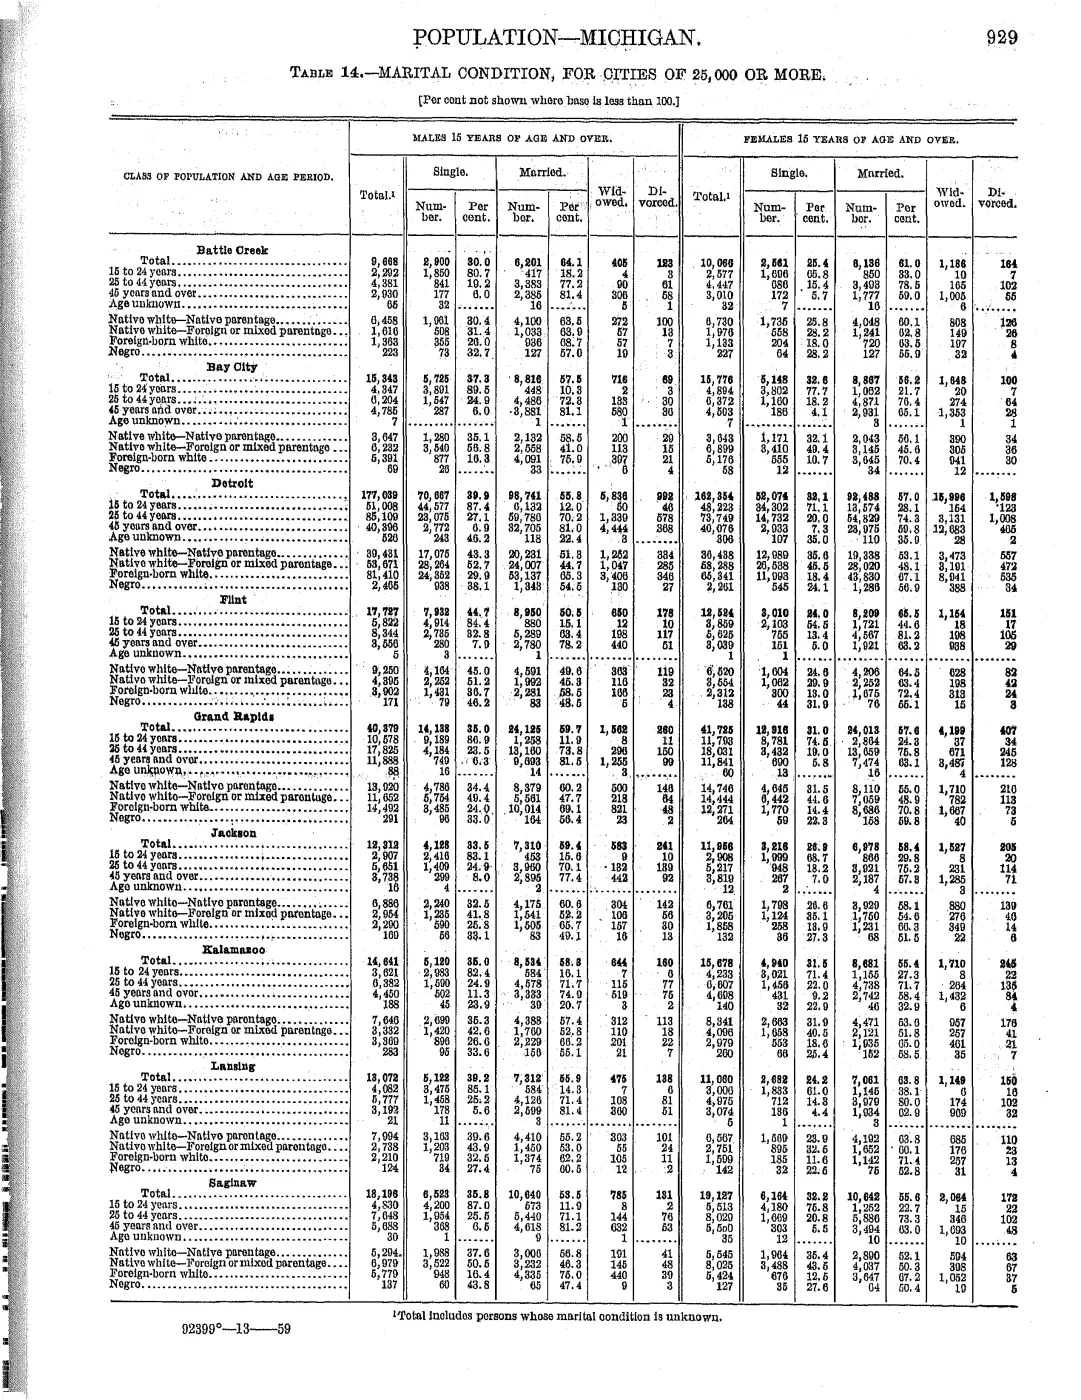
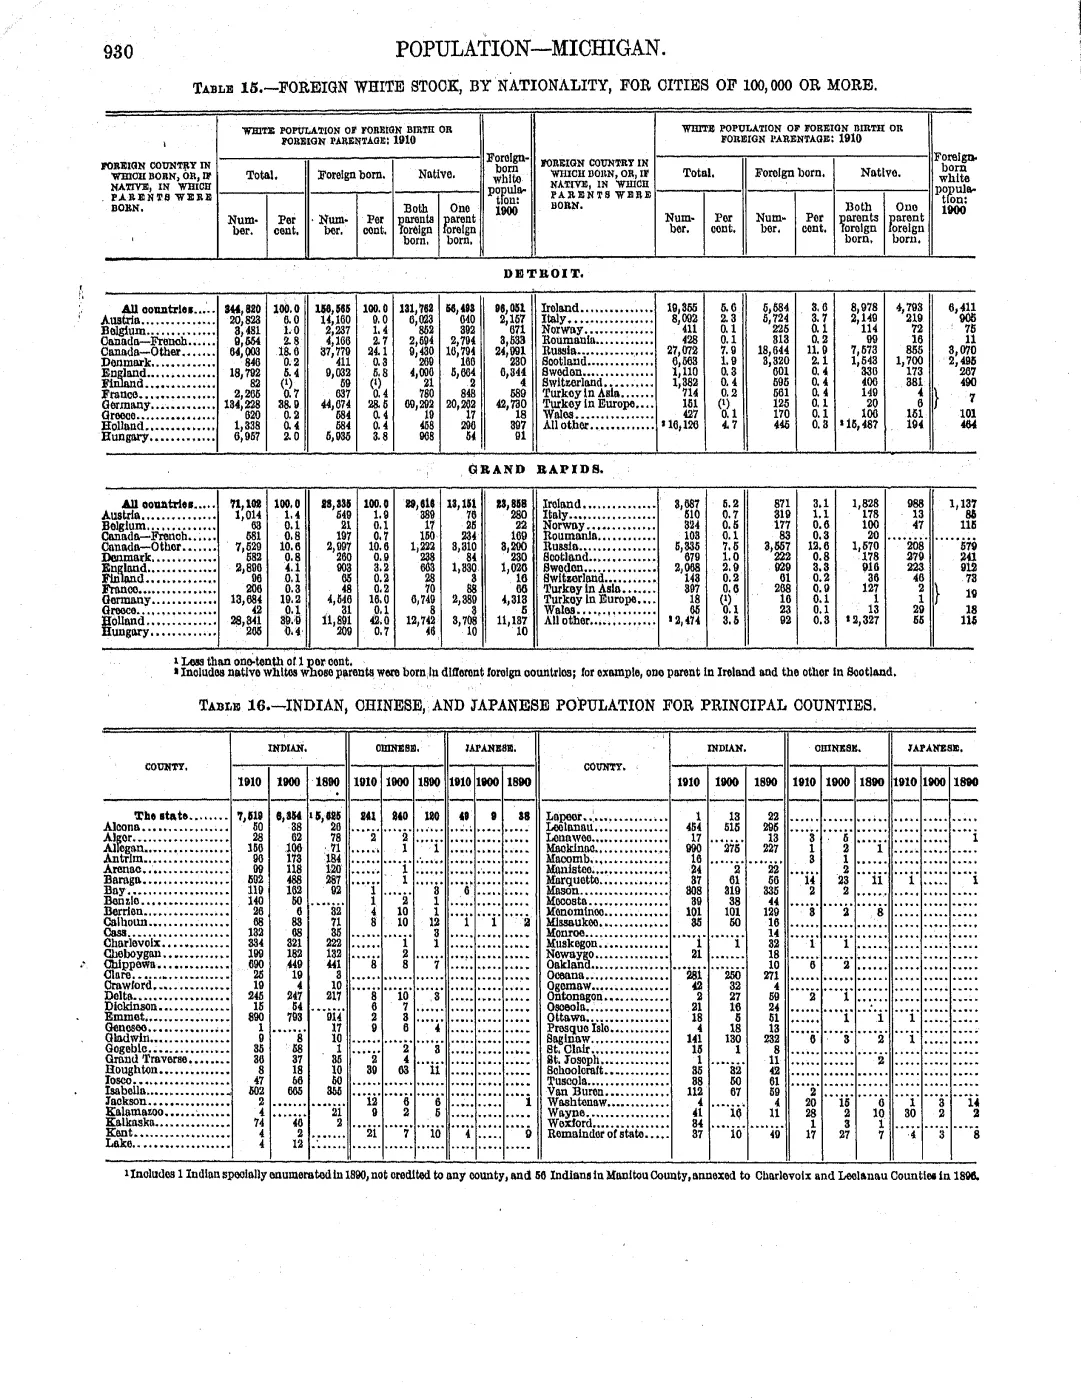
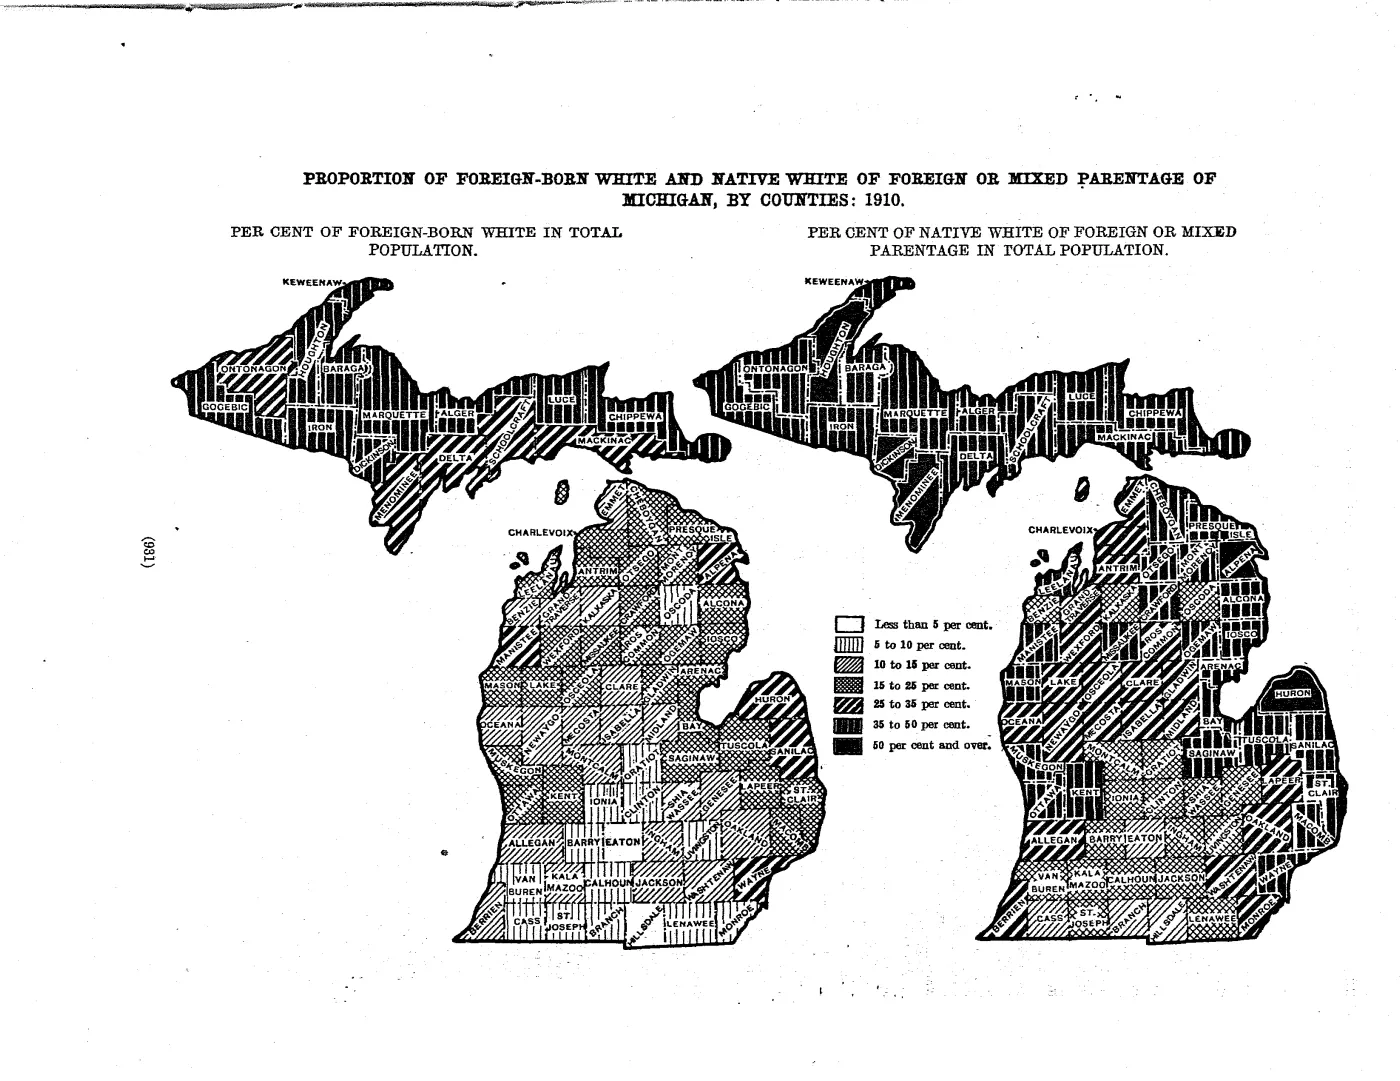
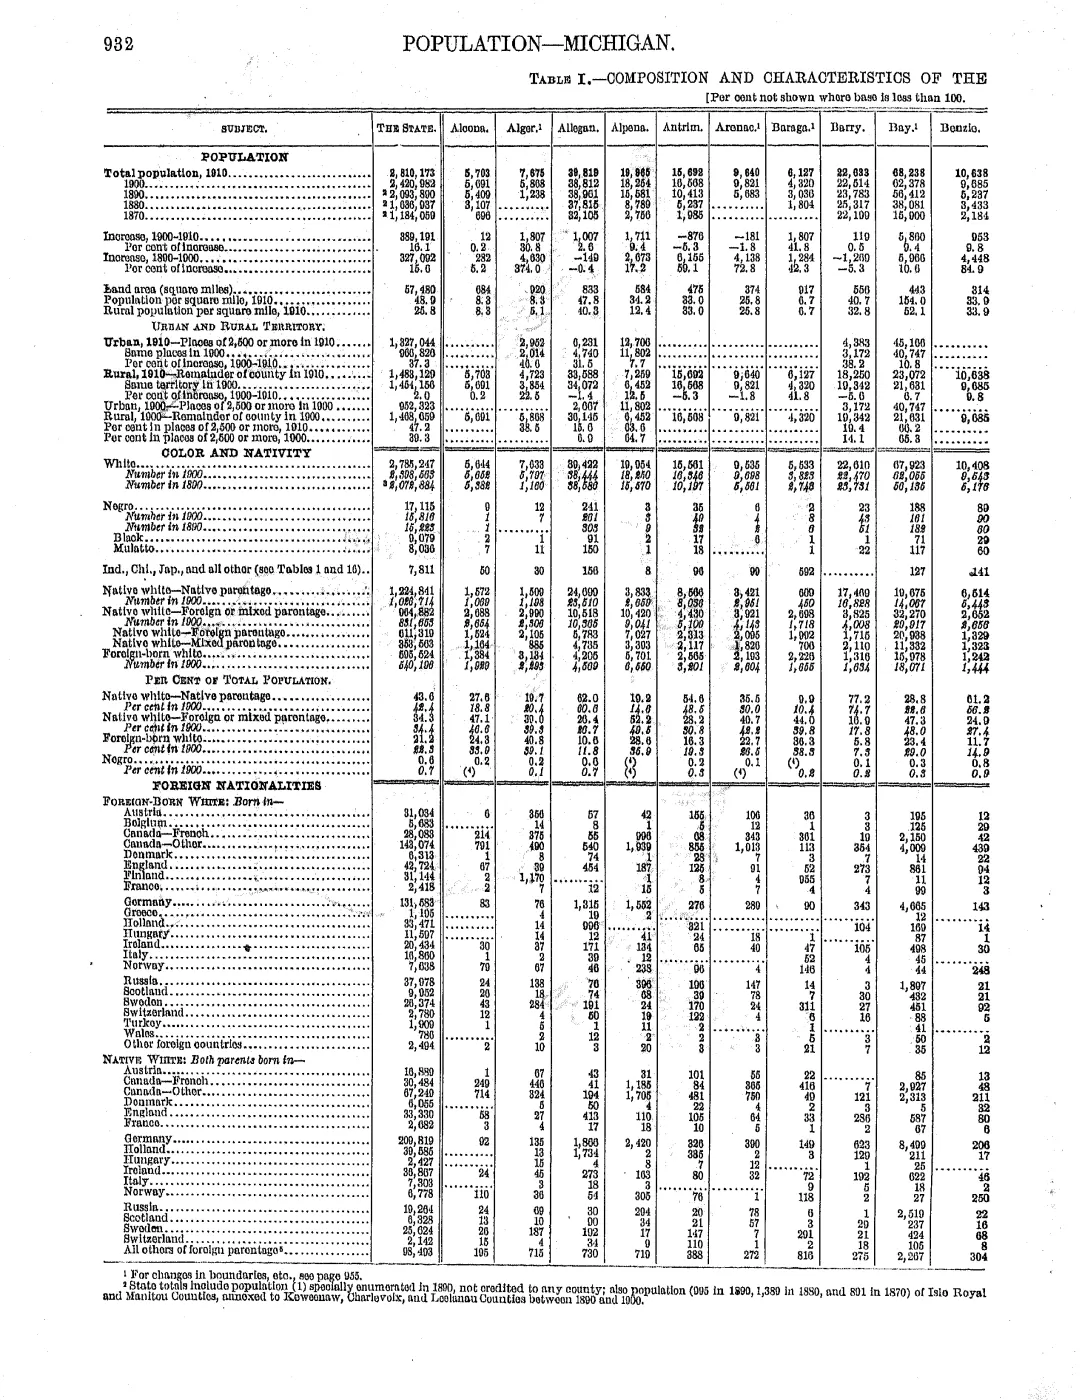
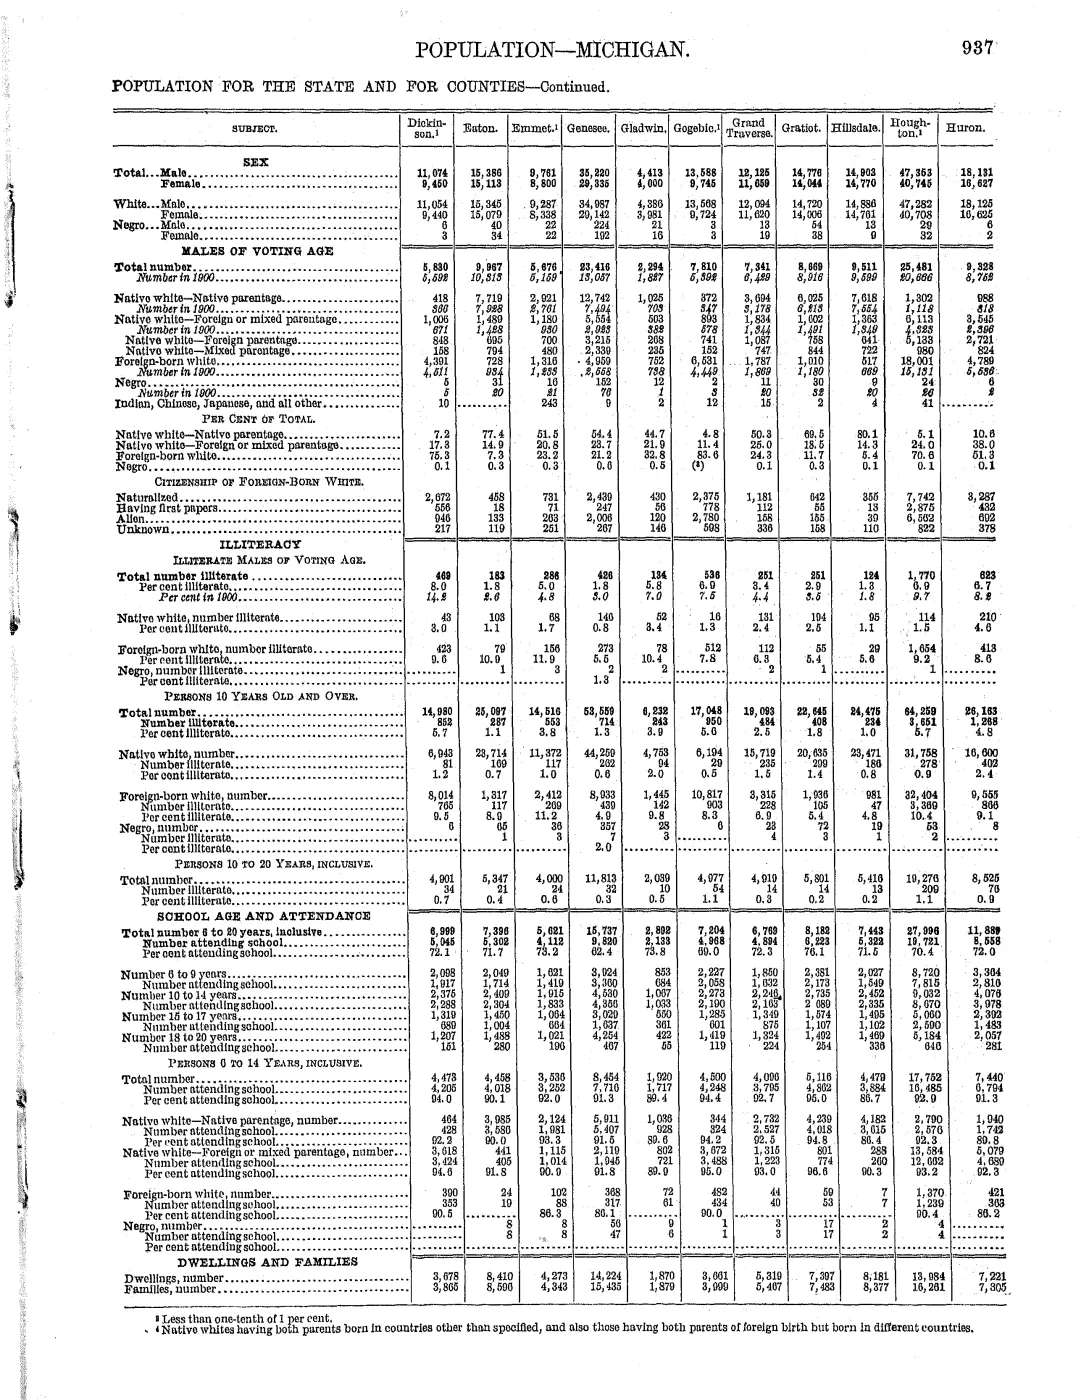
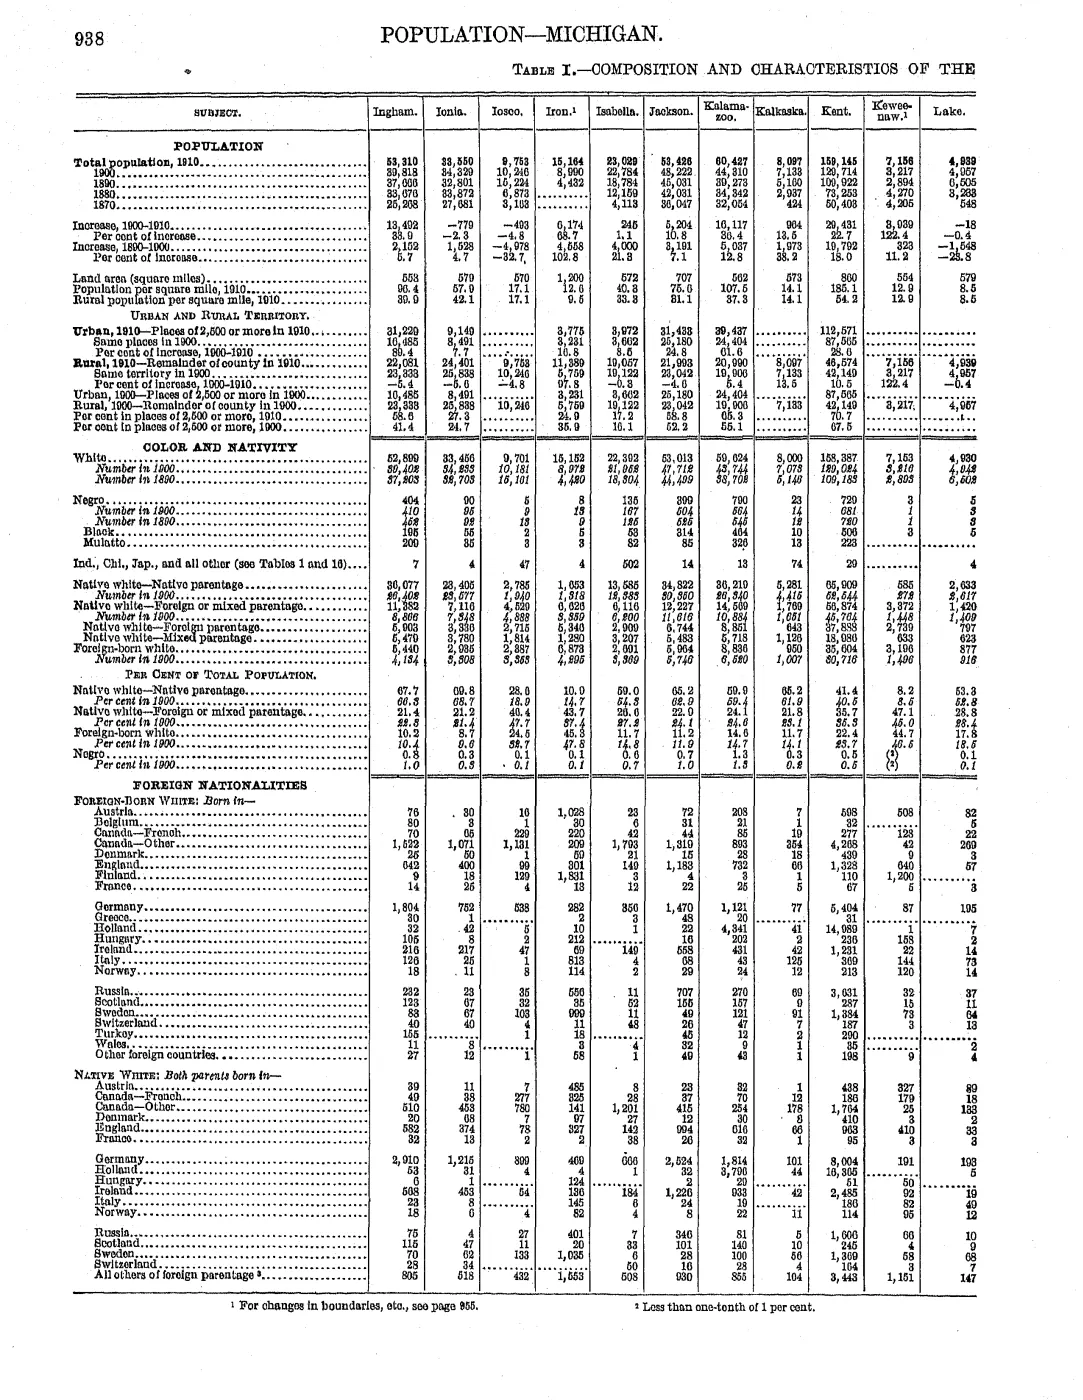
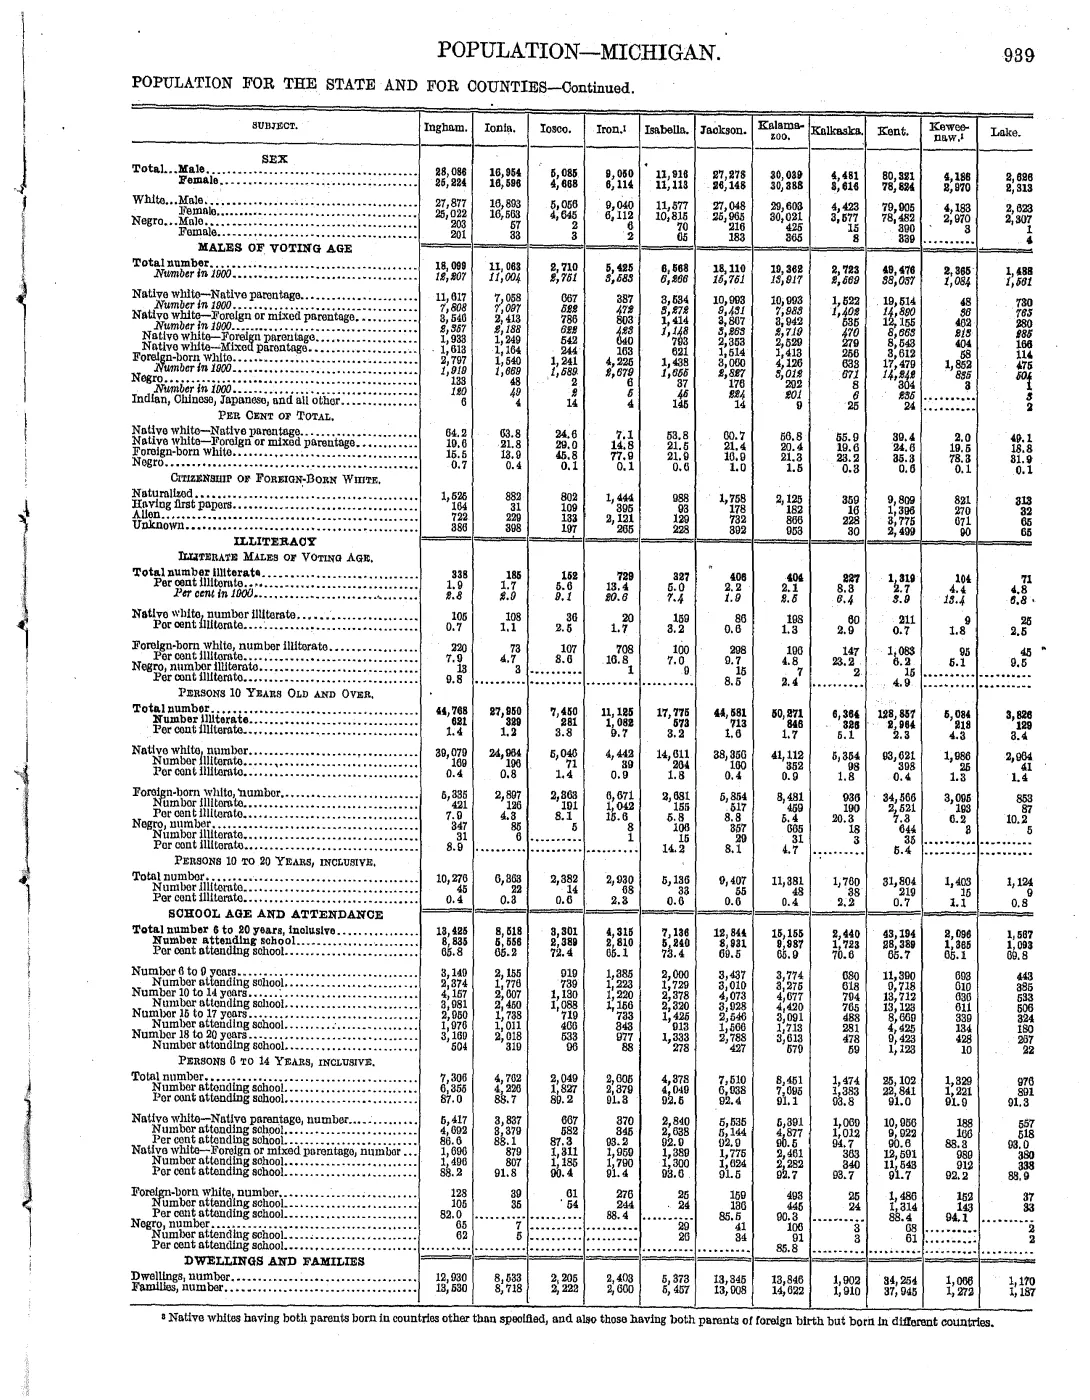
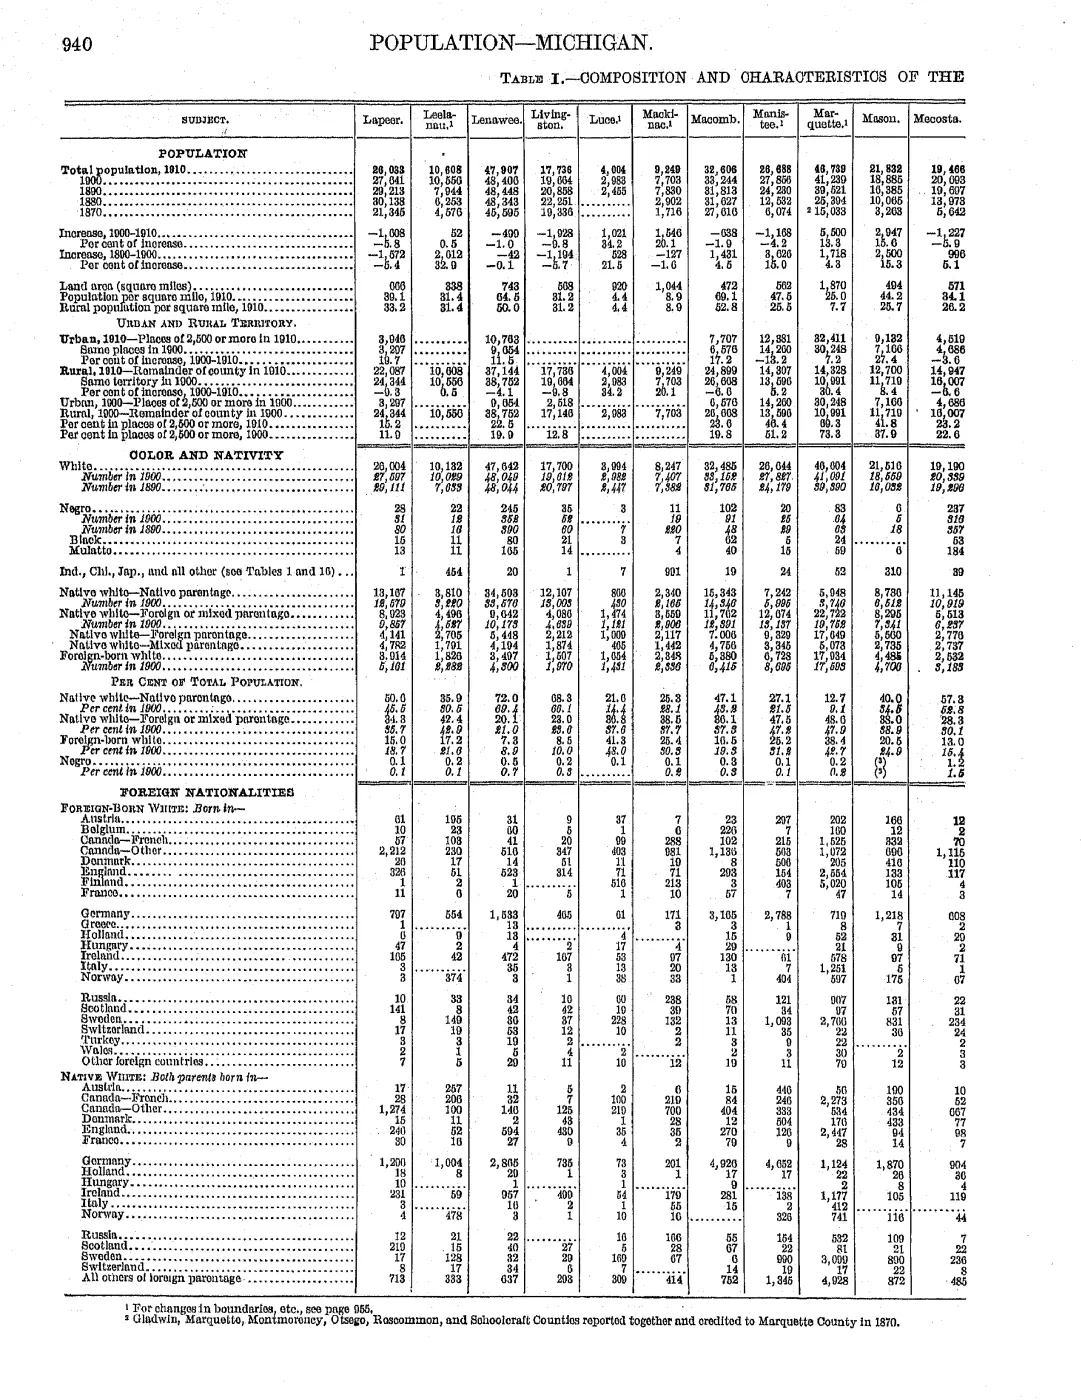
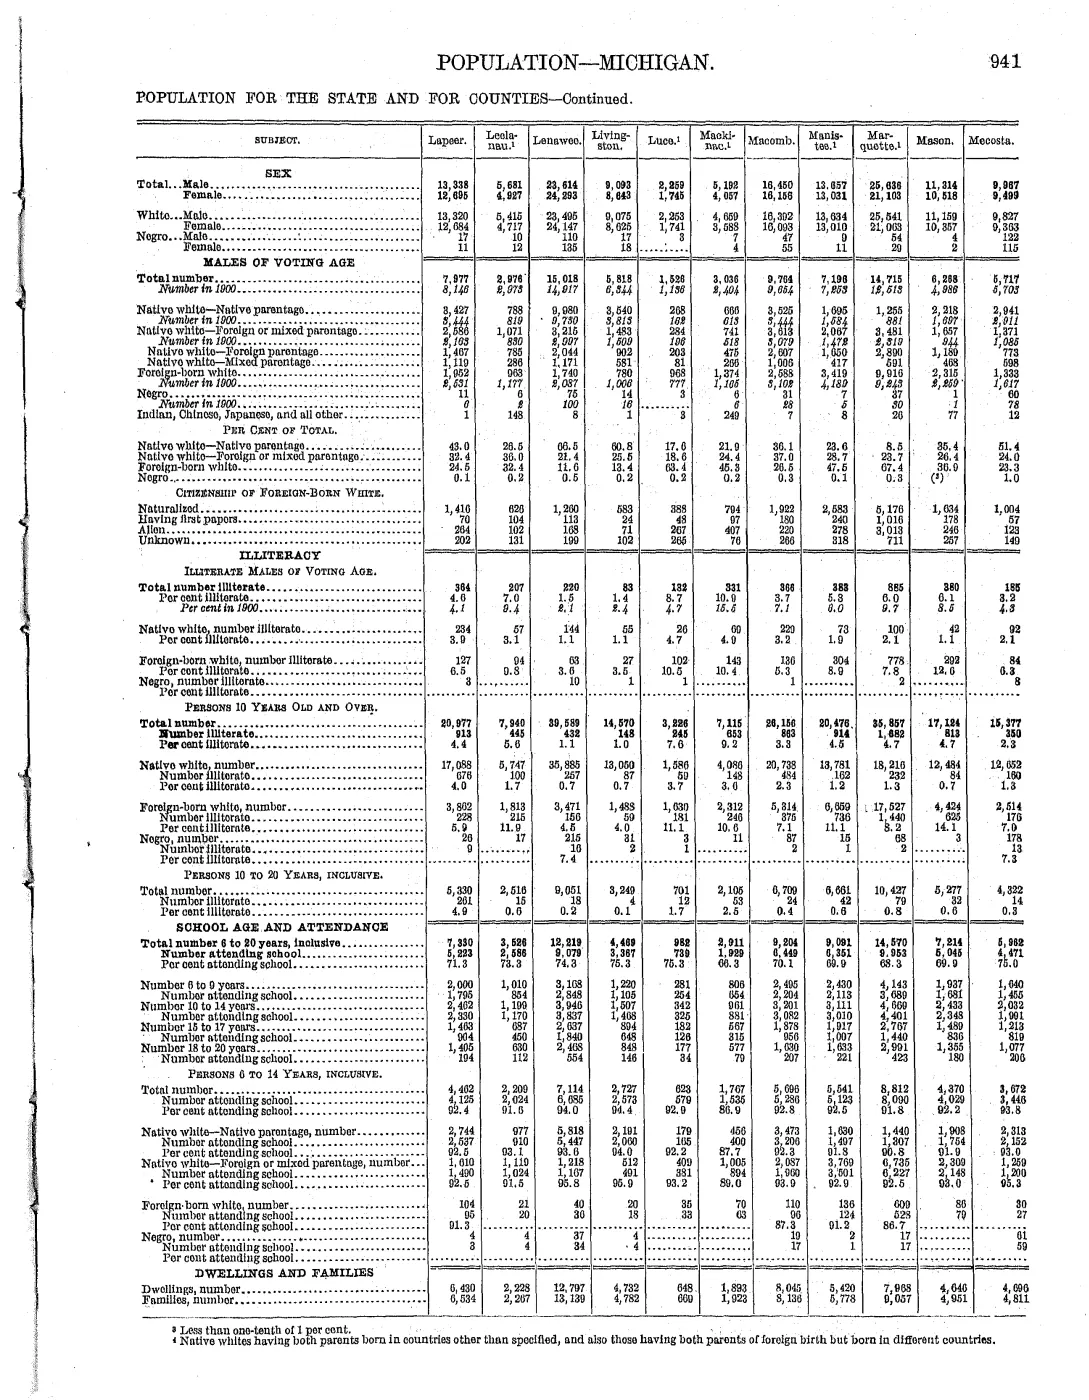
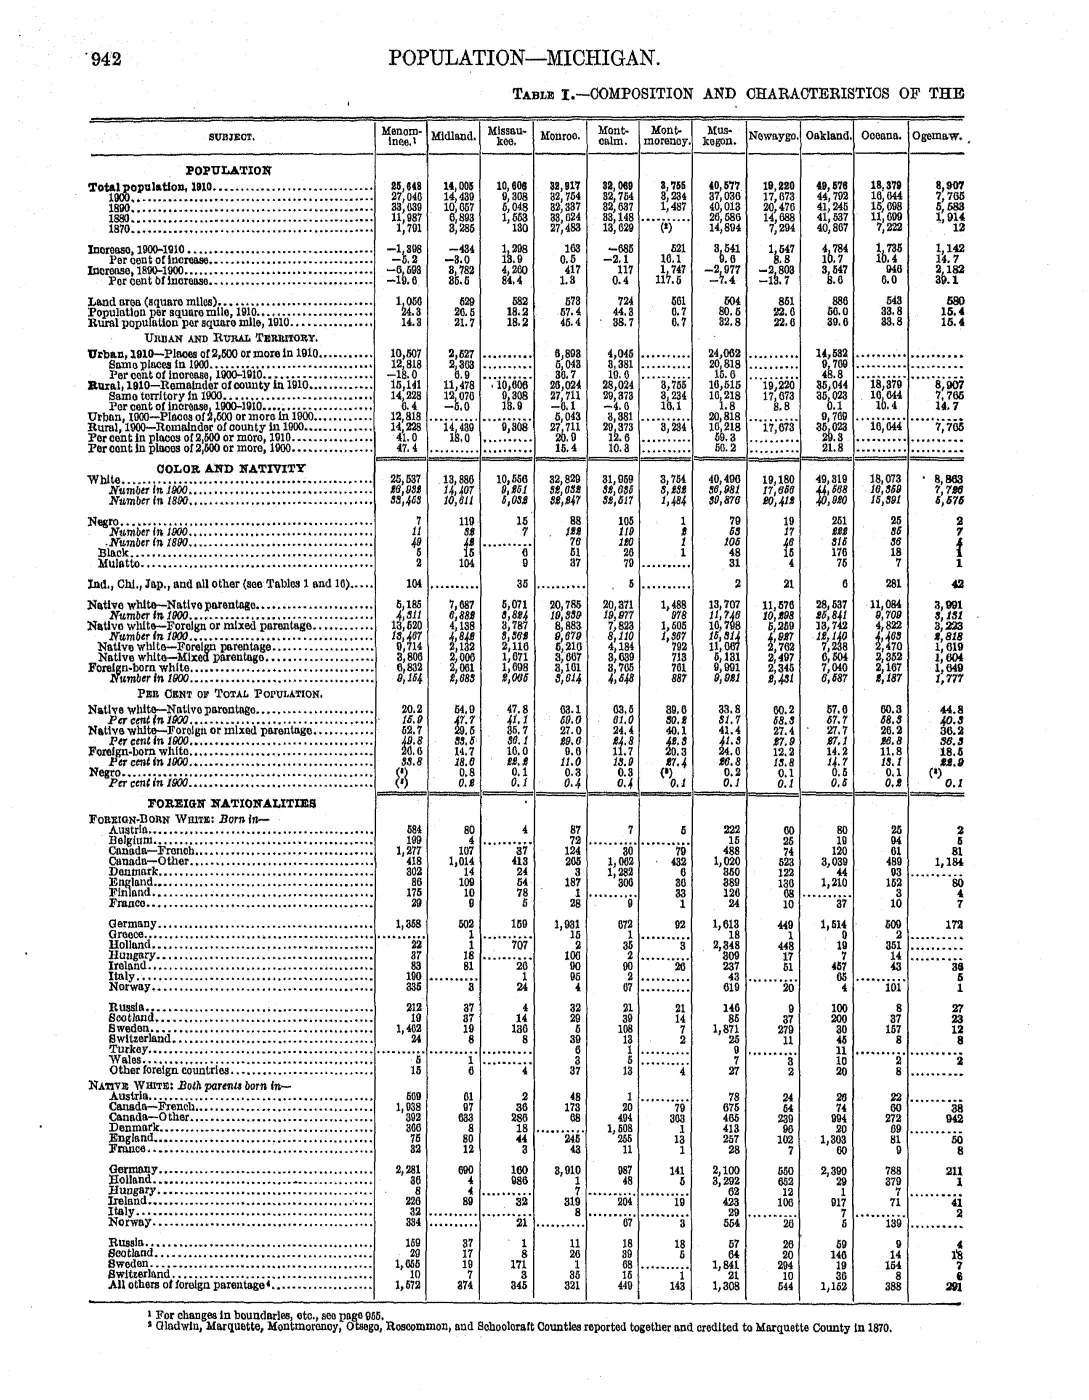
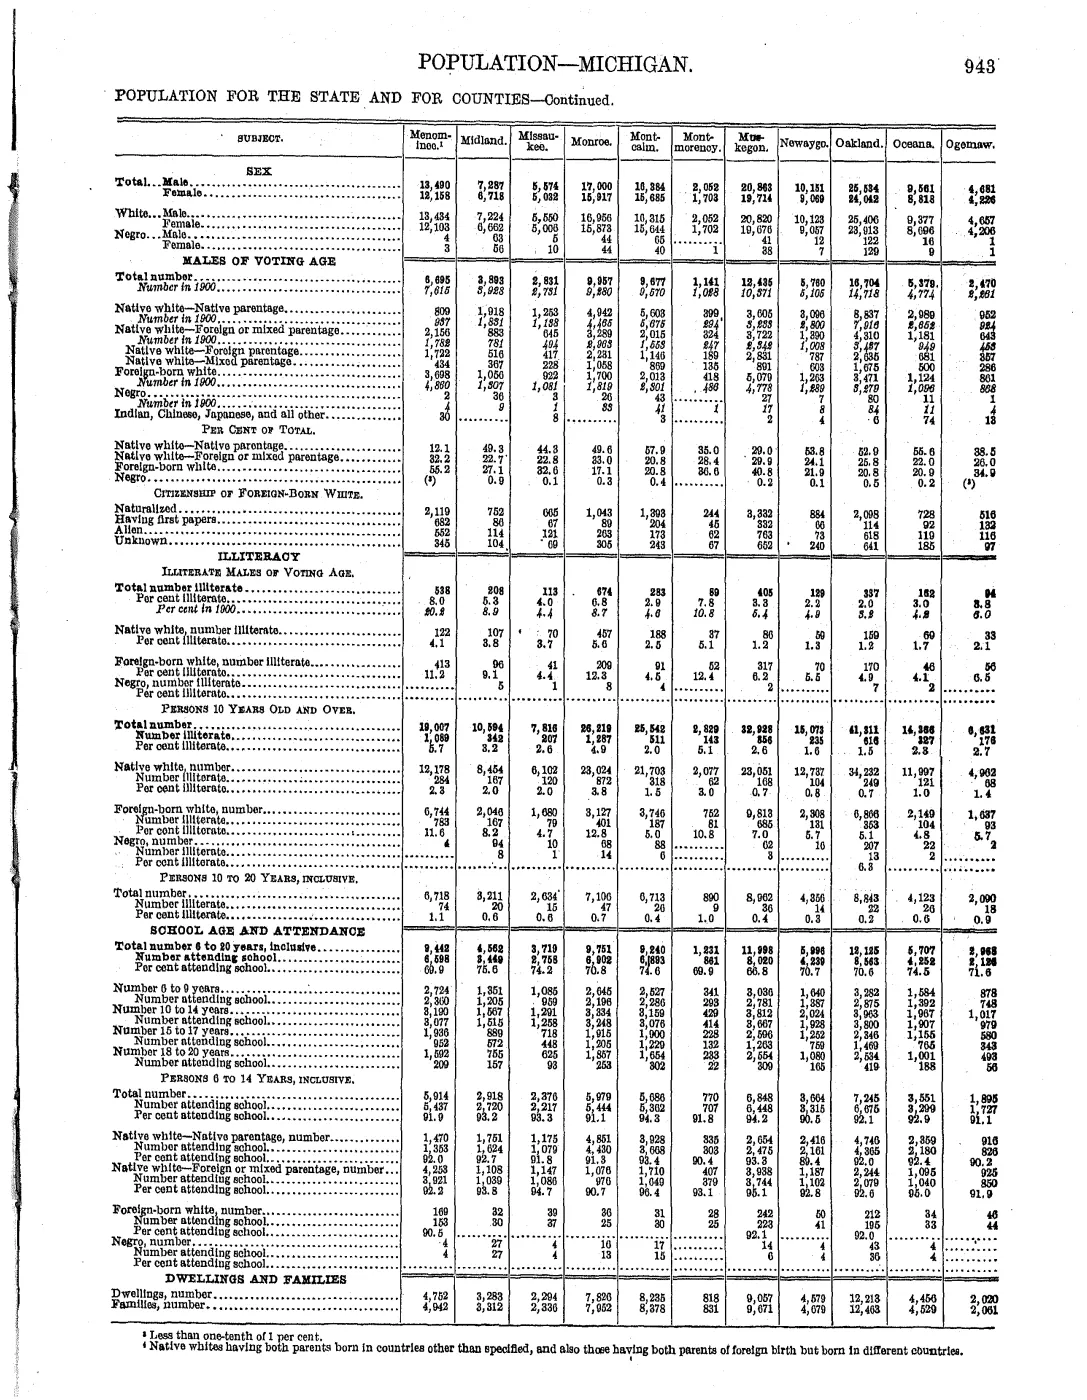
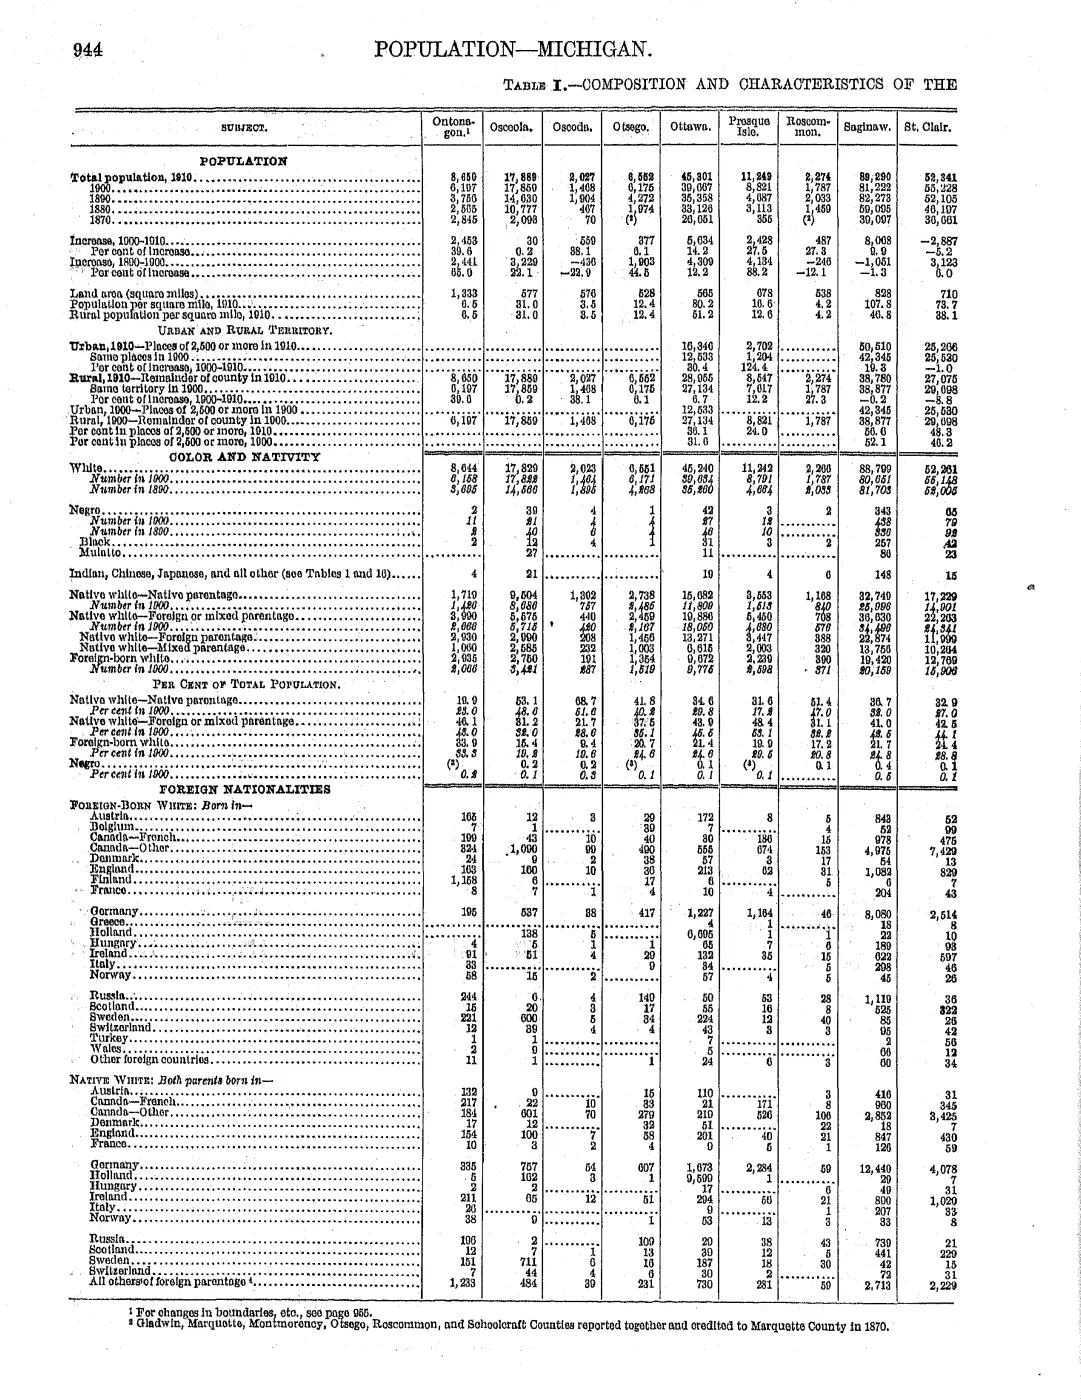
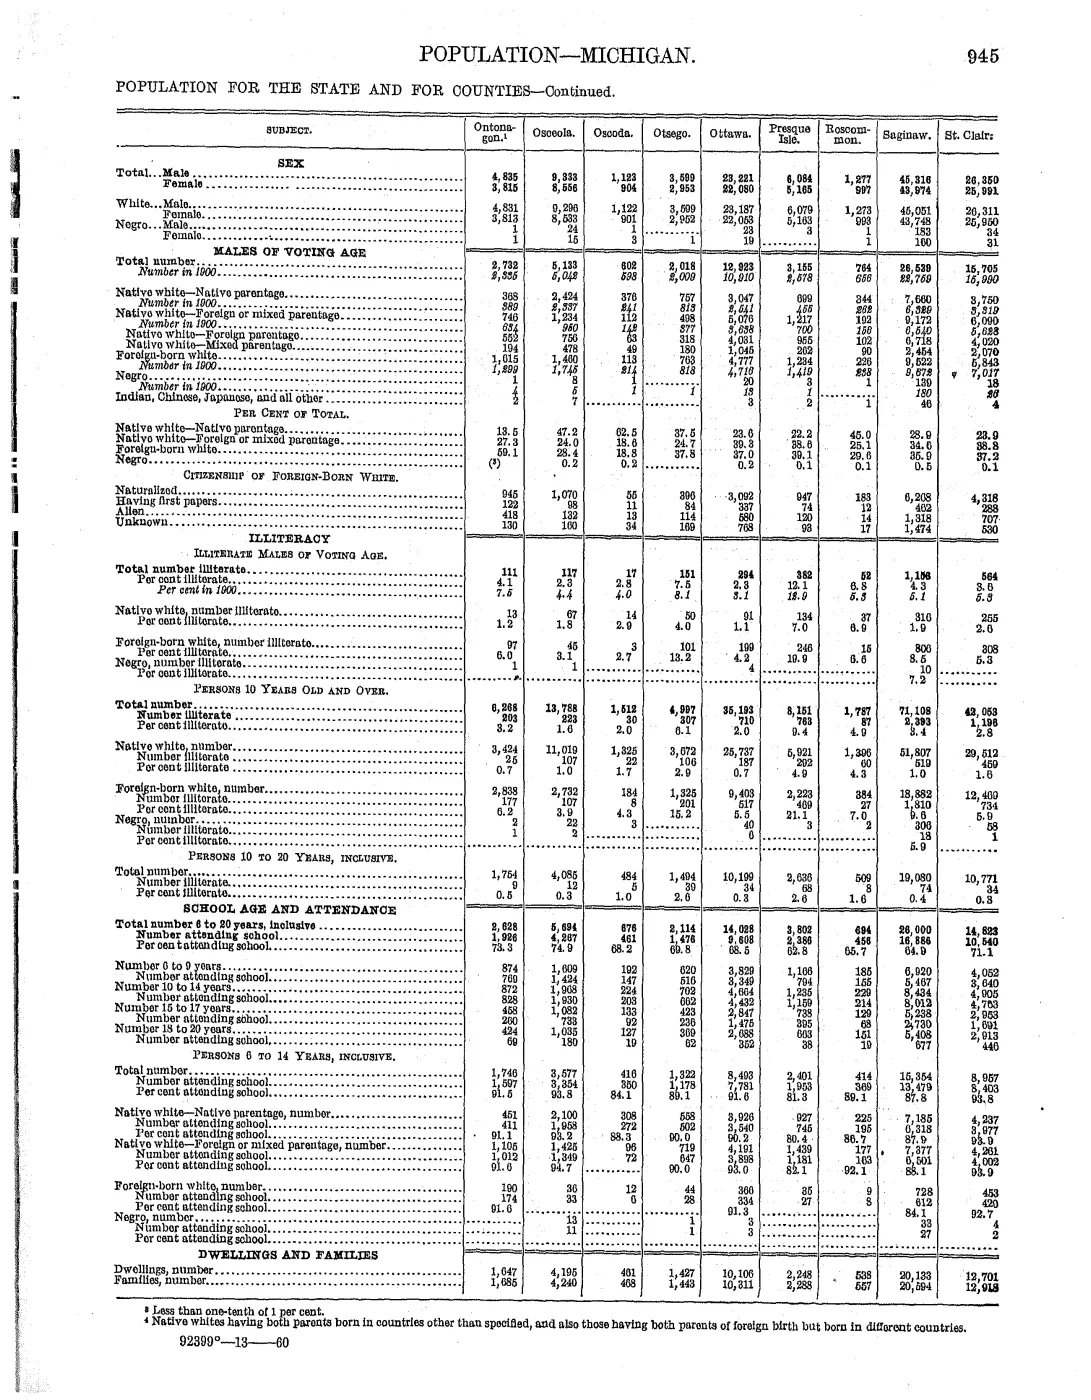
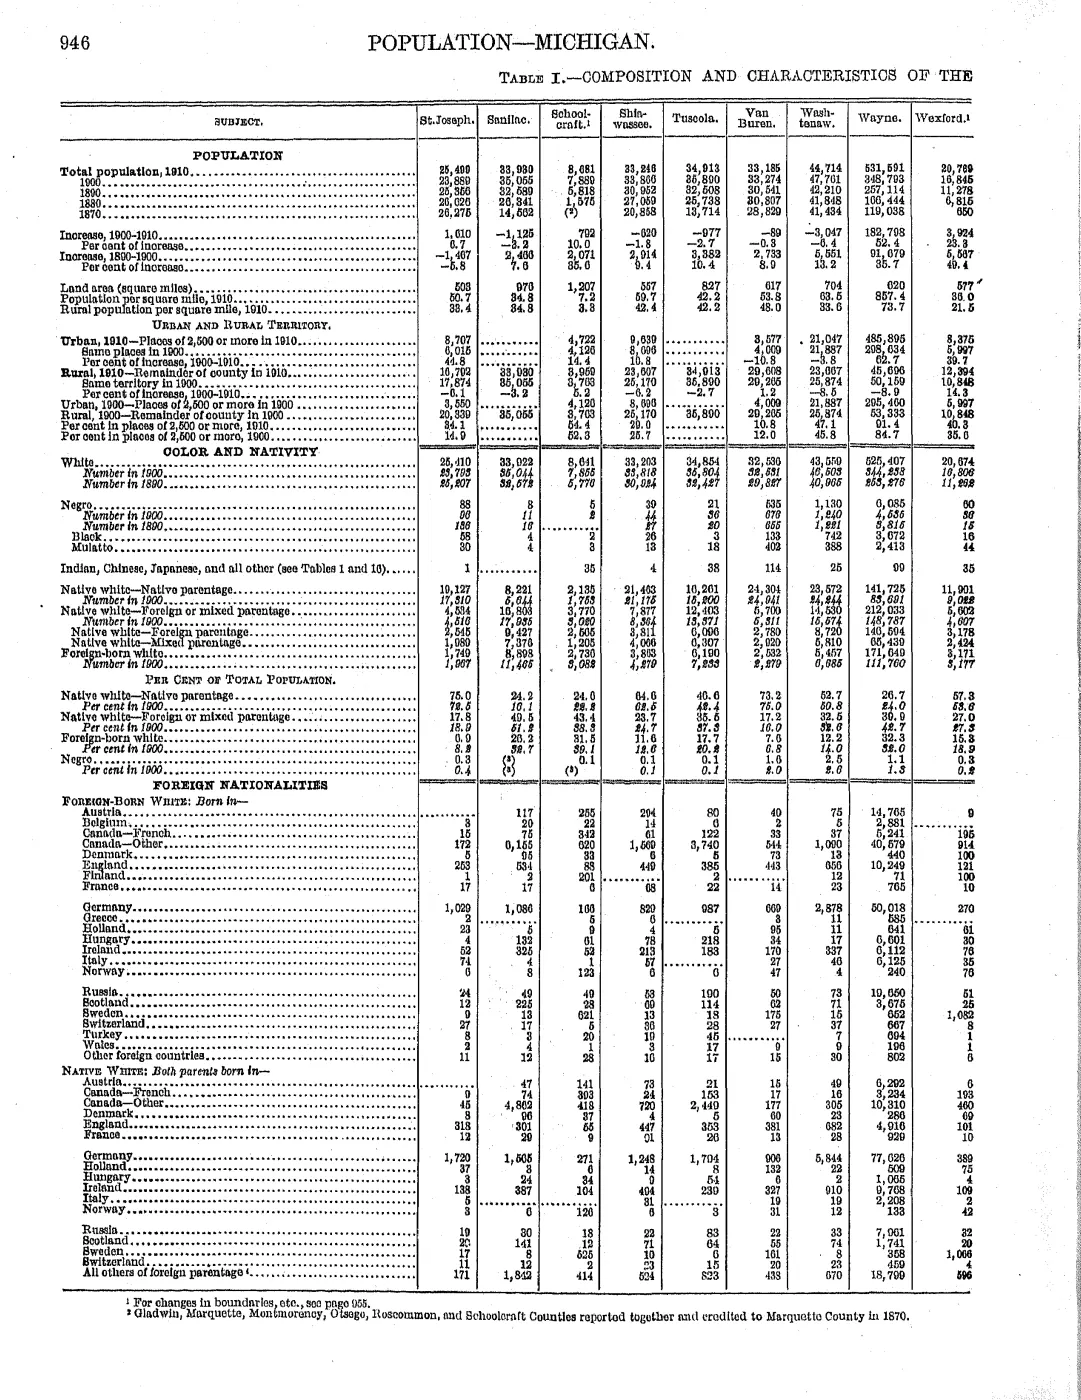
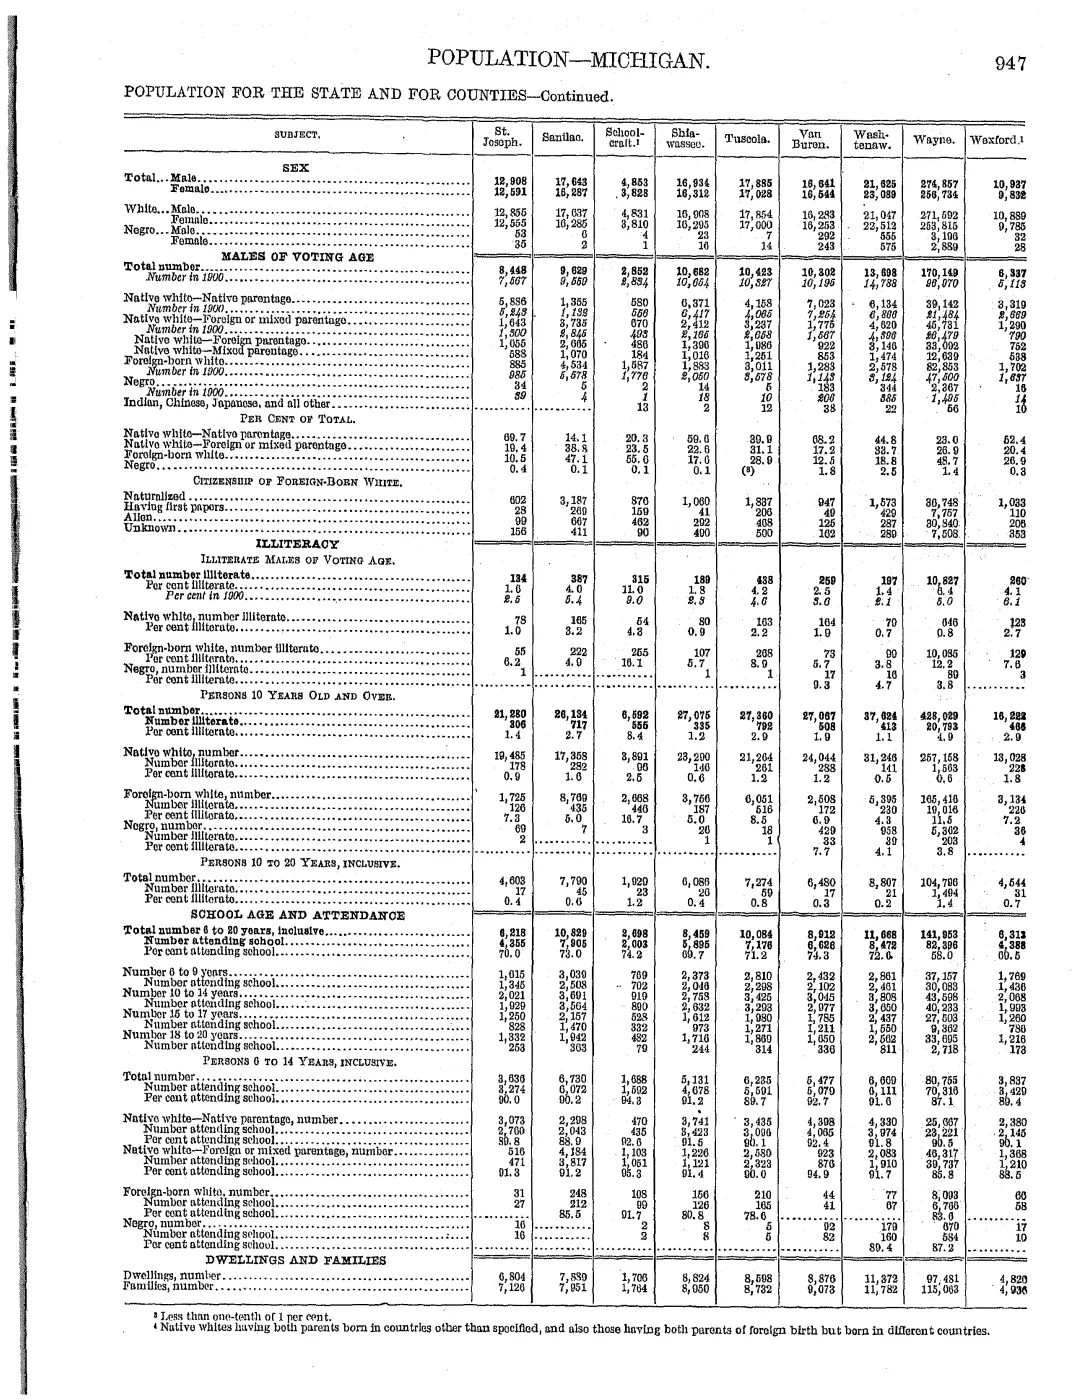
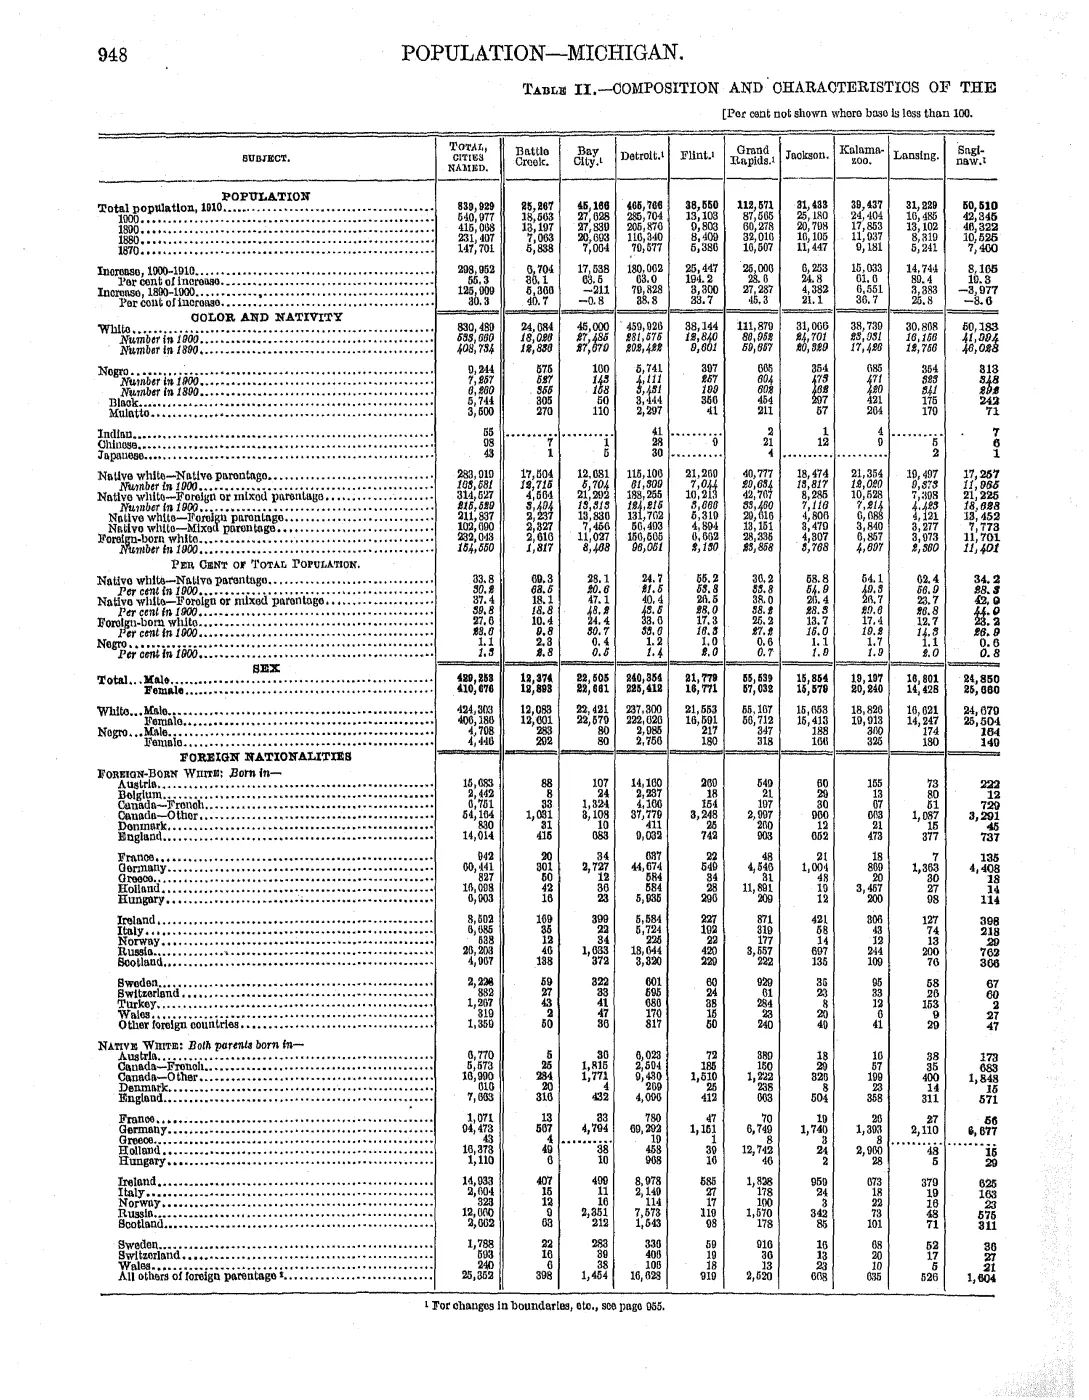
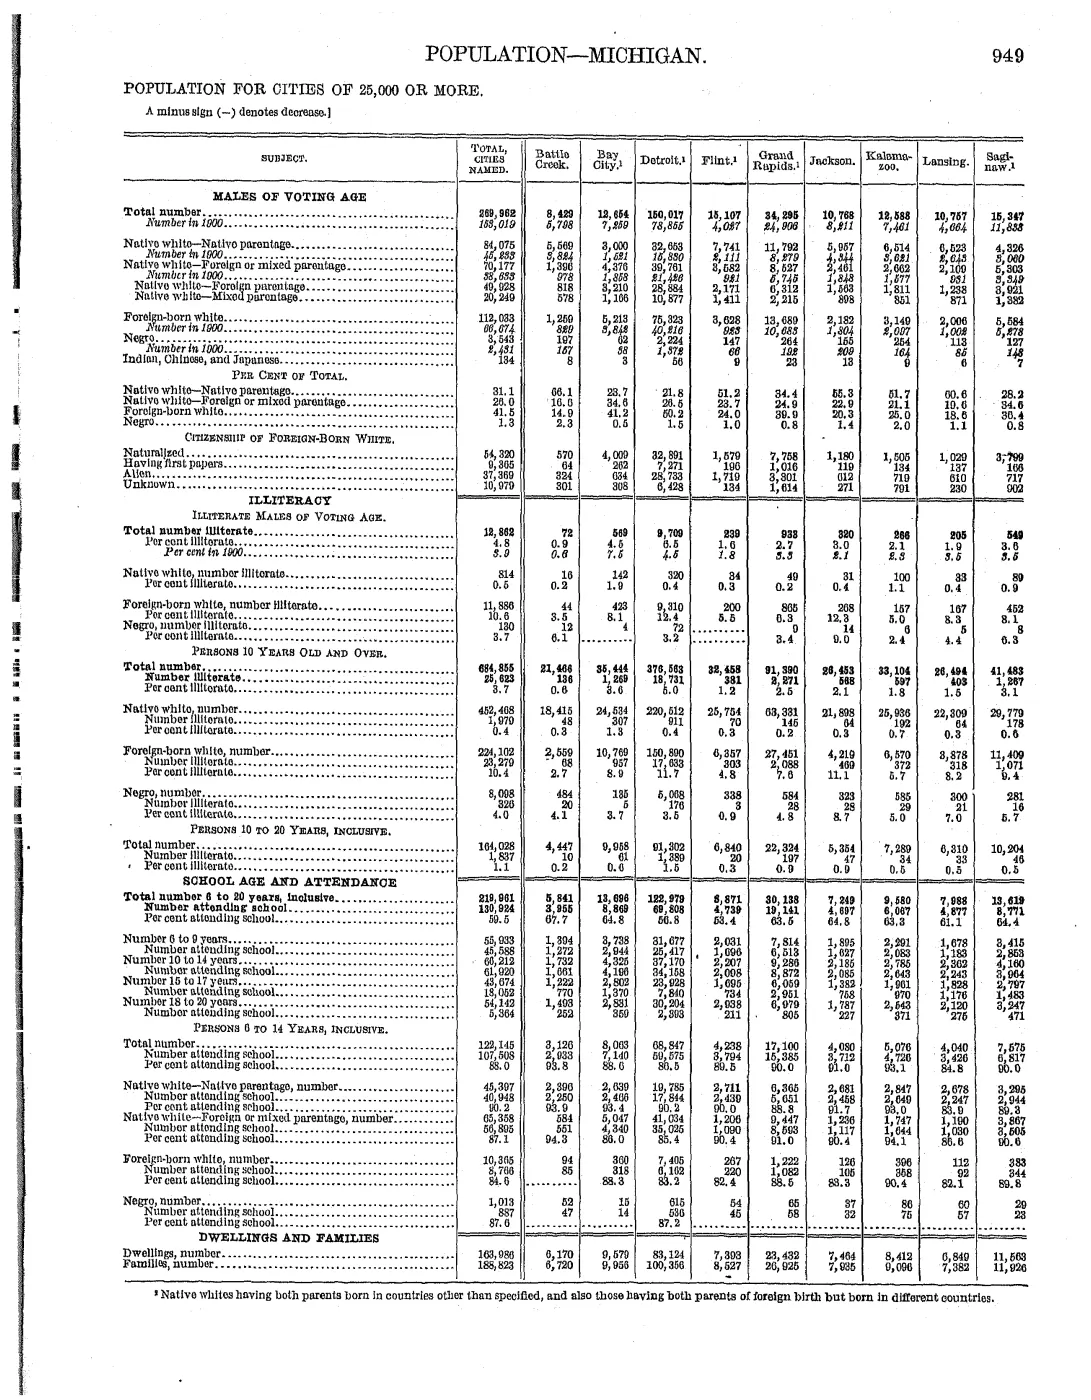
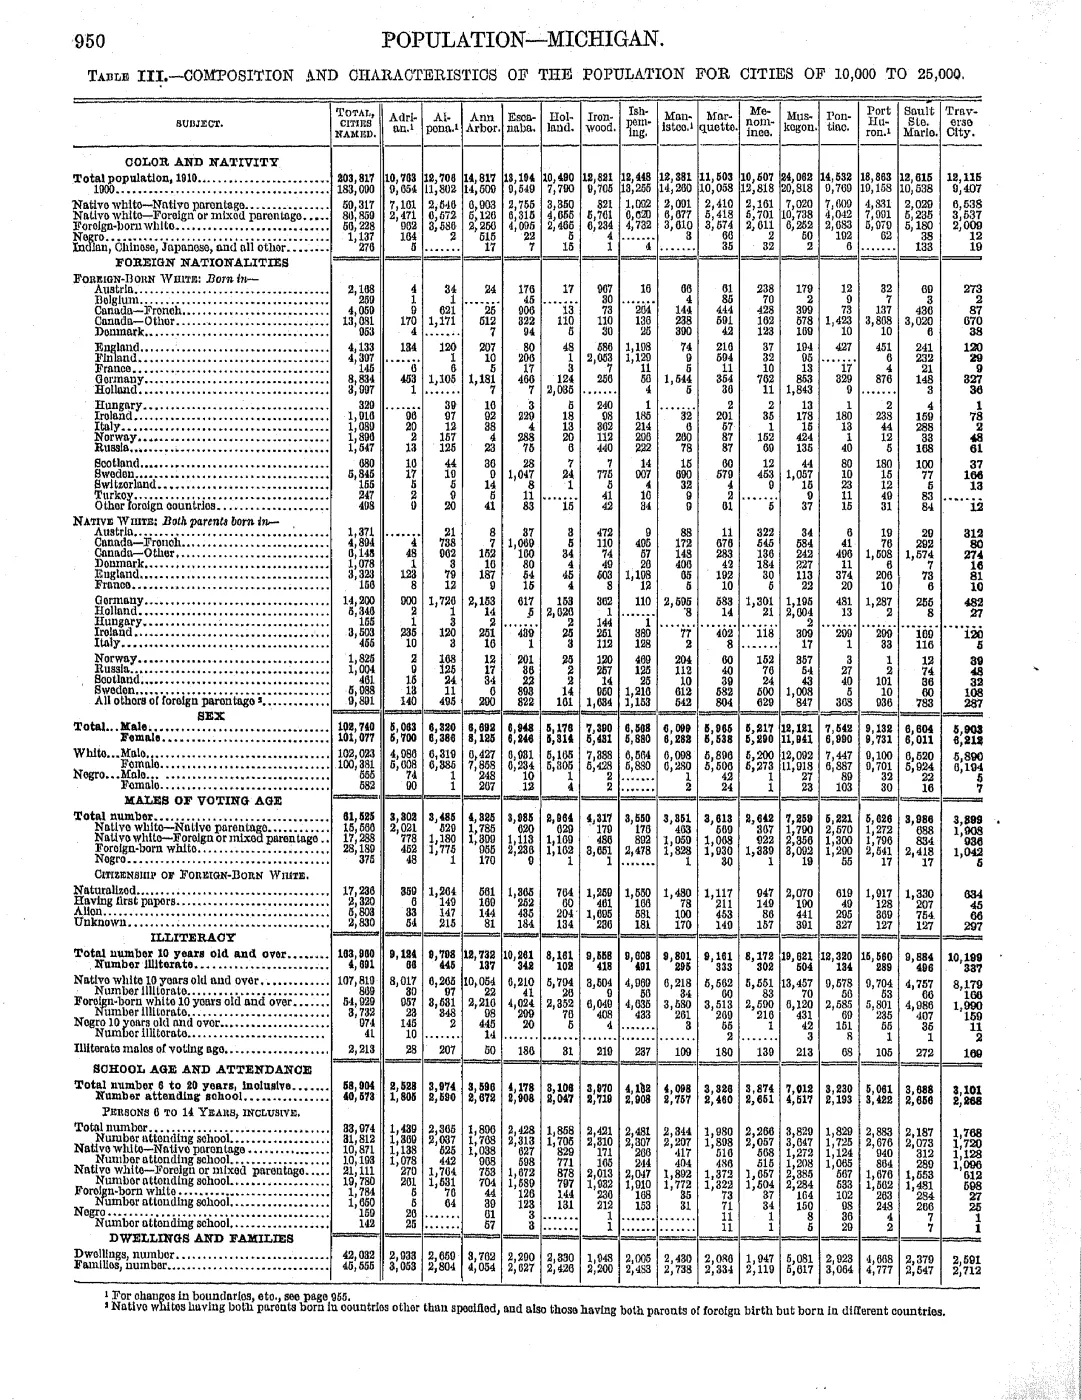
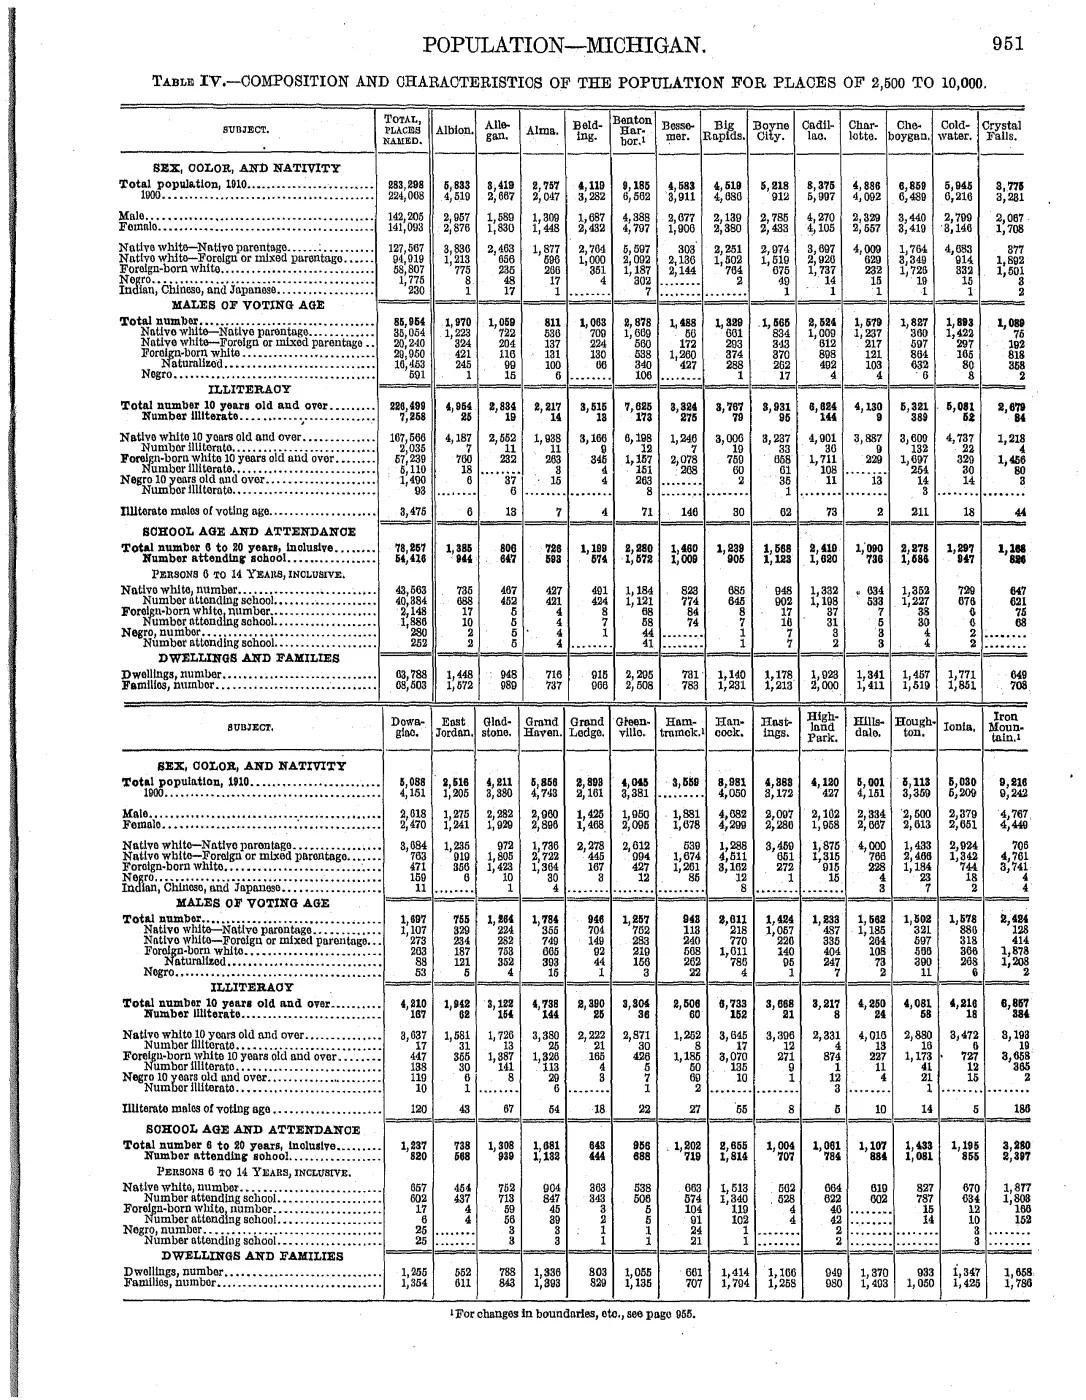
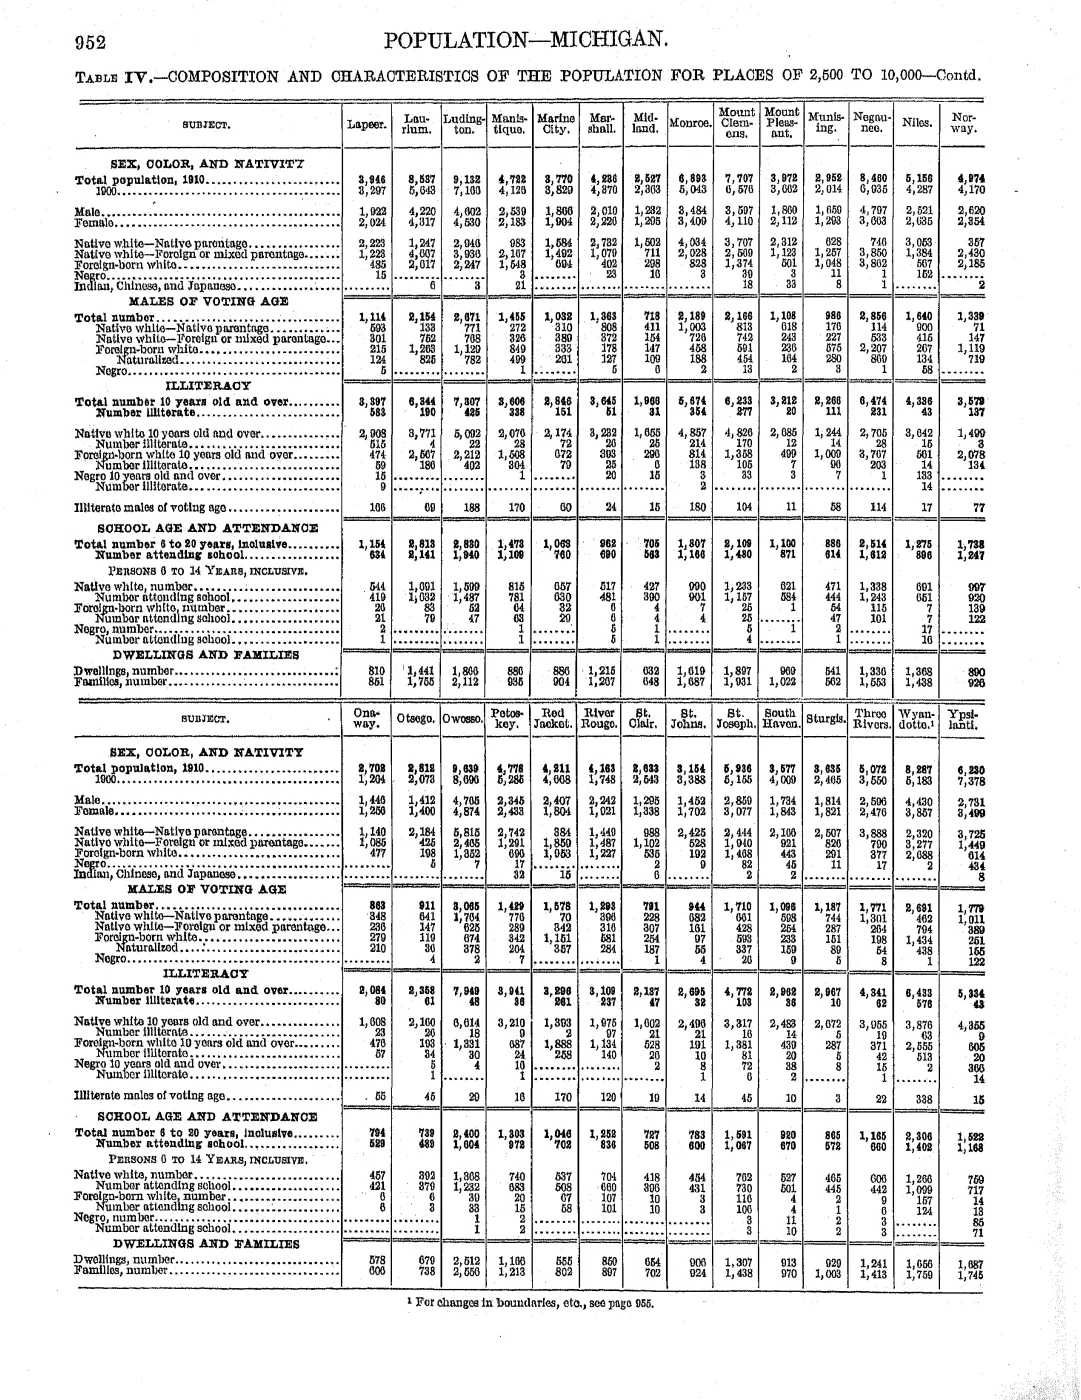
Read the document
113 pages, rendered from the held scan.
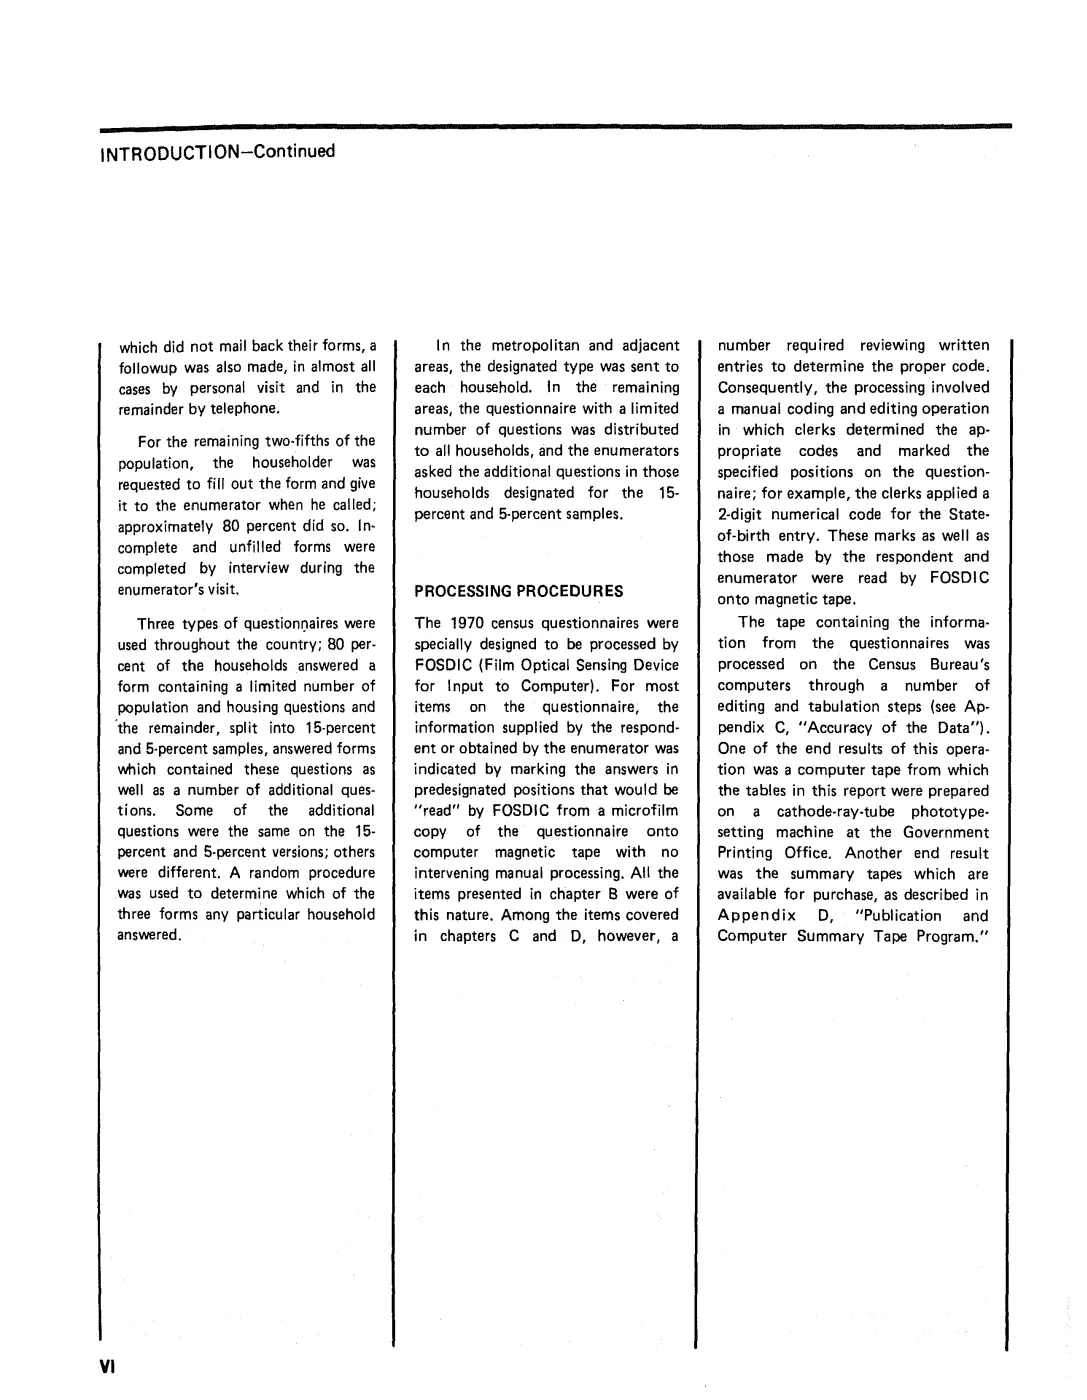
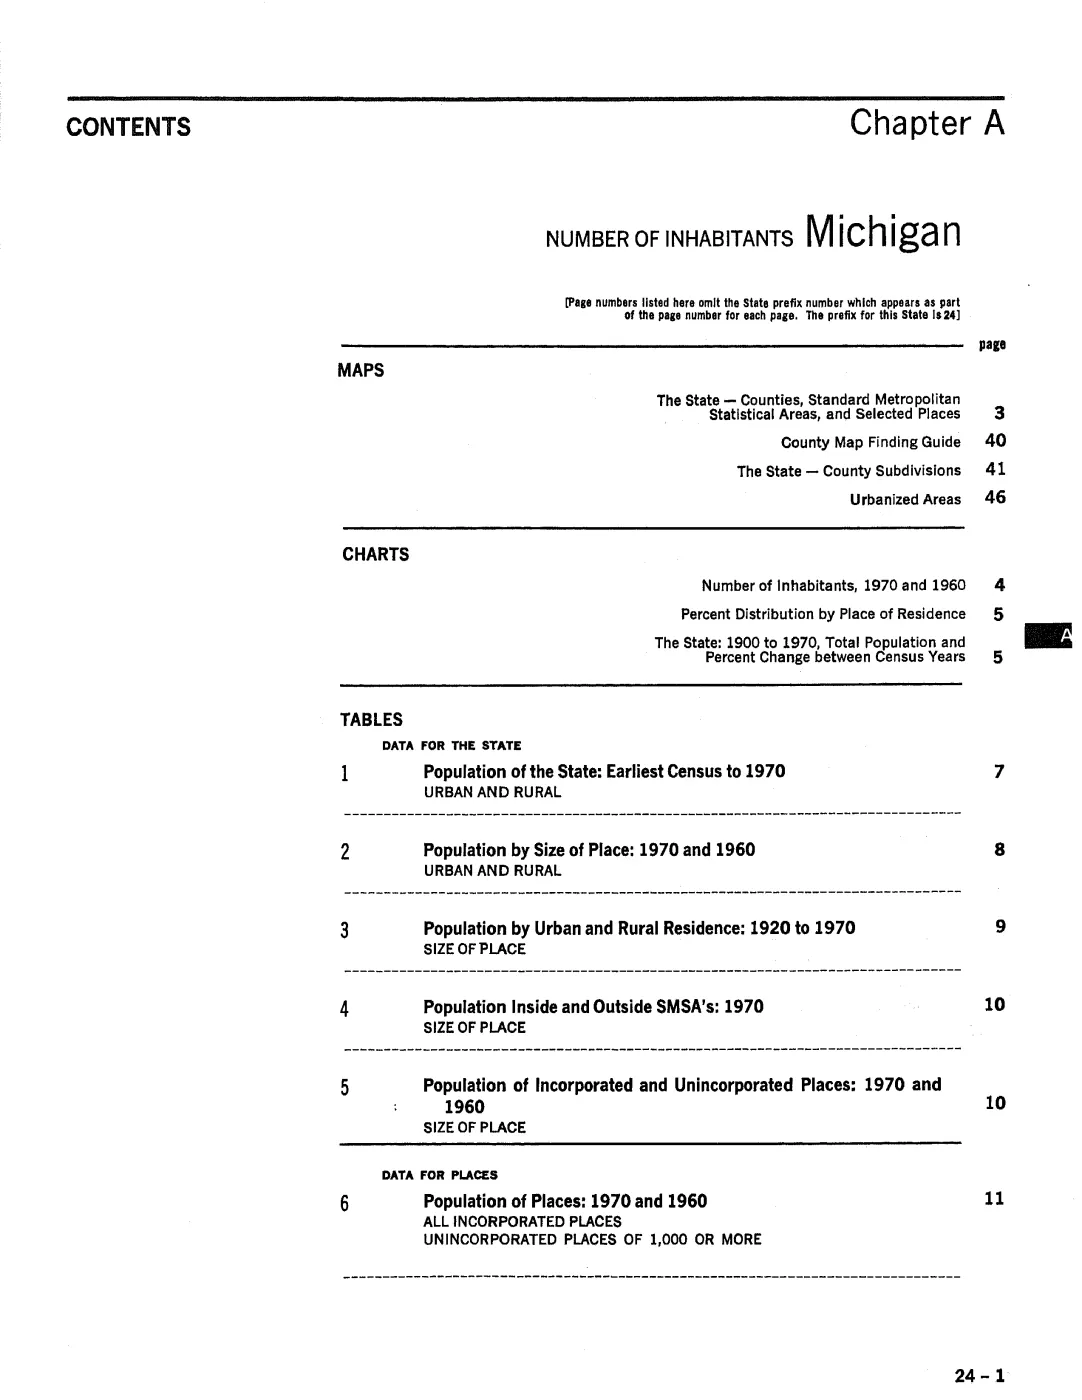
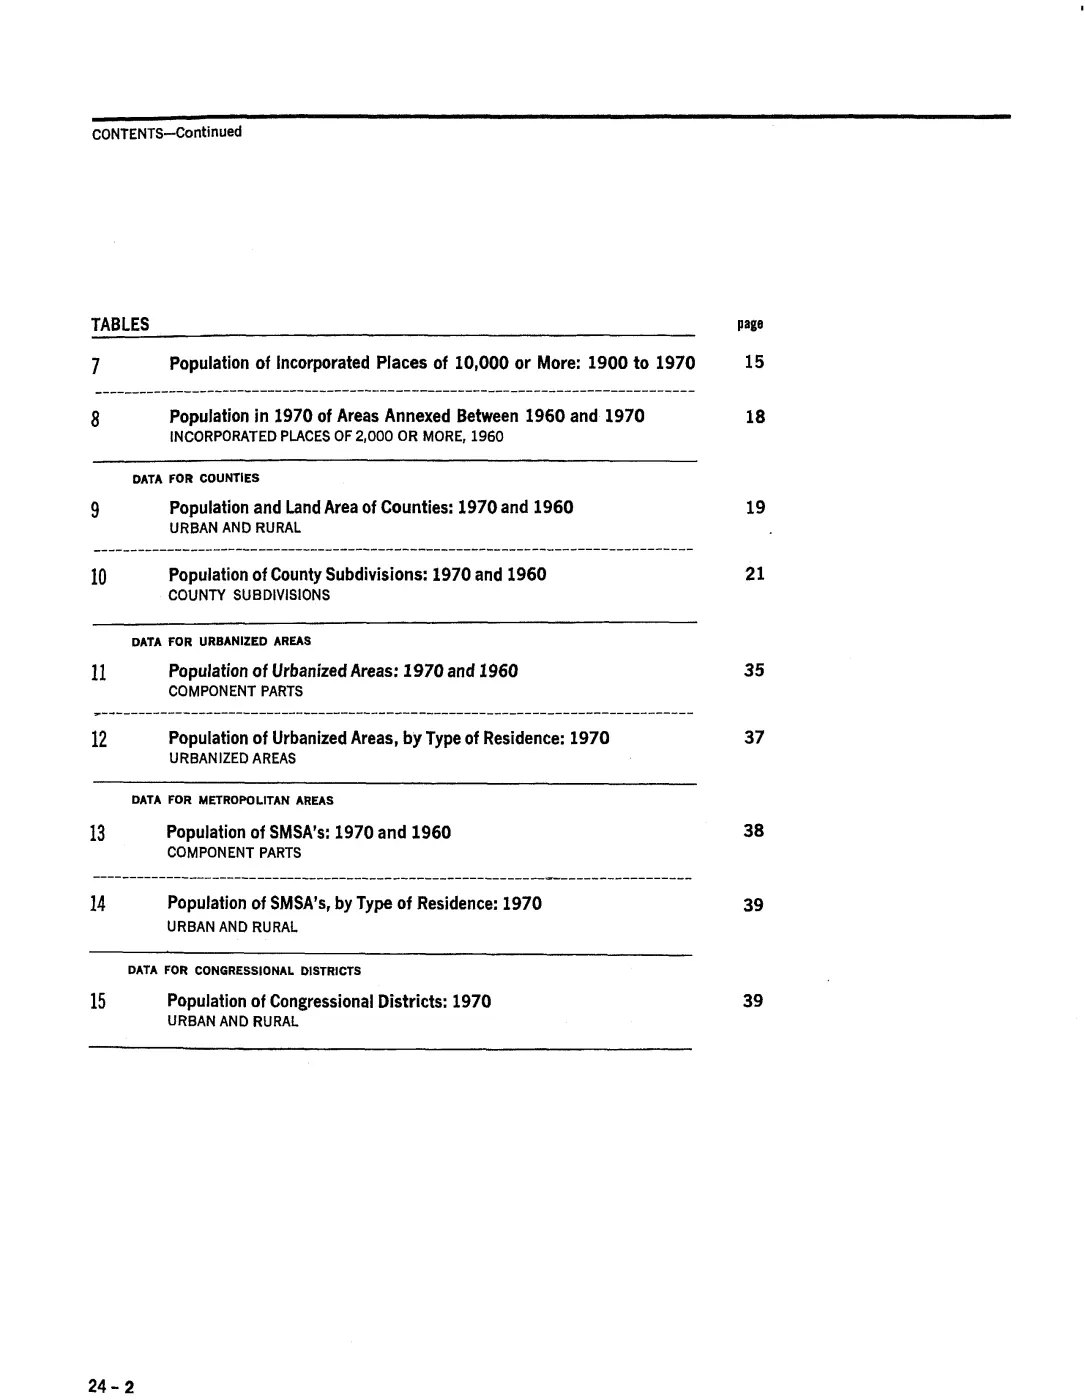
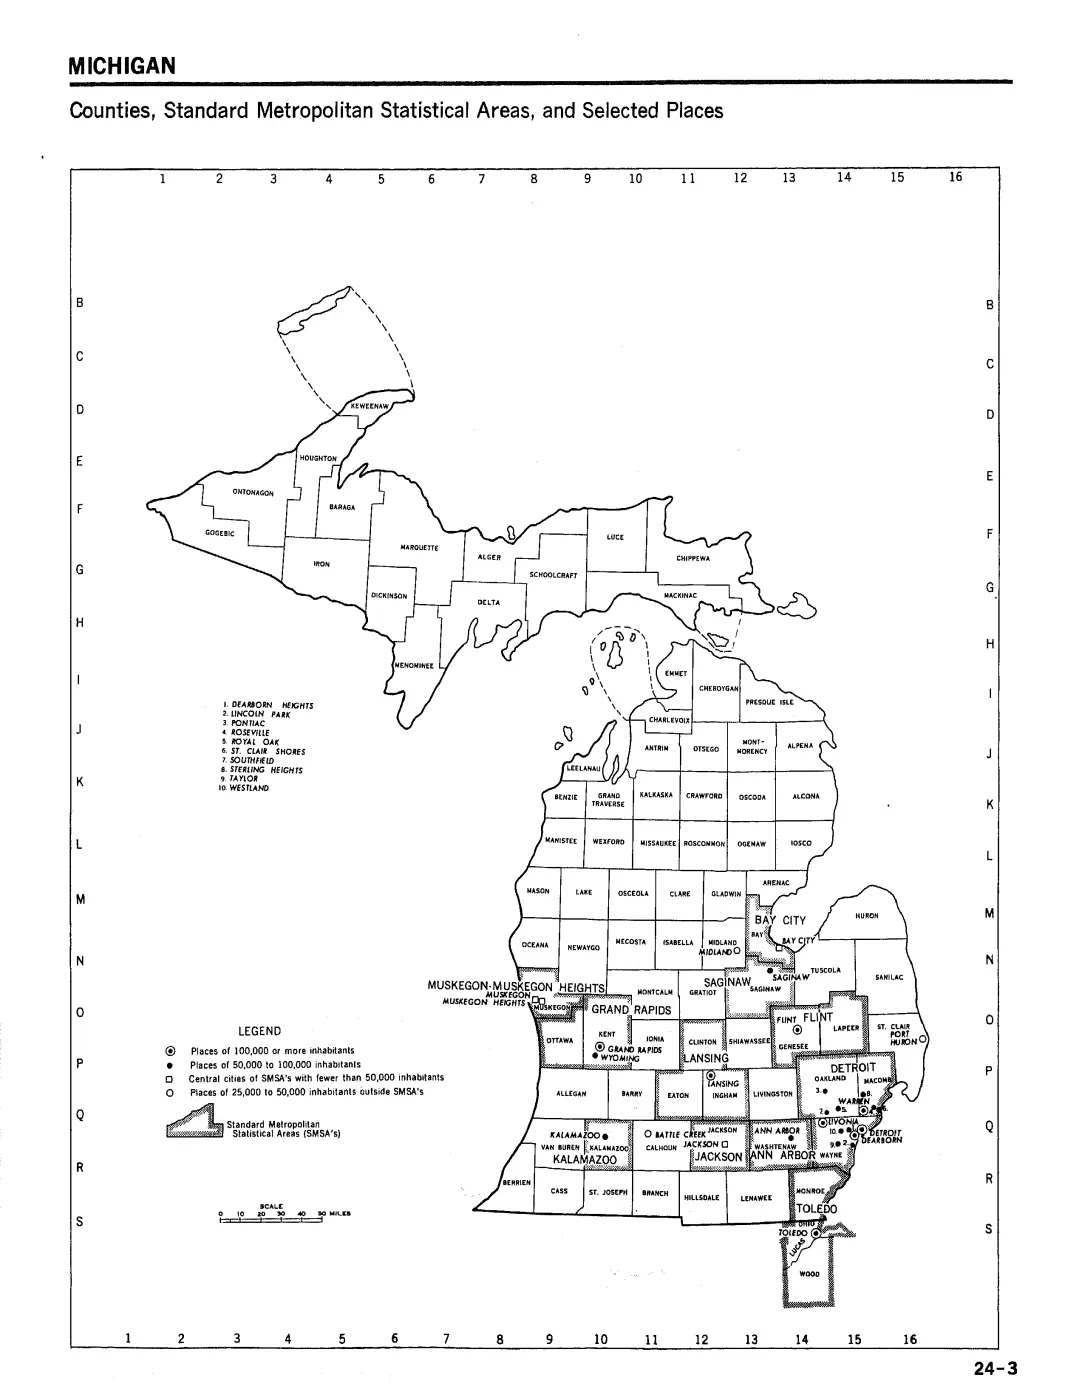
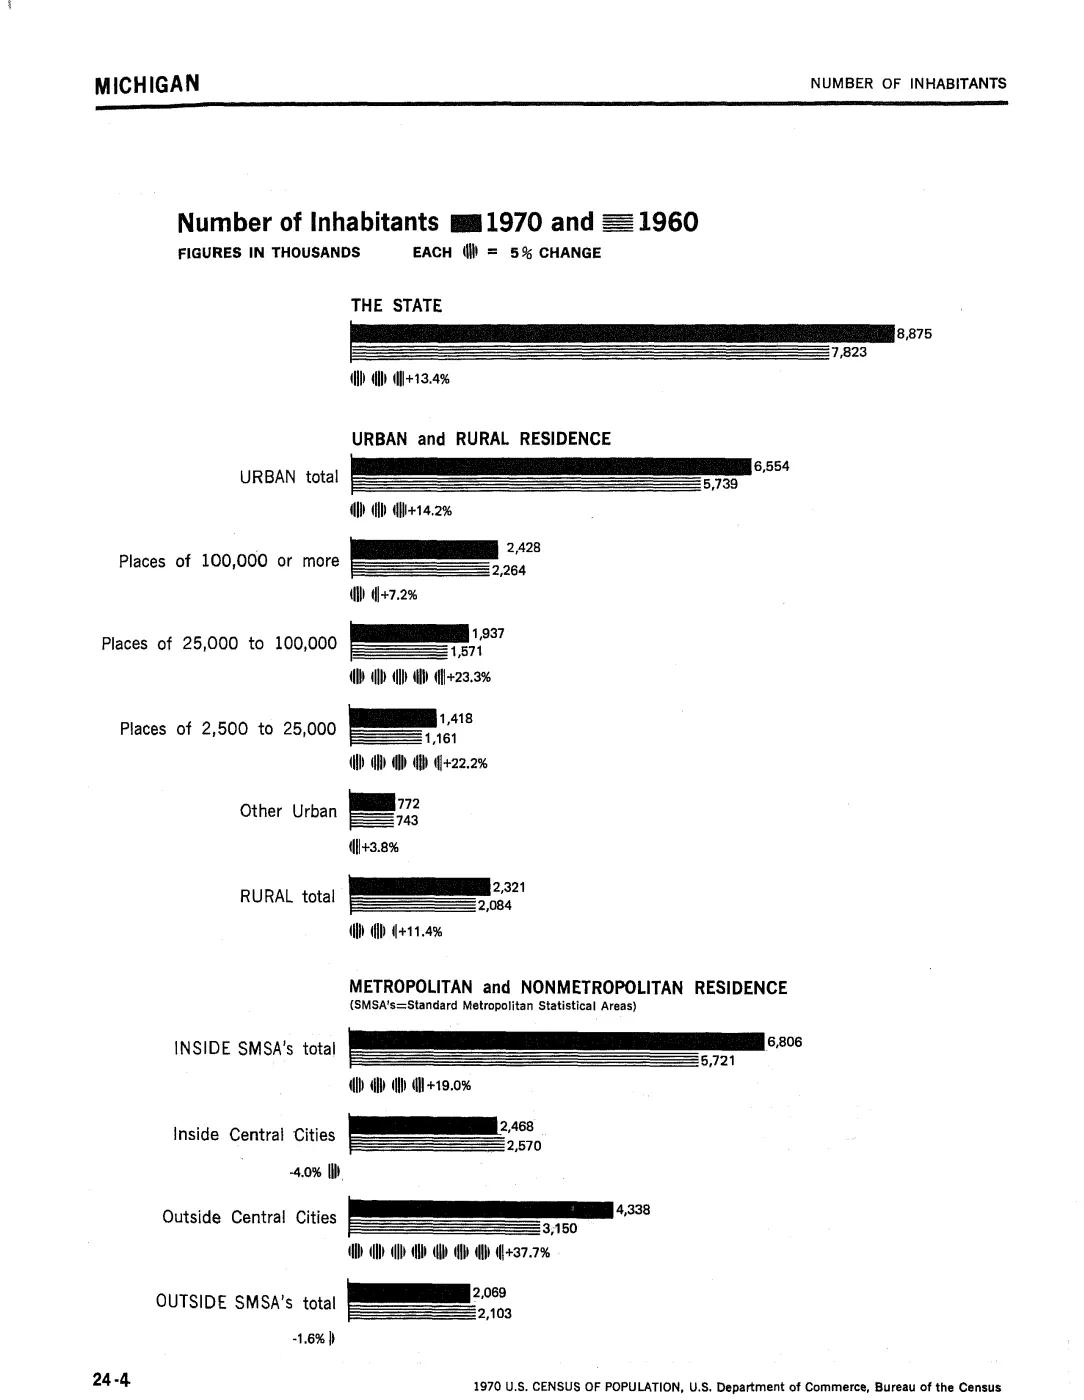
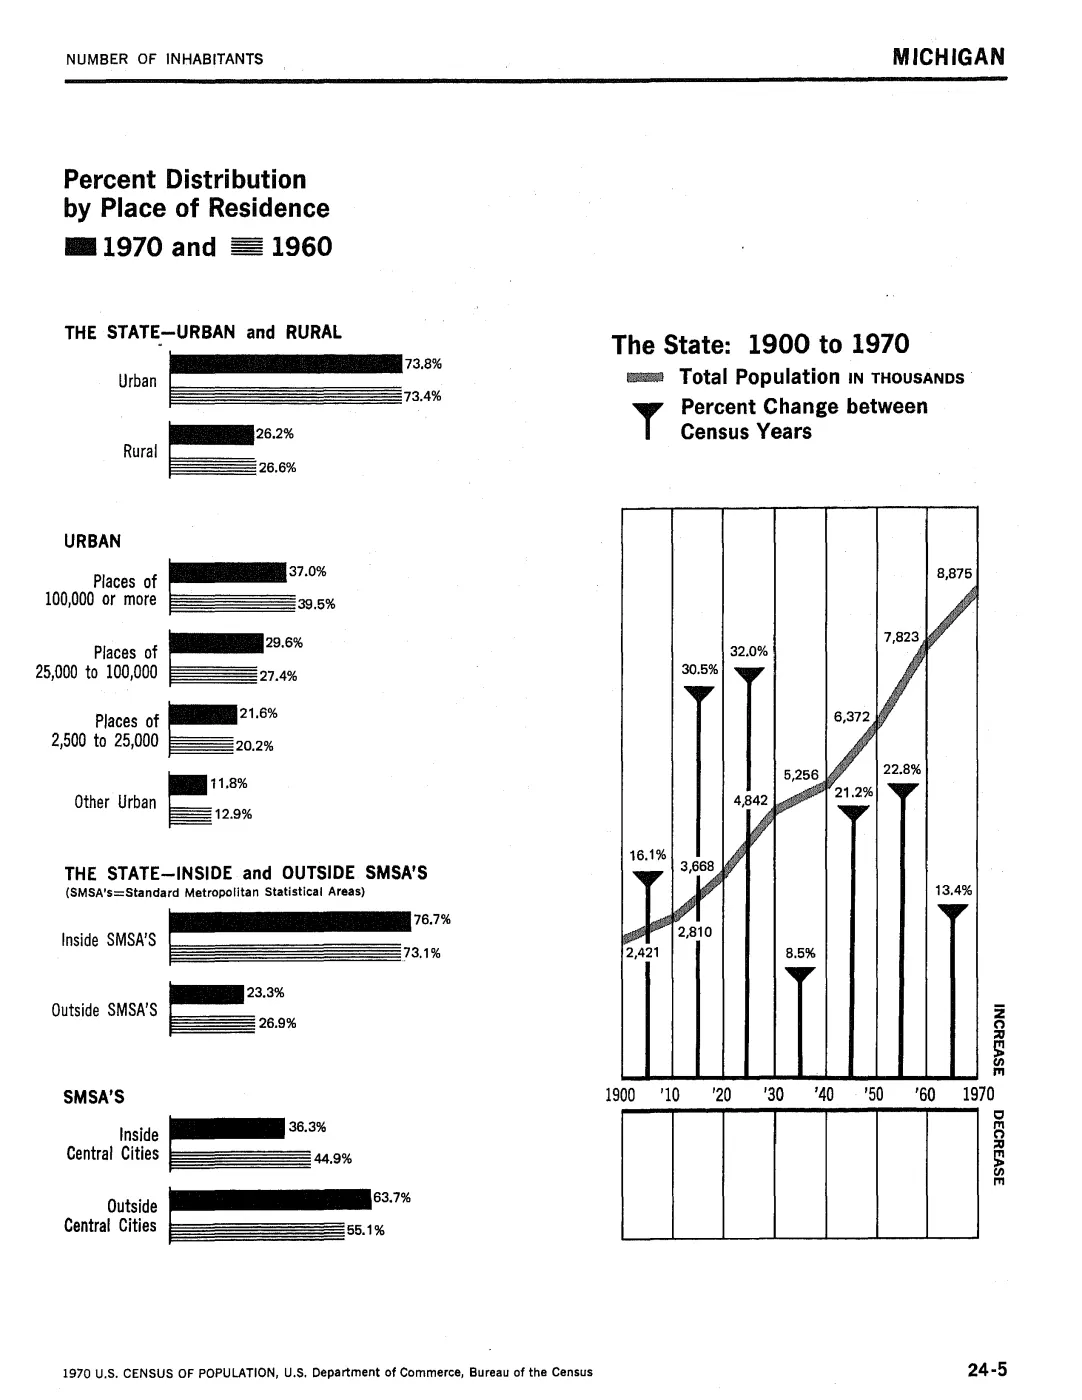
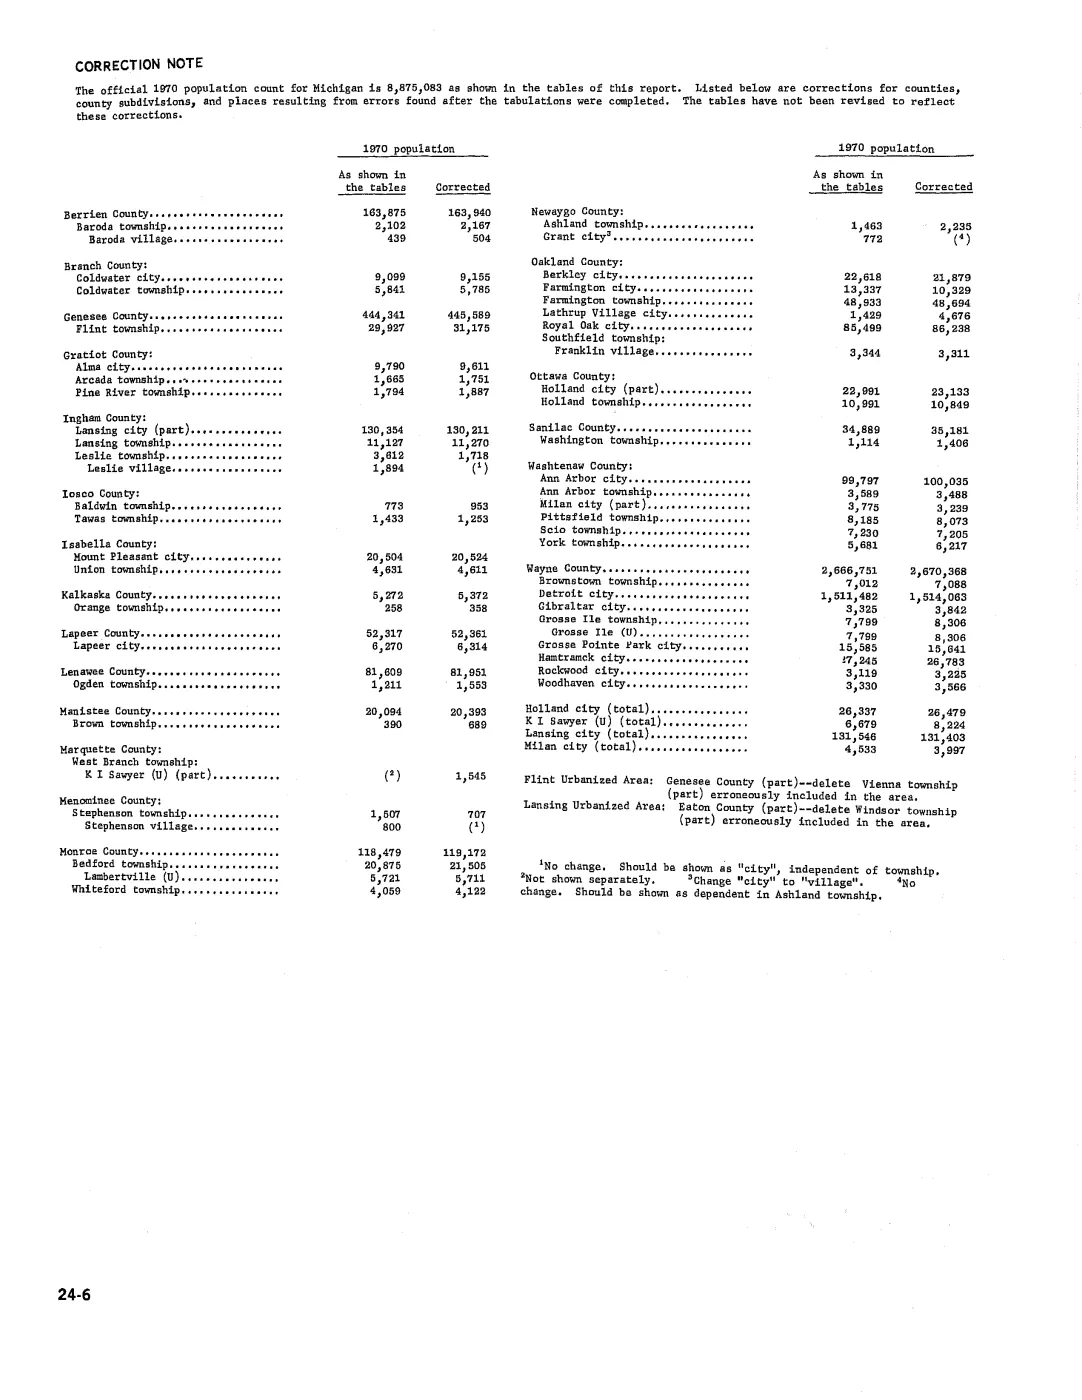
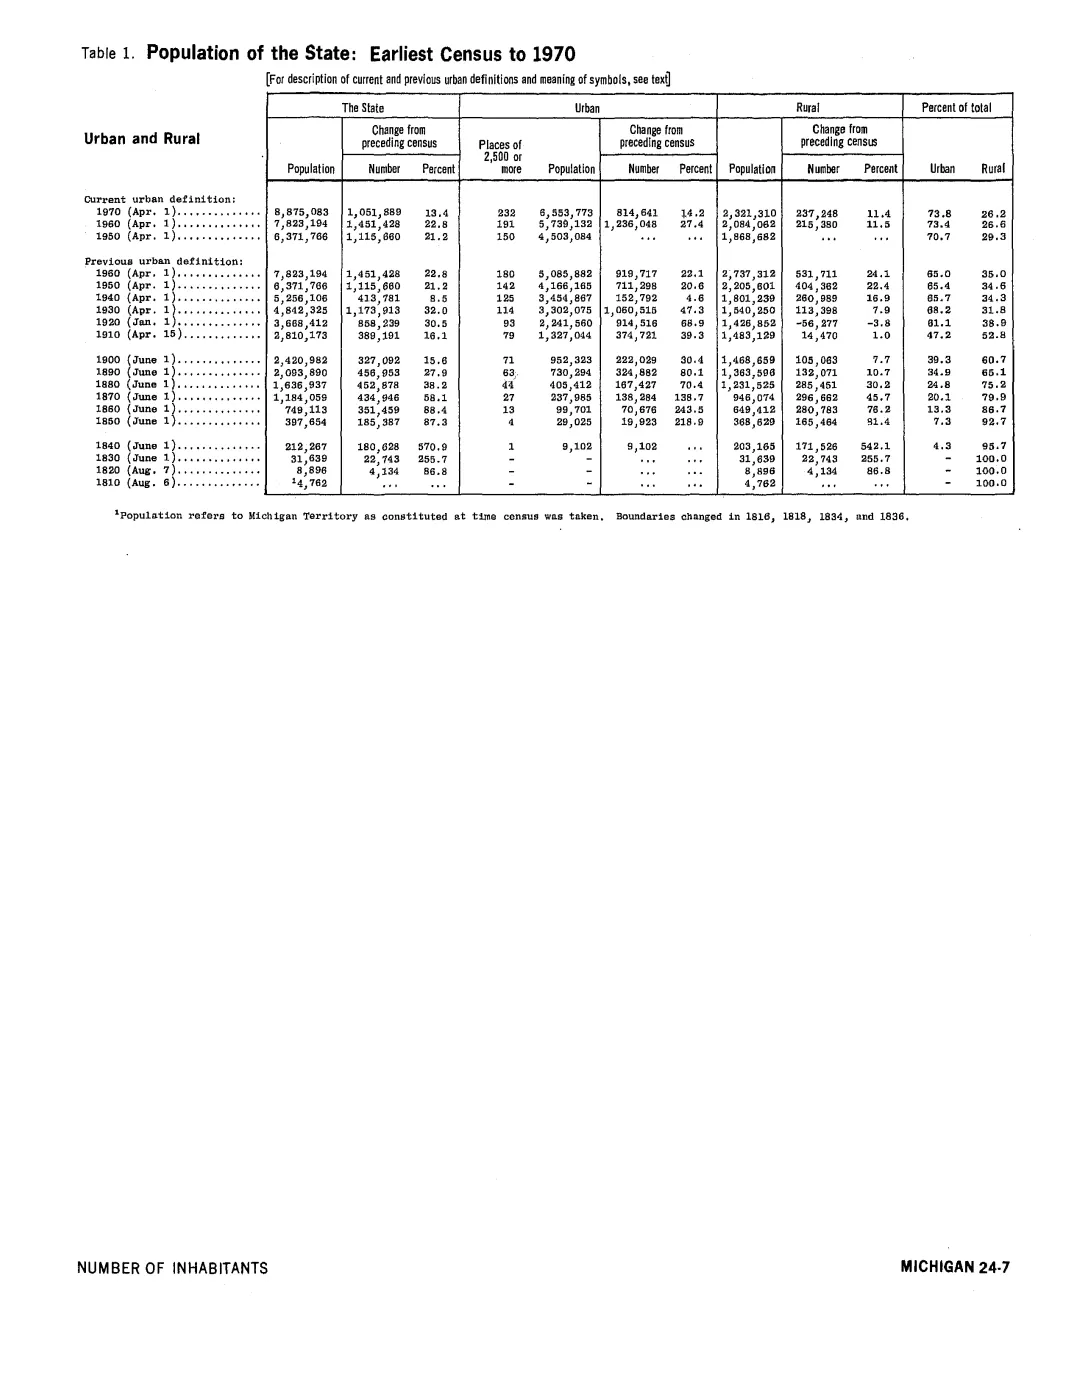
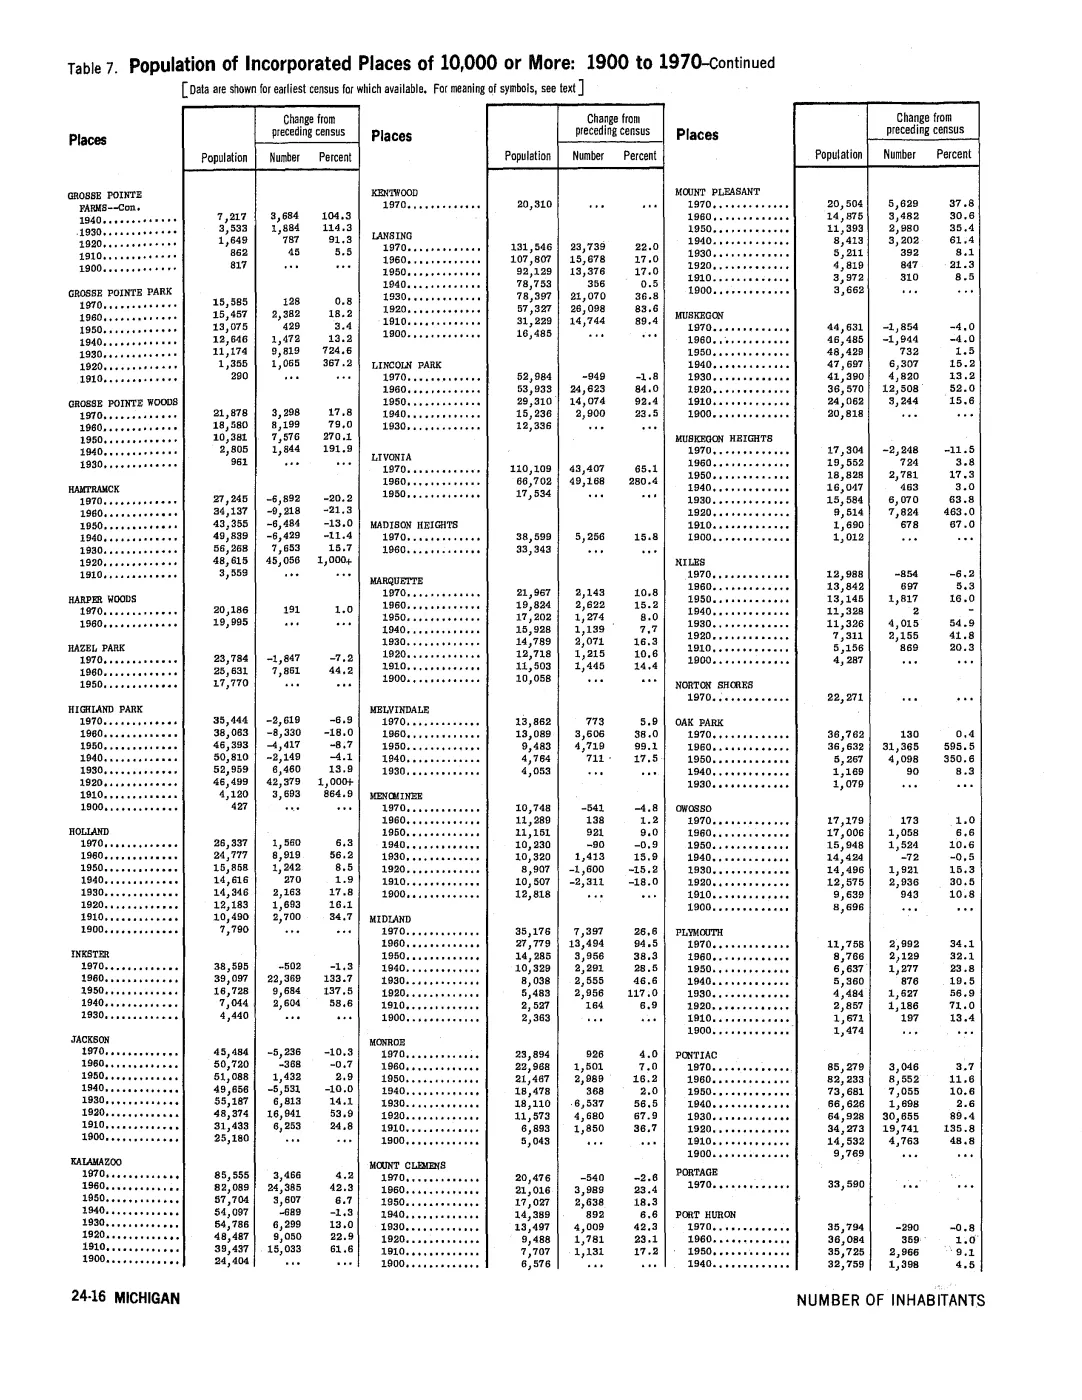
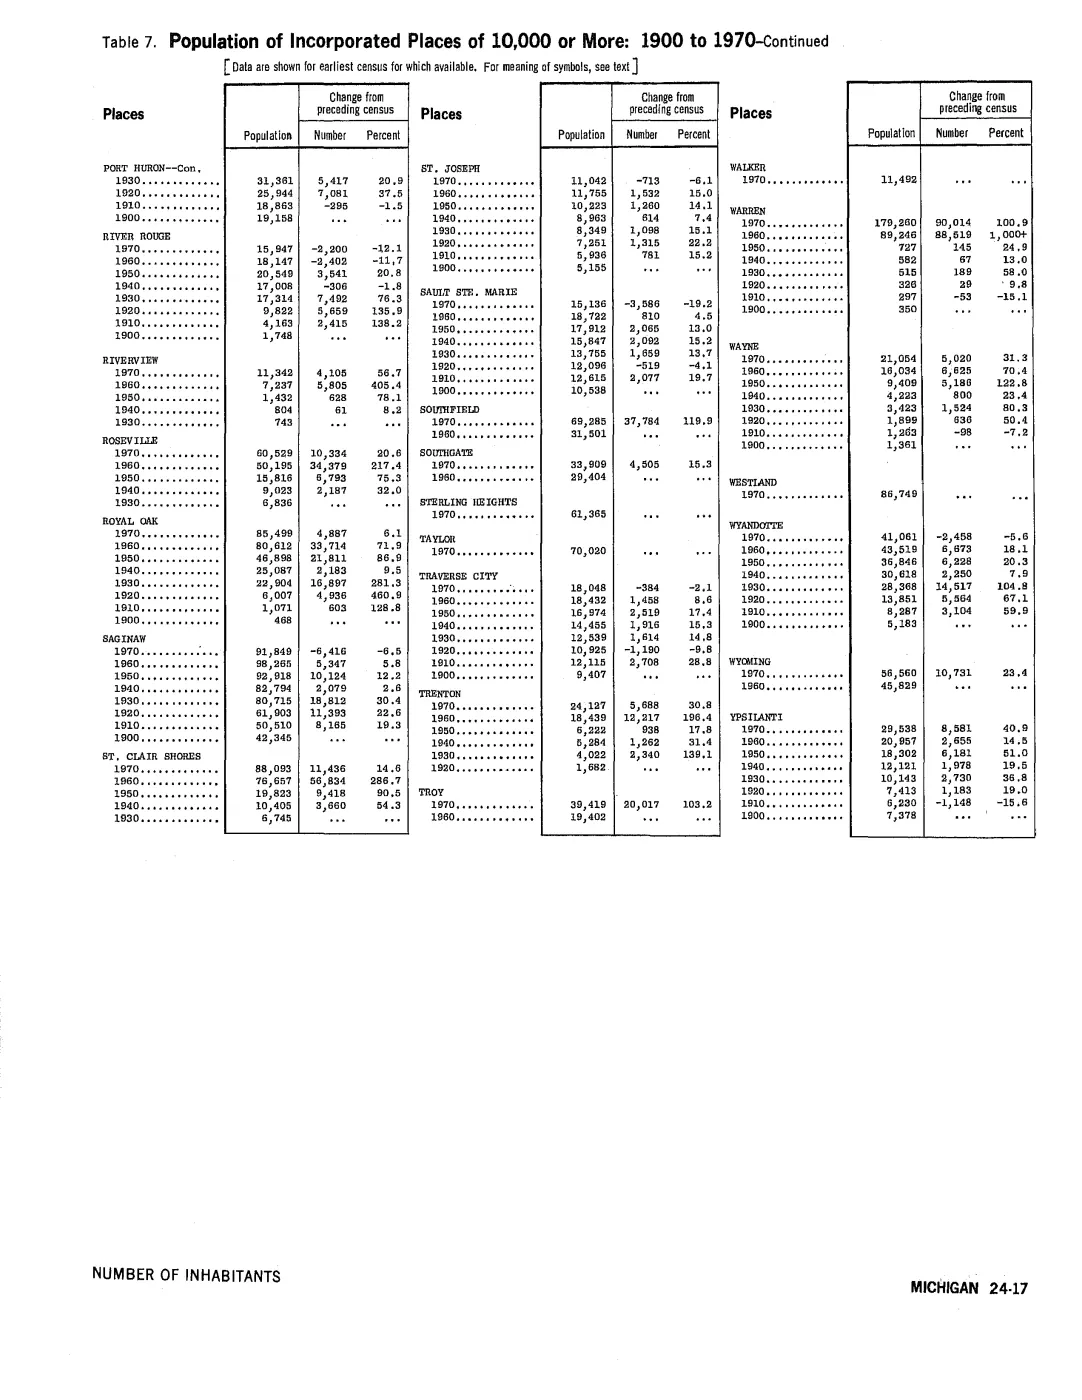
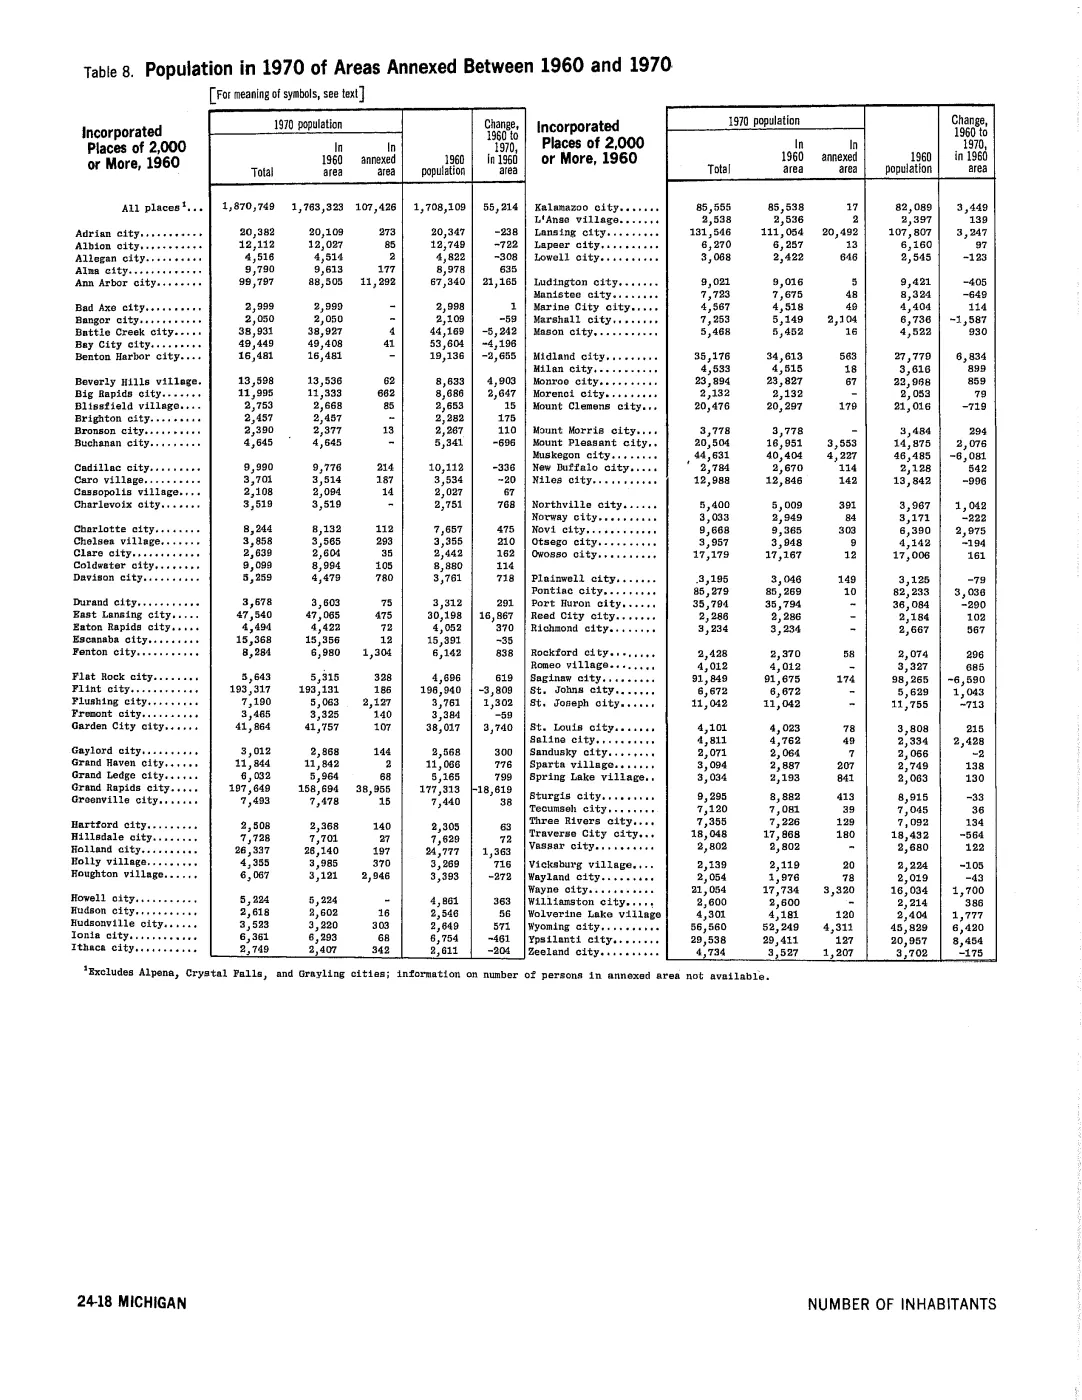
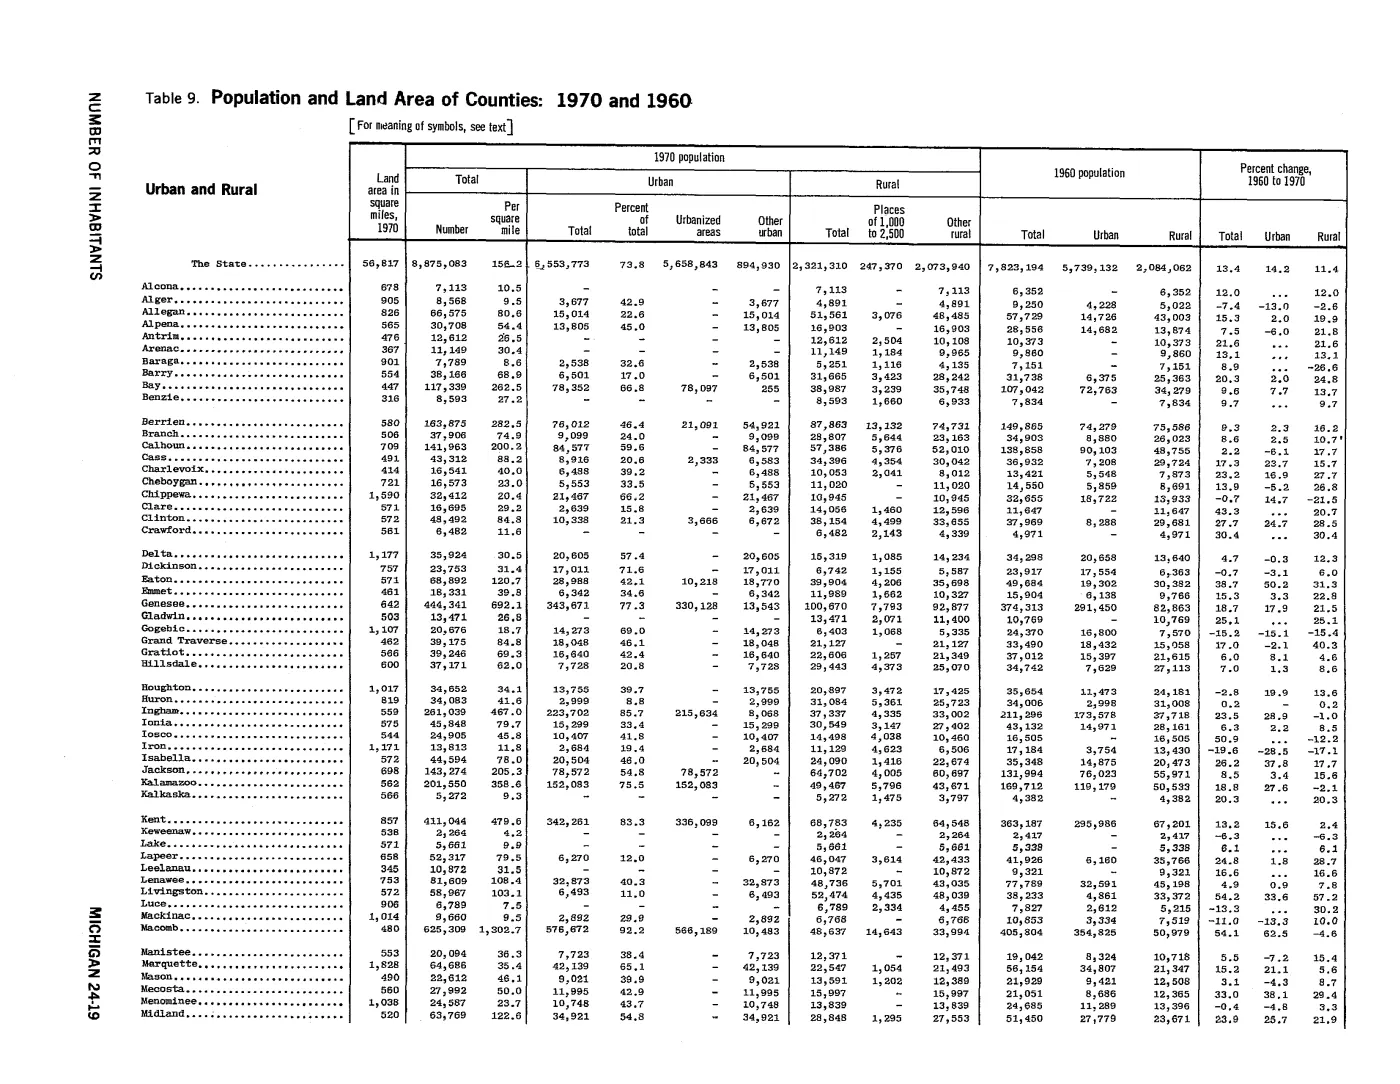
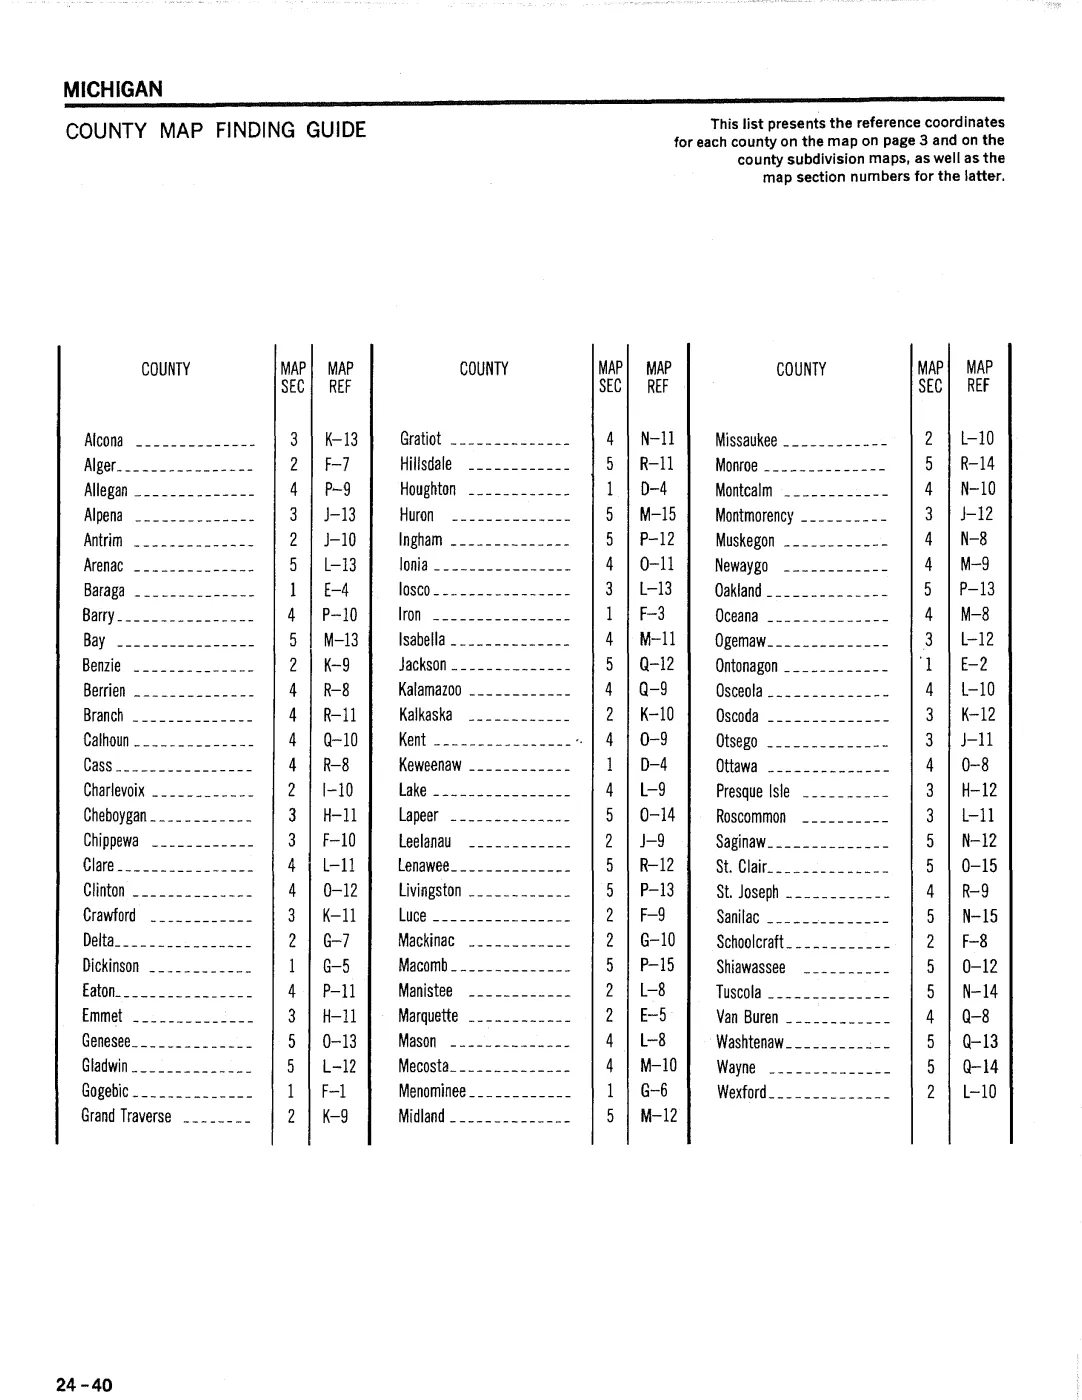
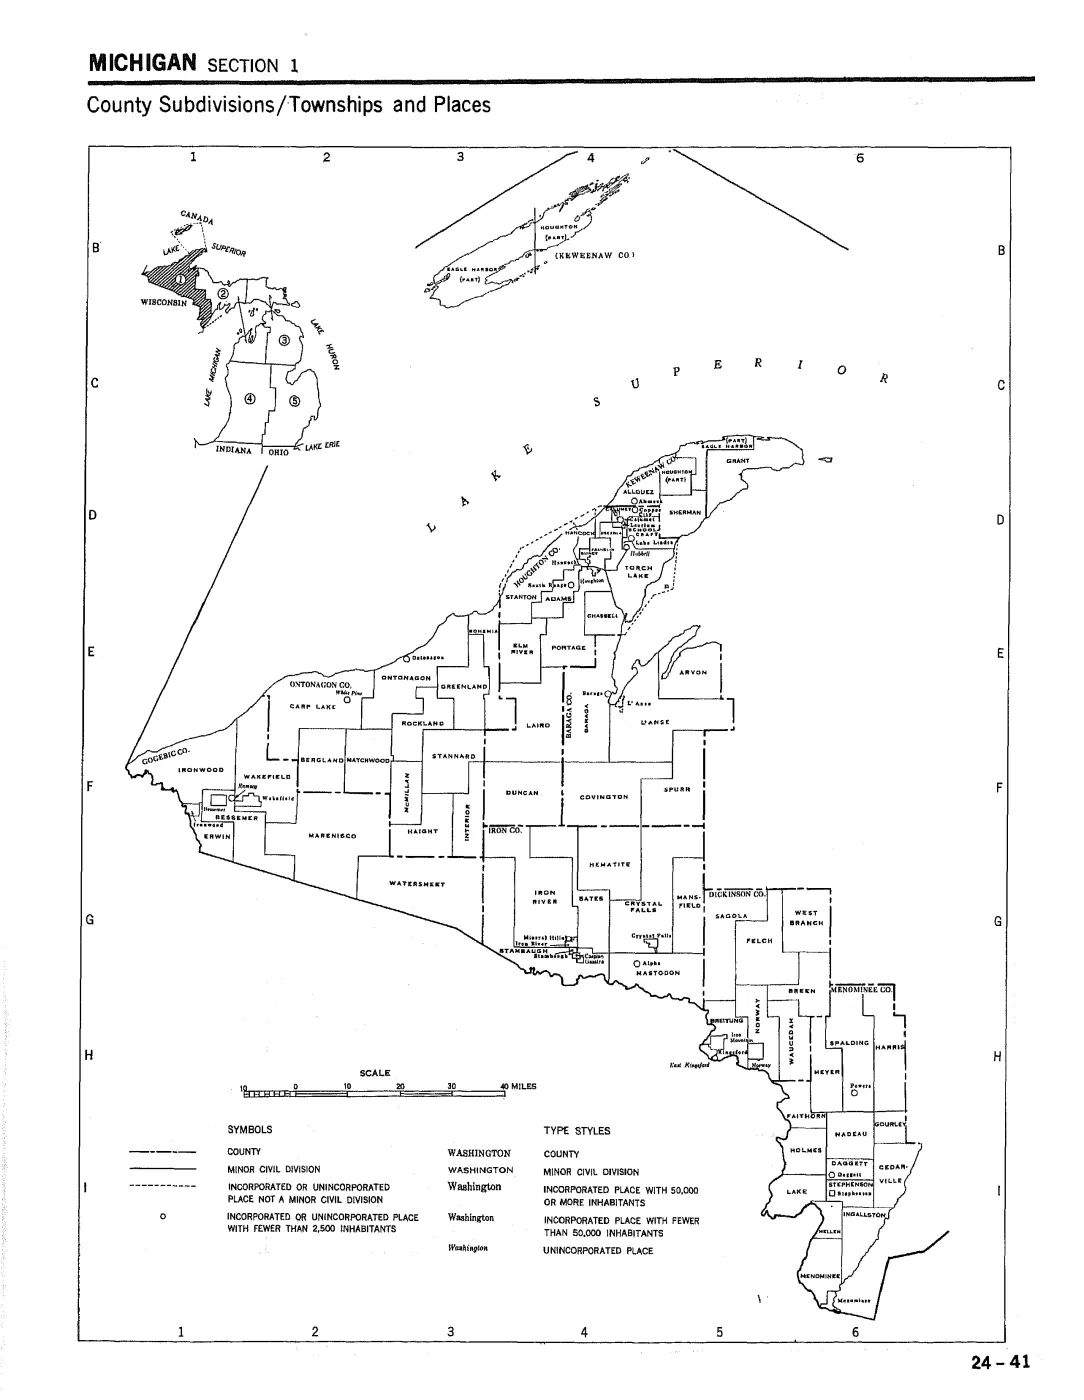
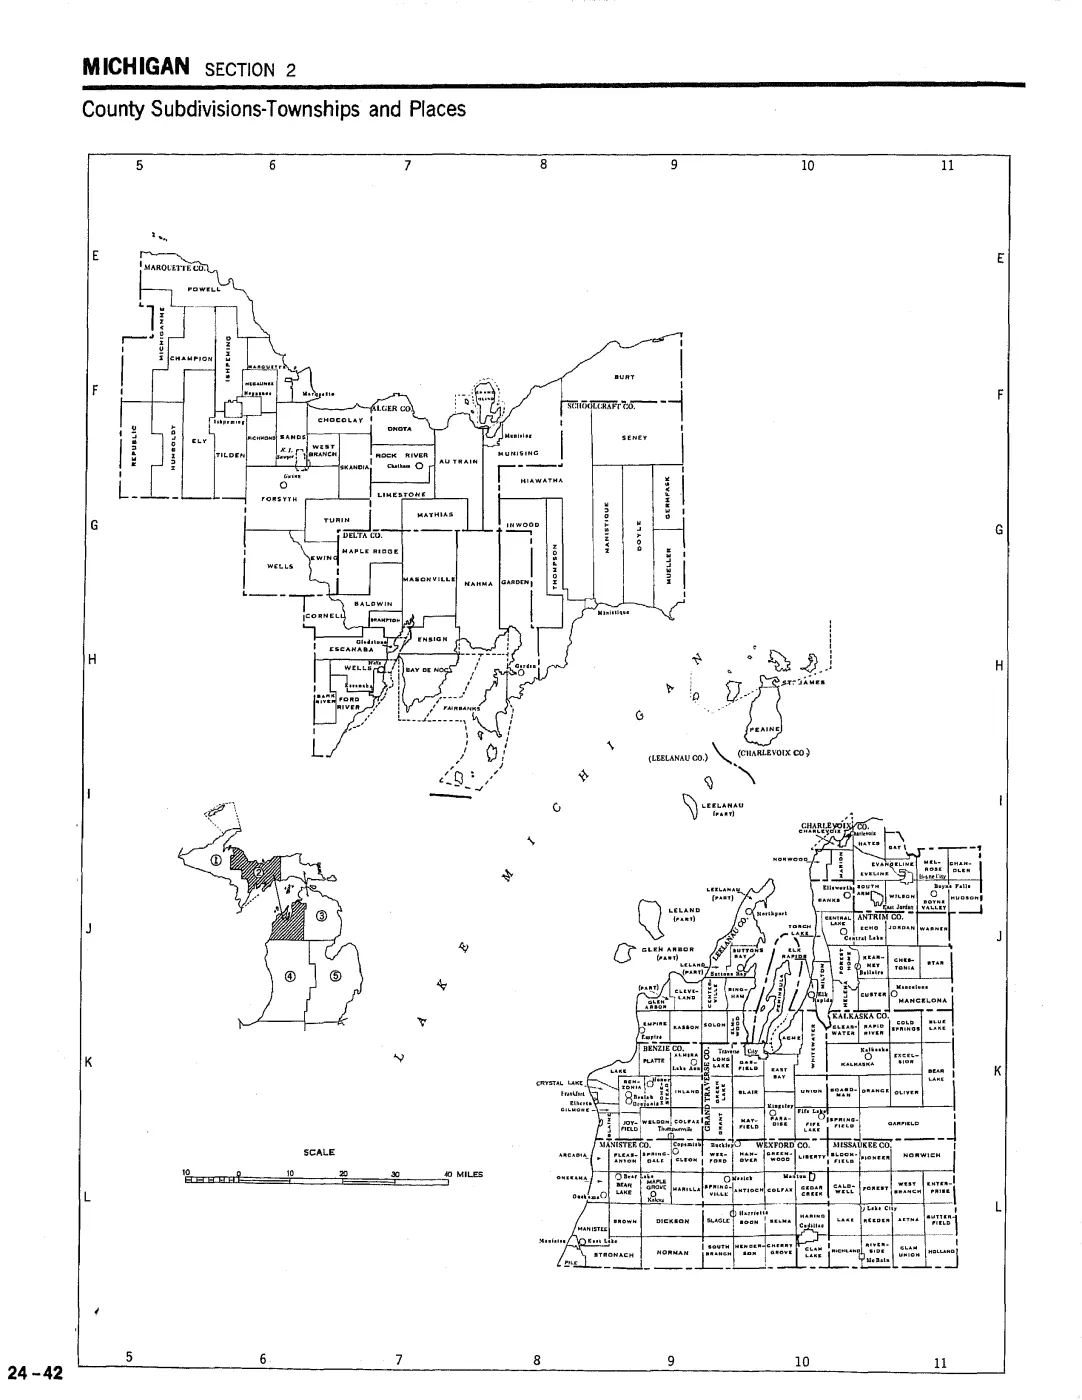
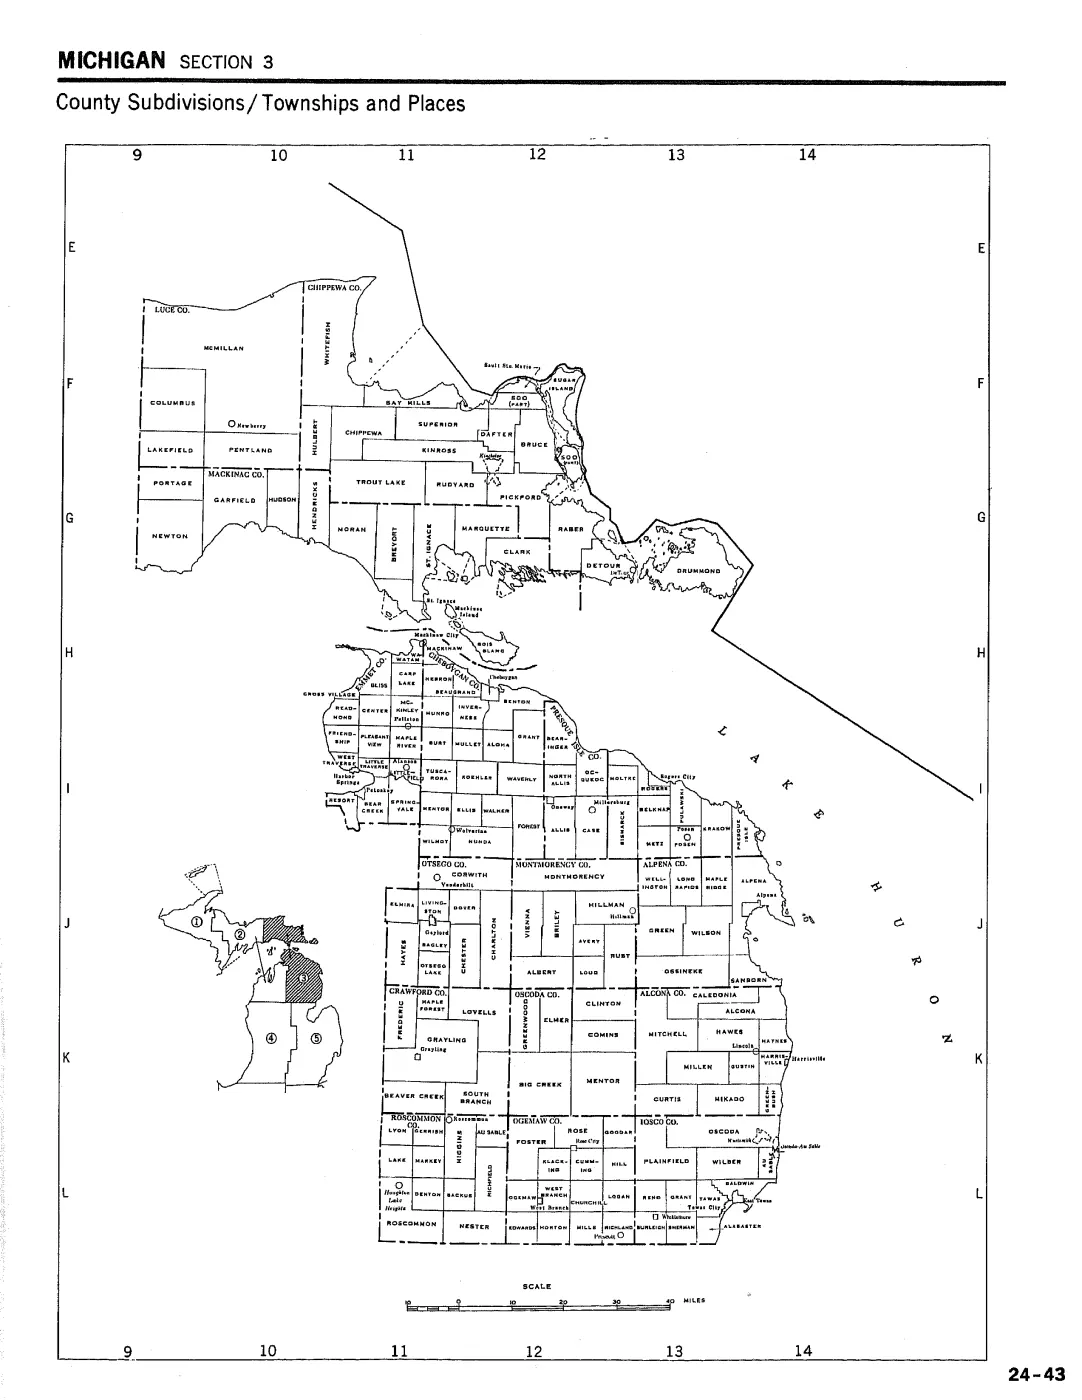
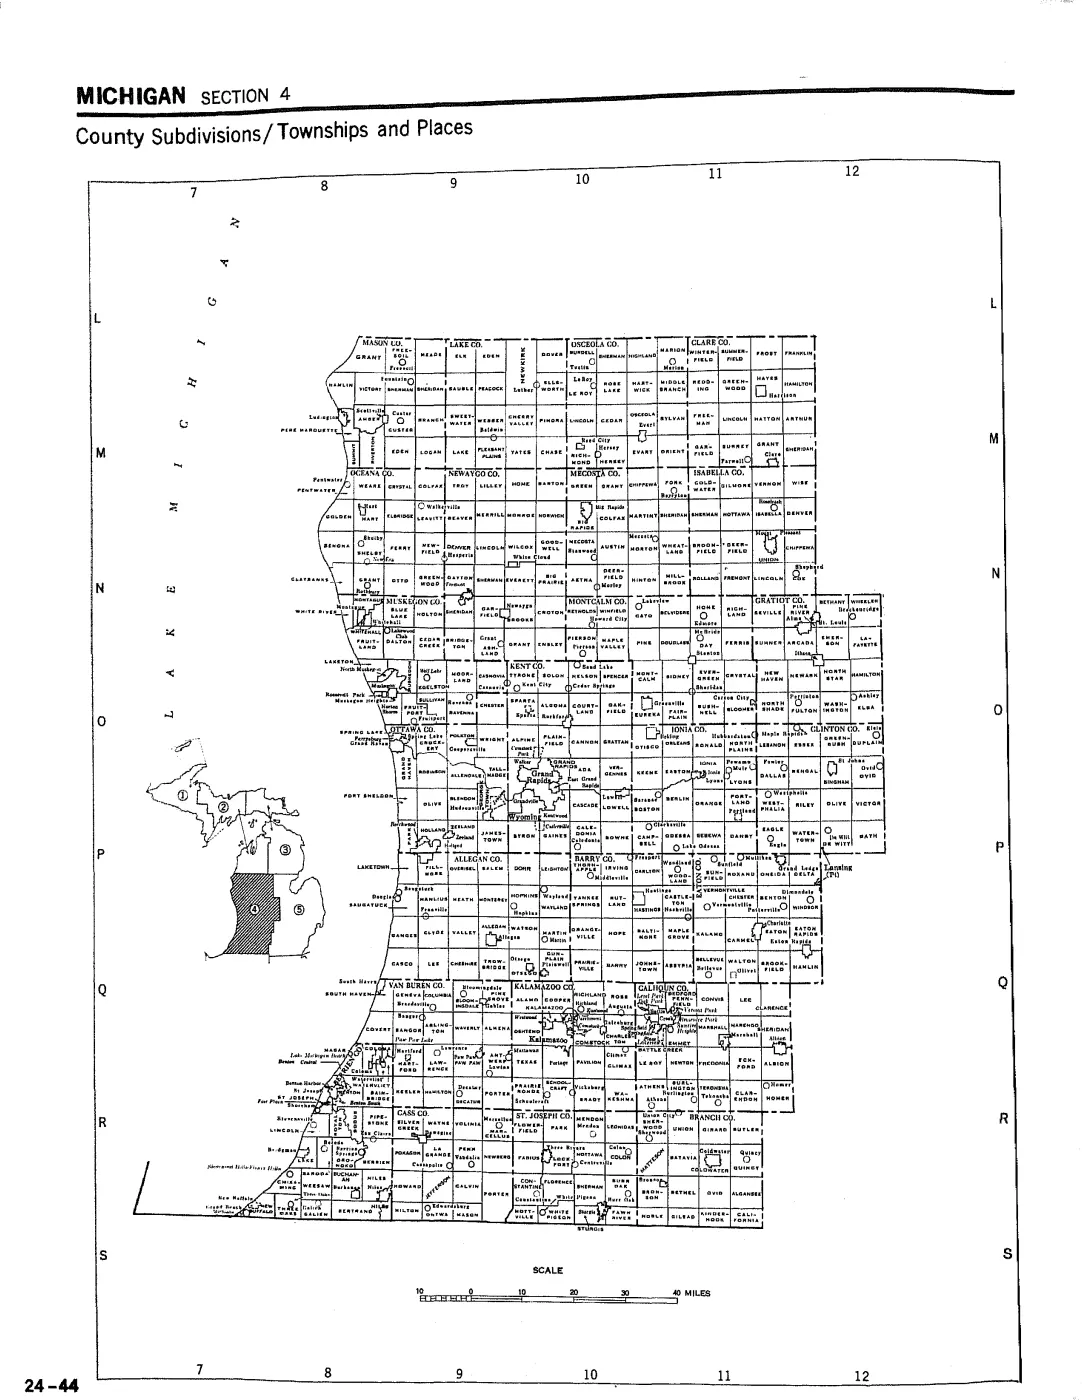
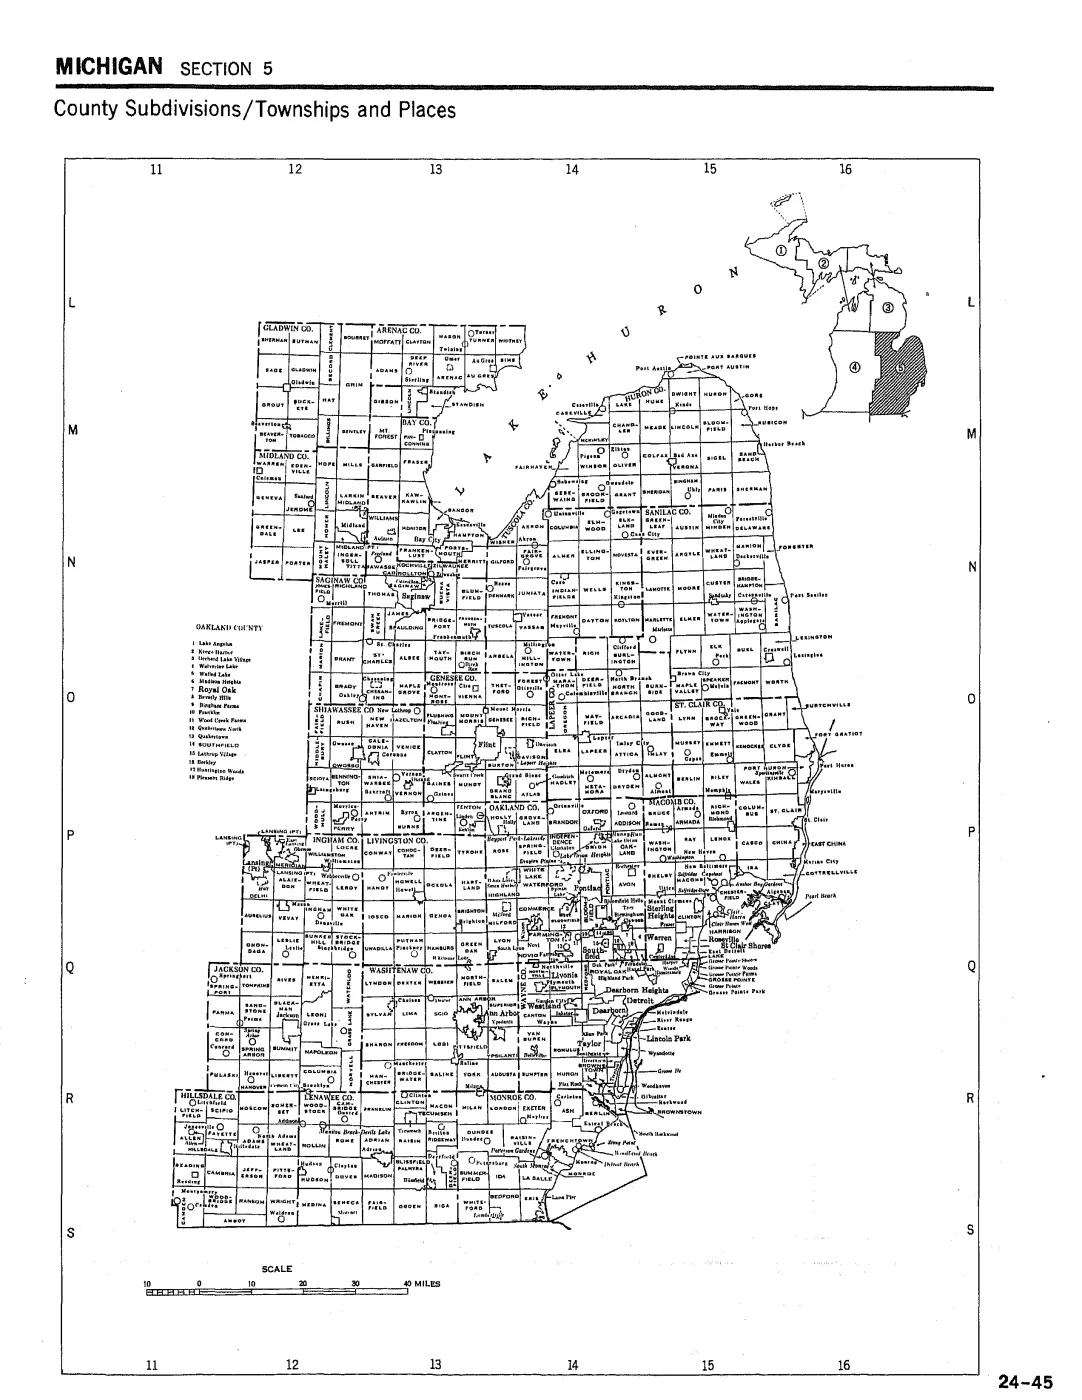
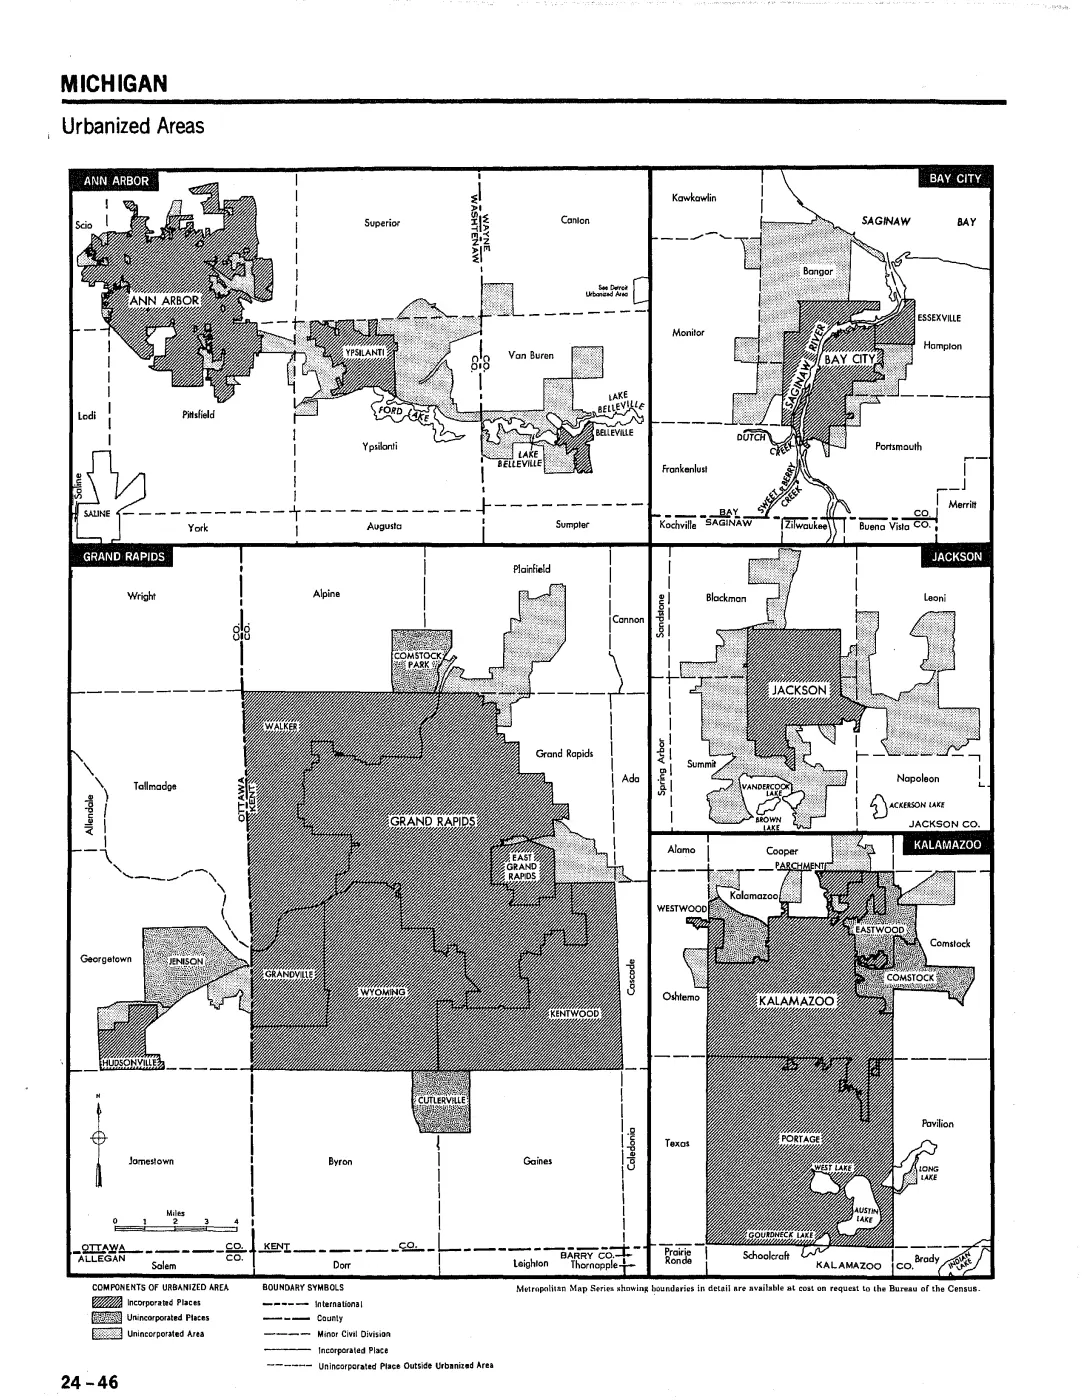
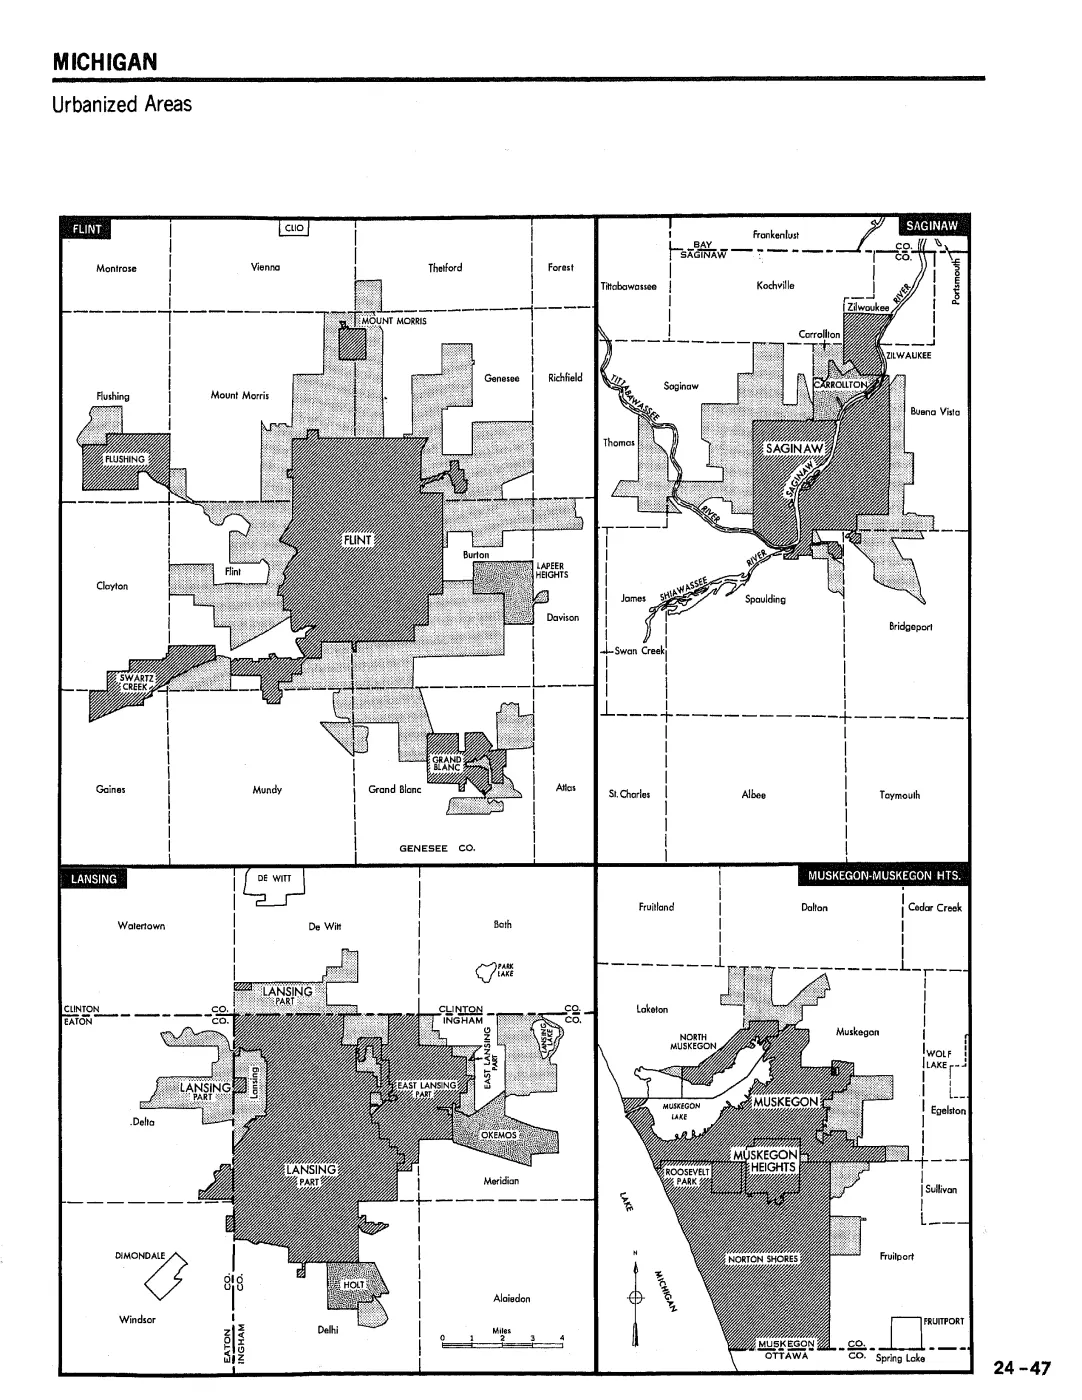
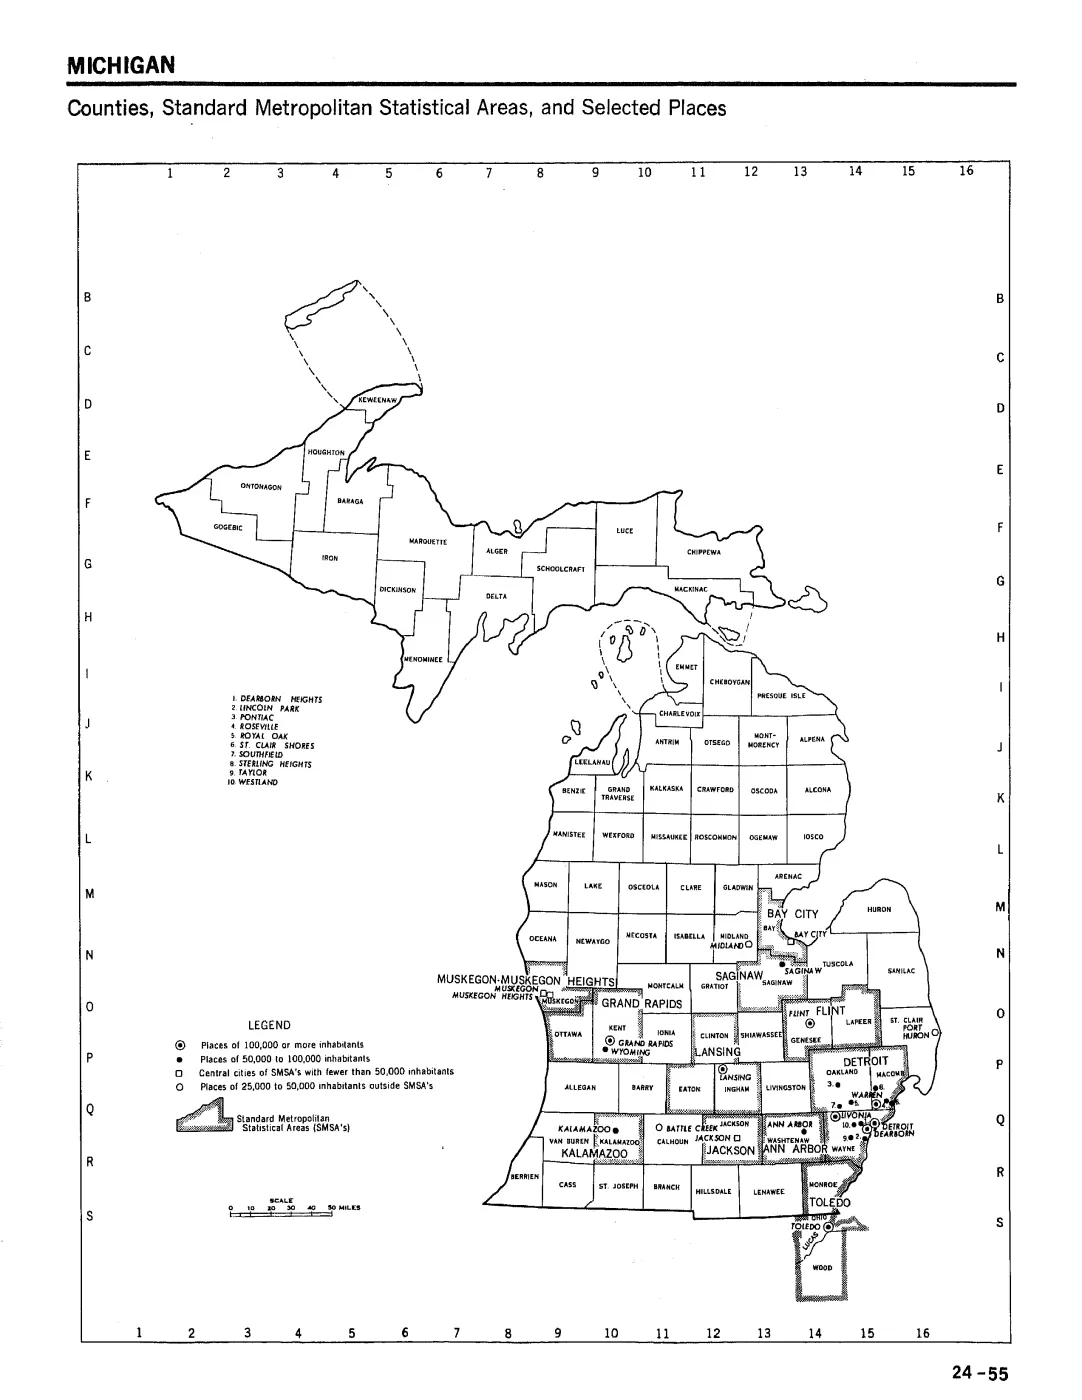
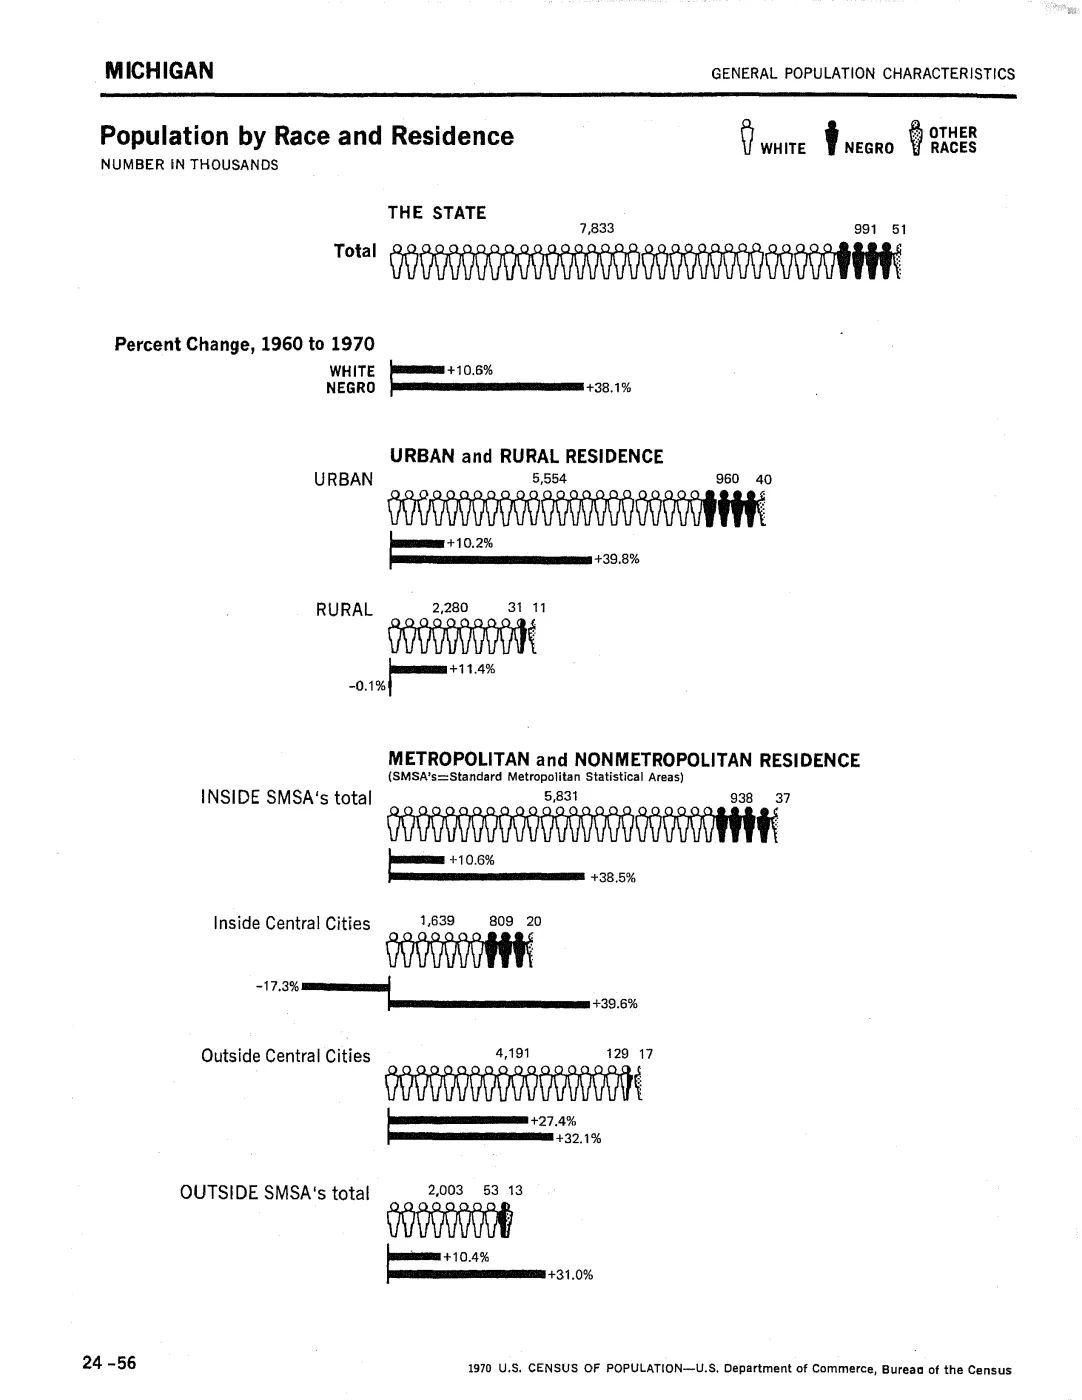
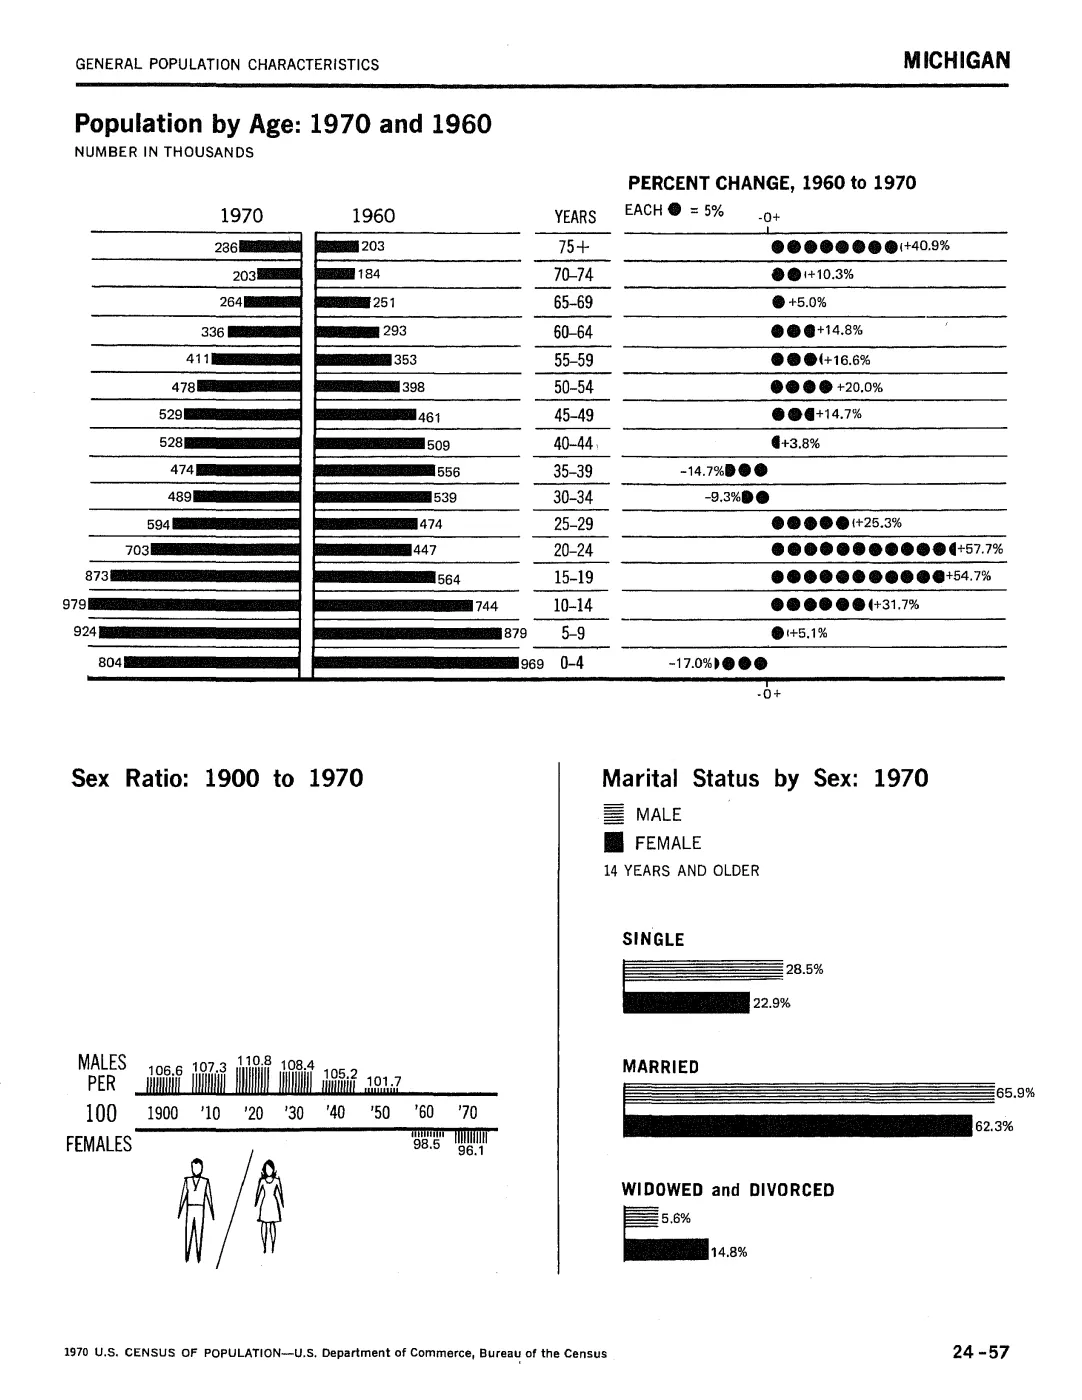
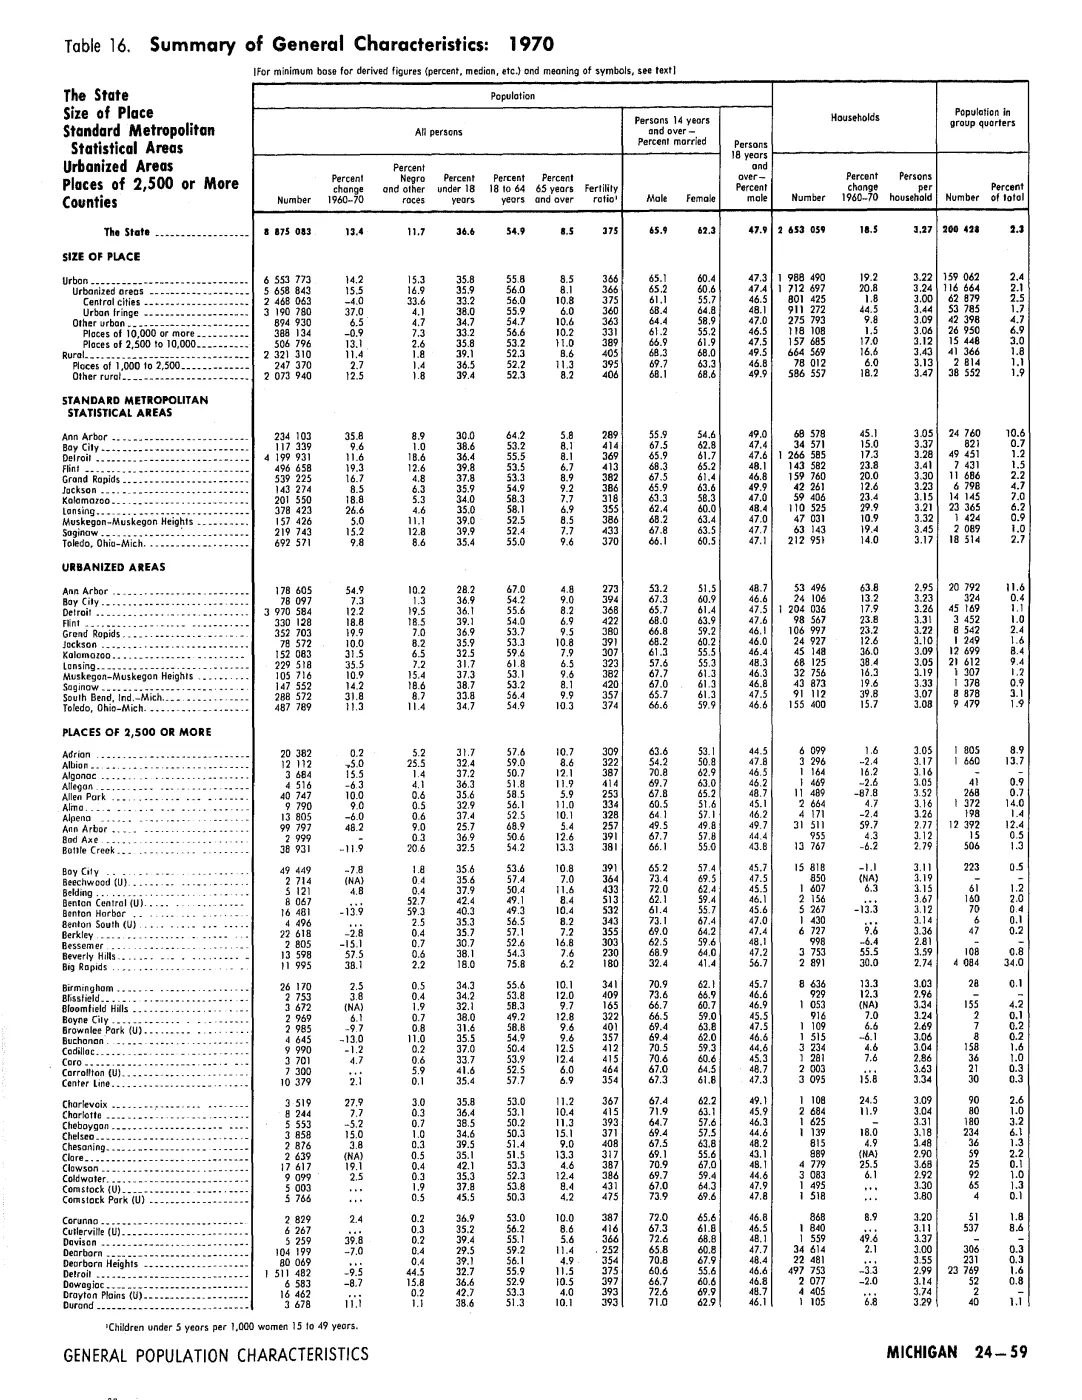
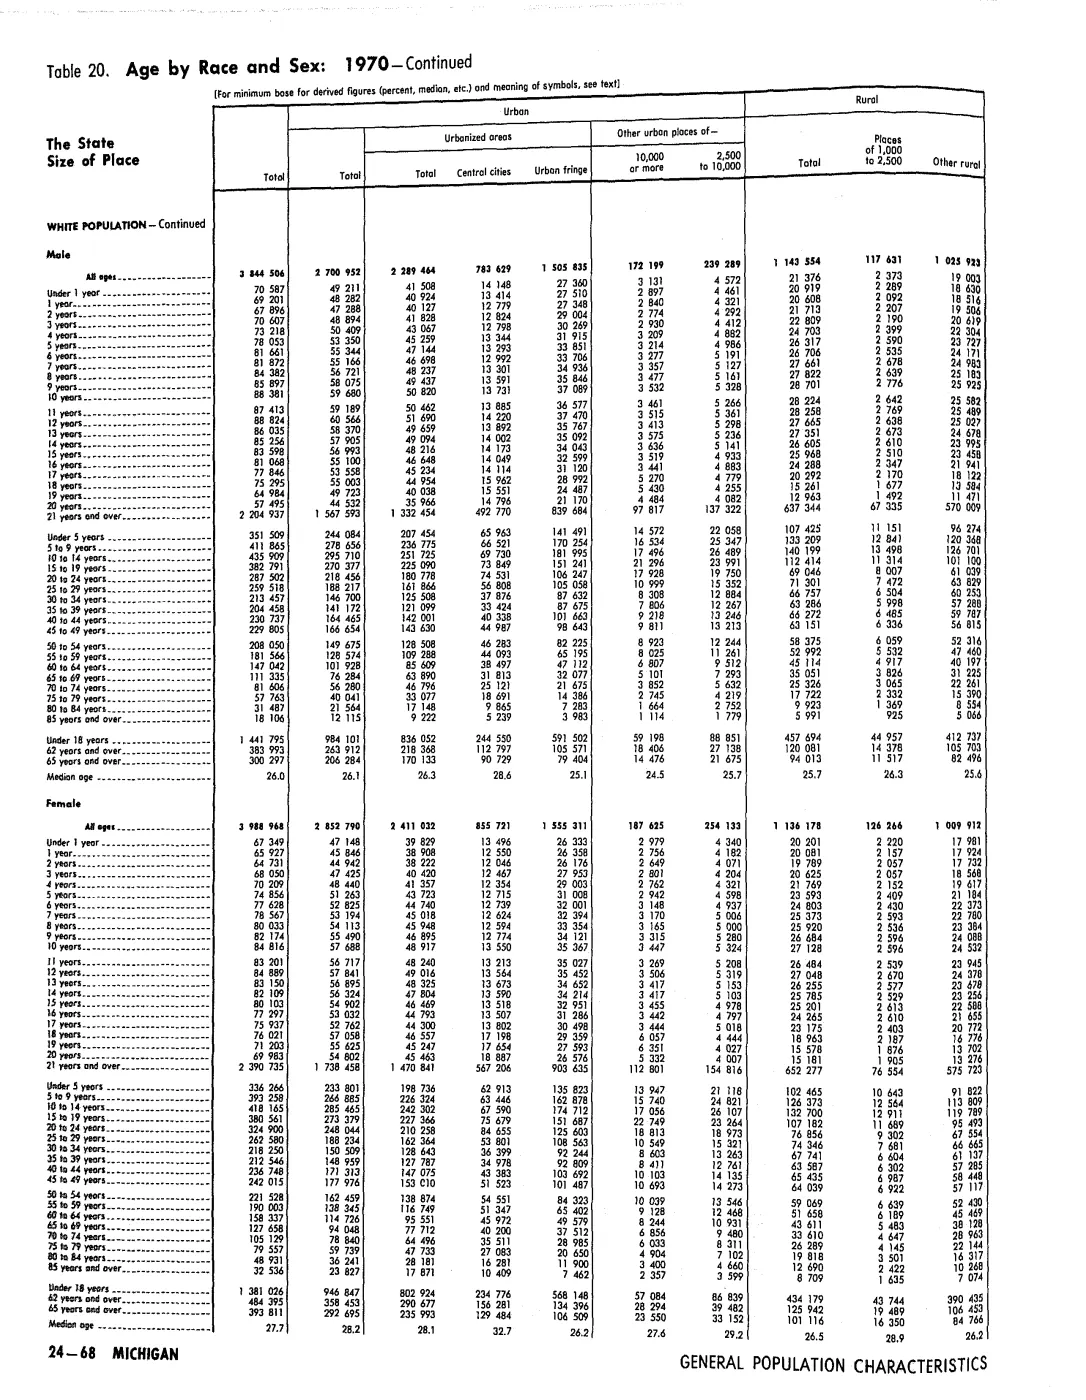
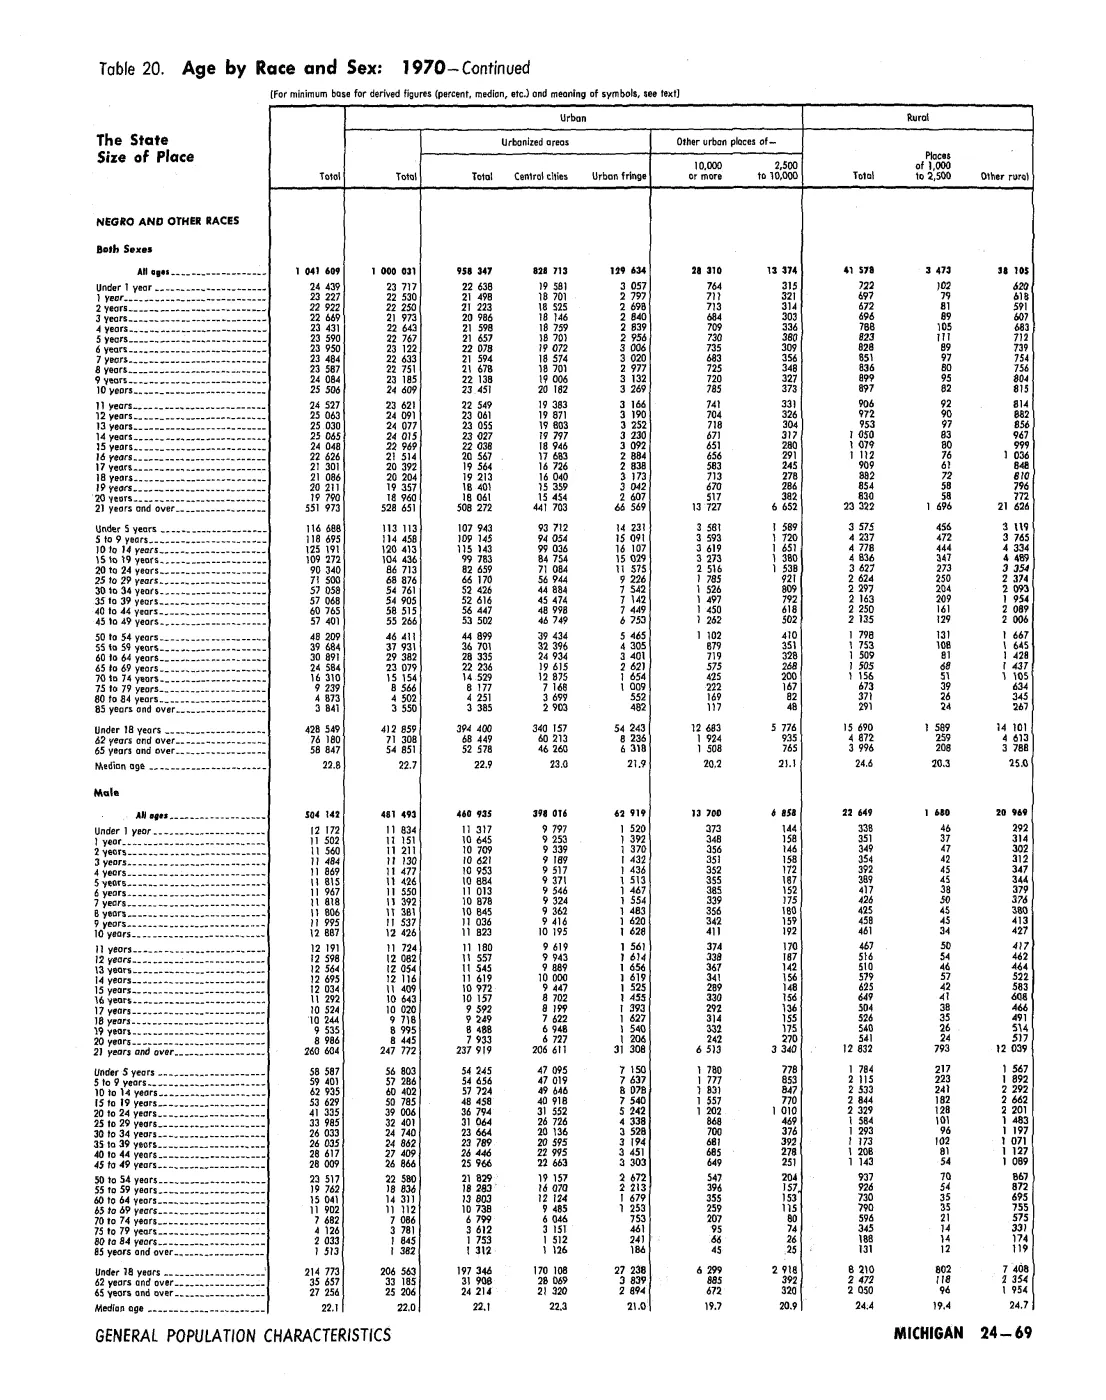
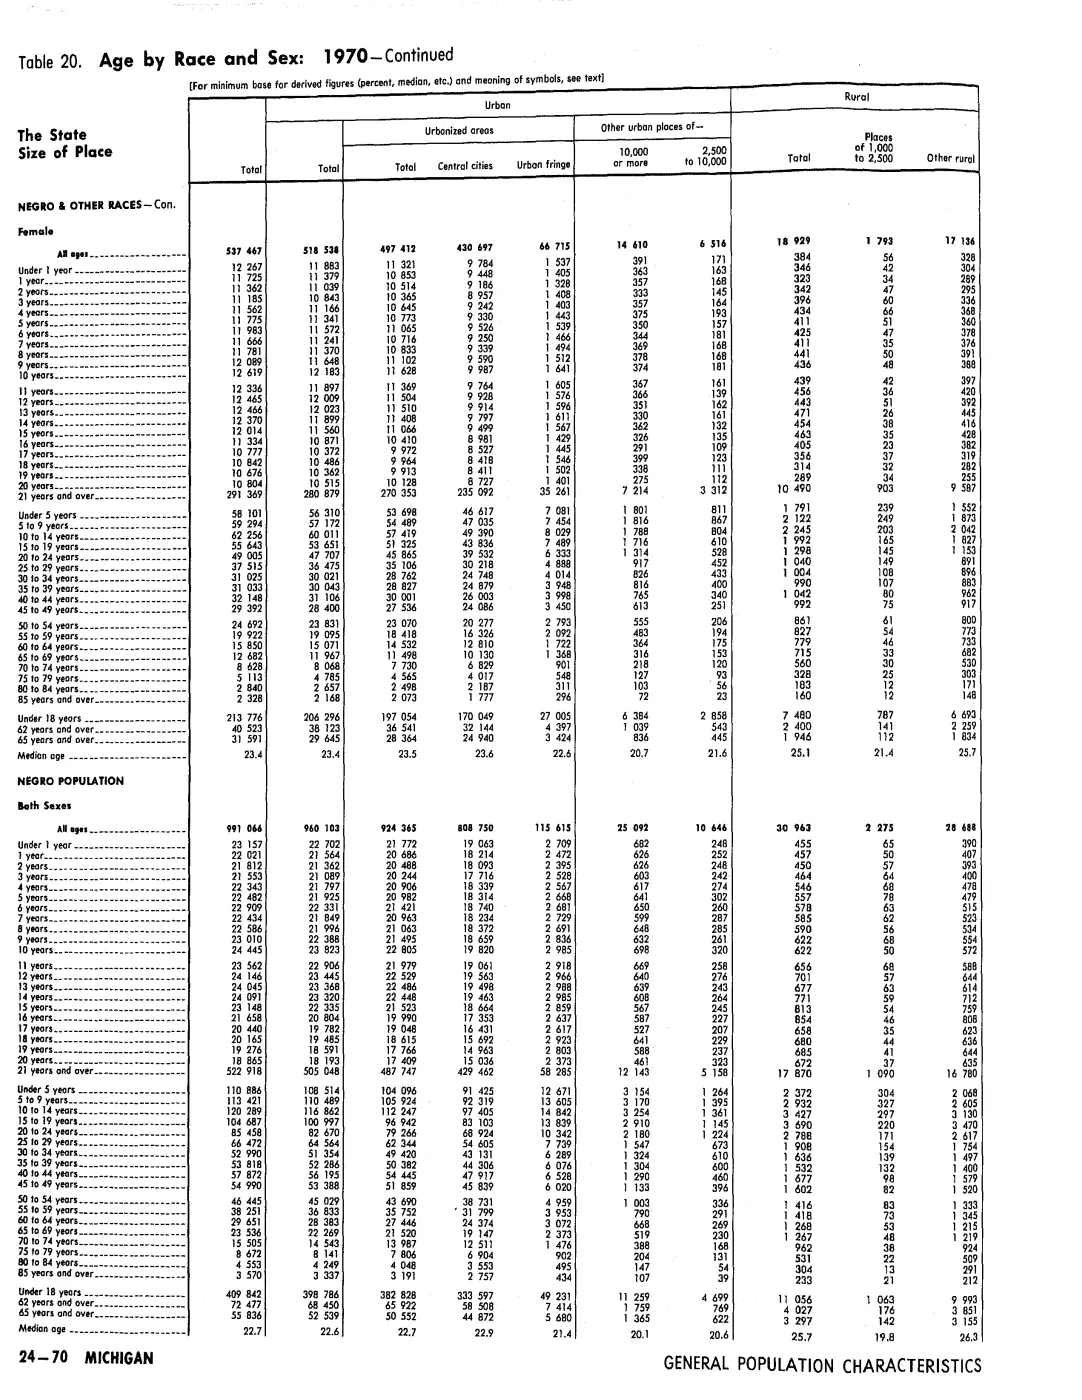
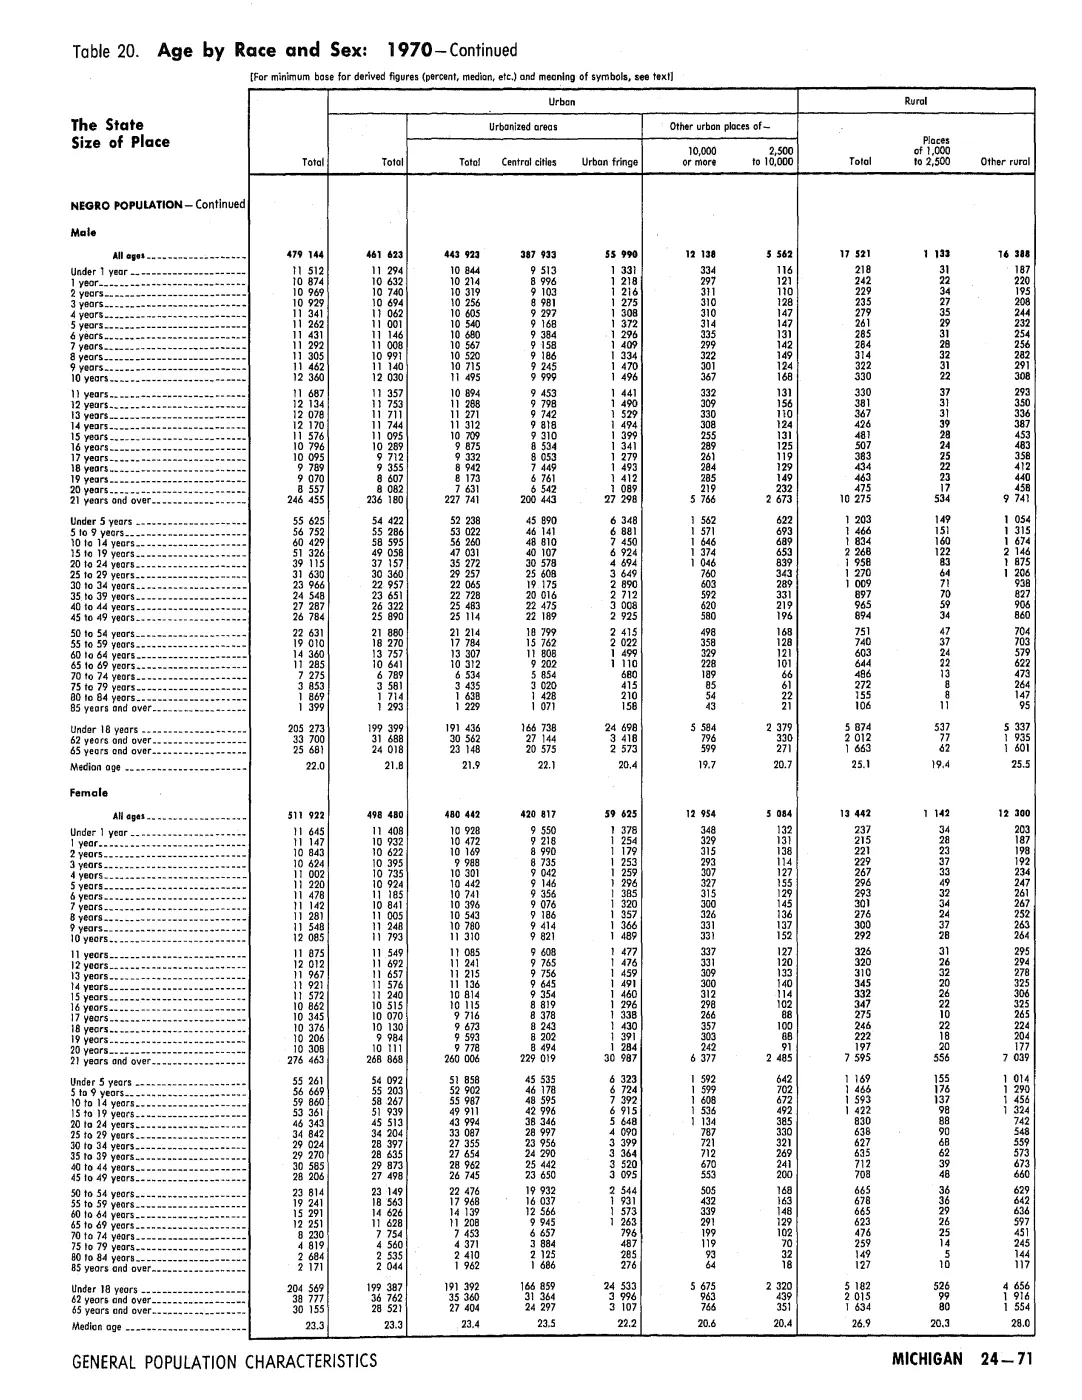
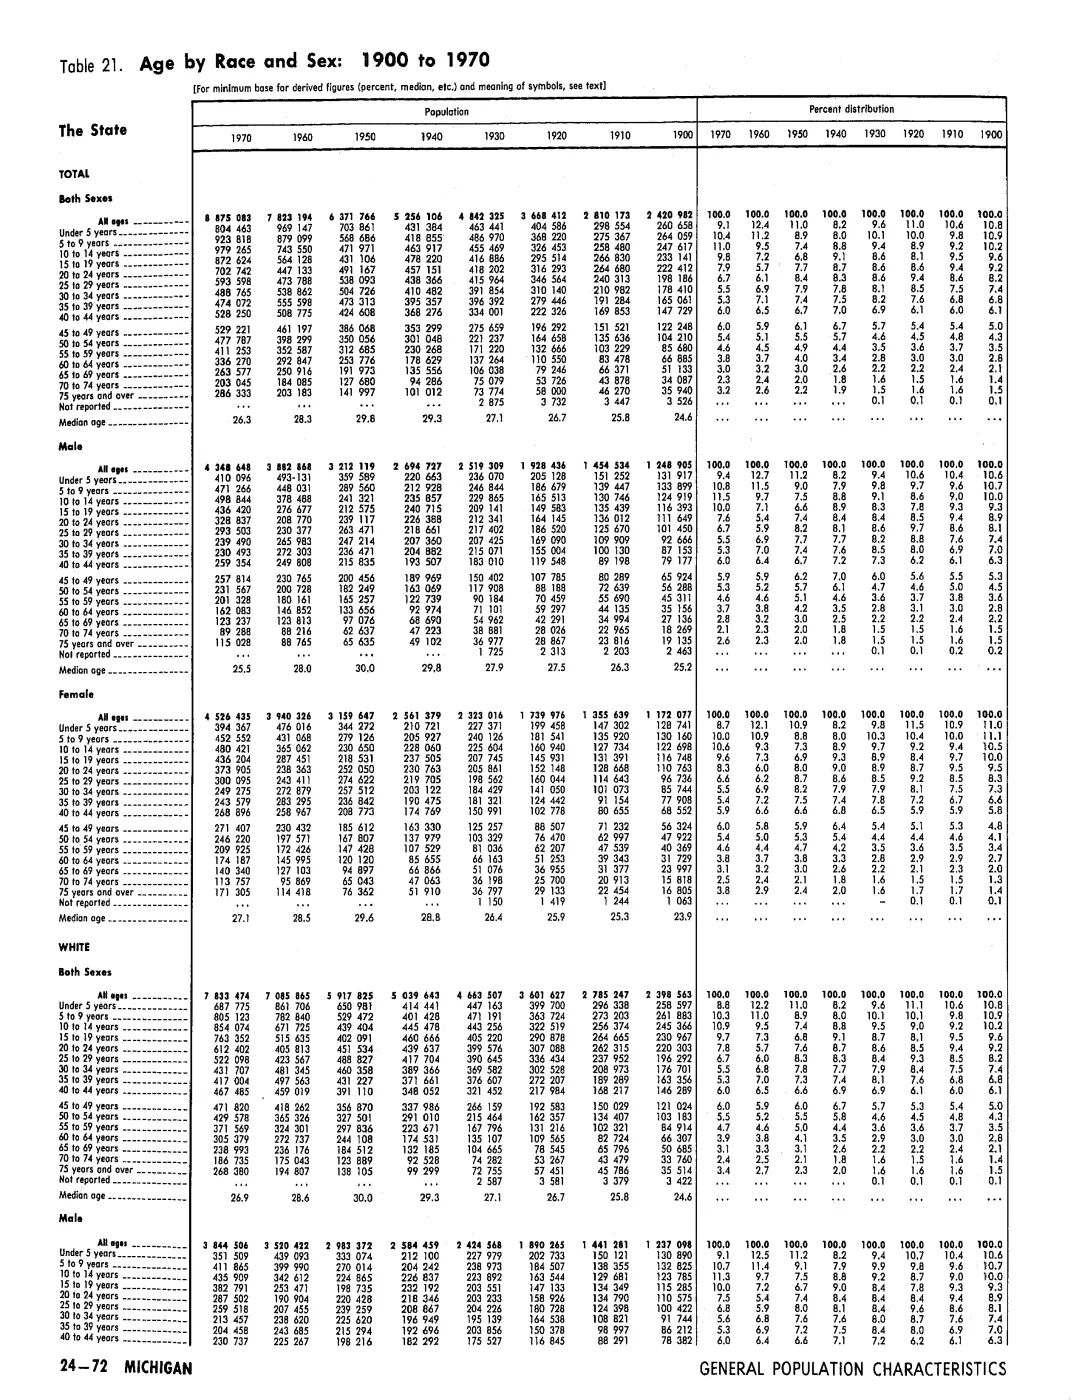
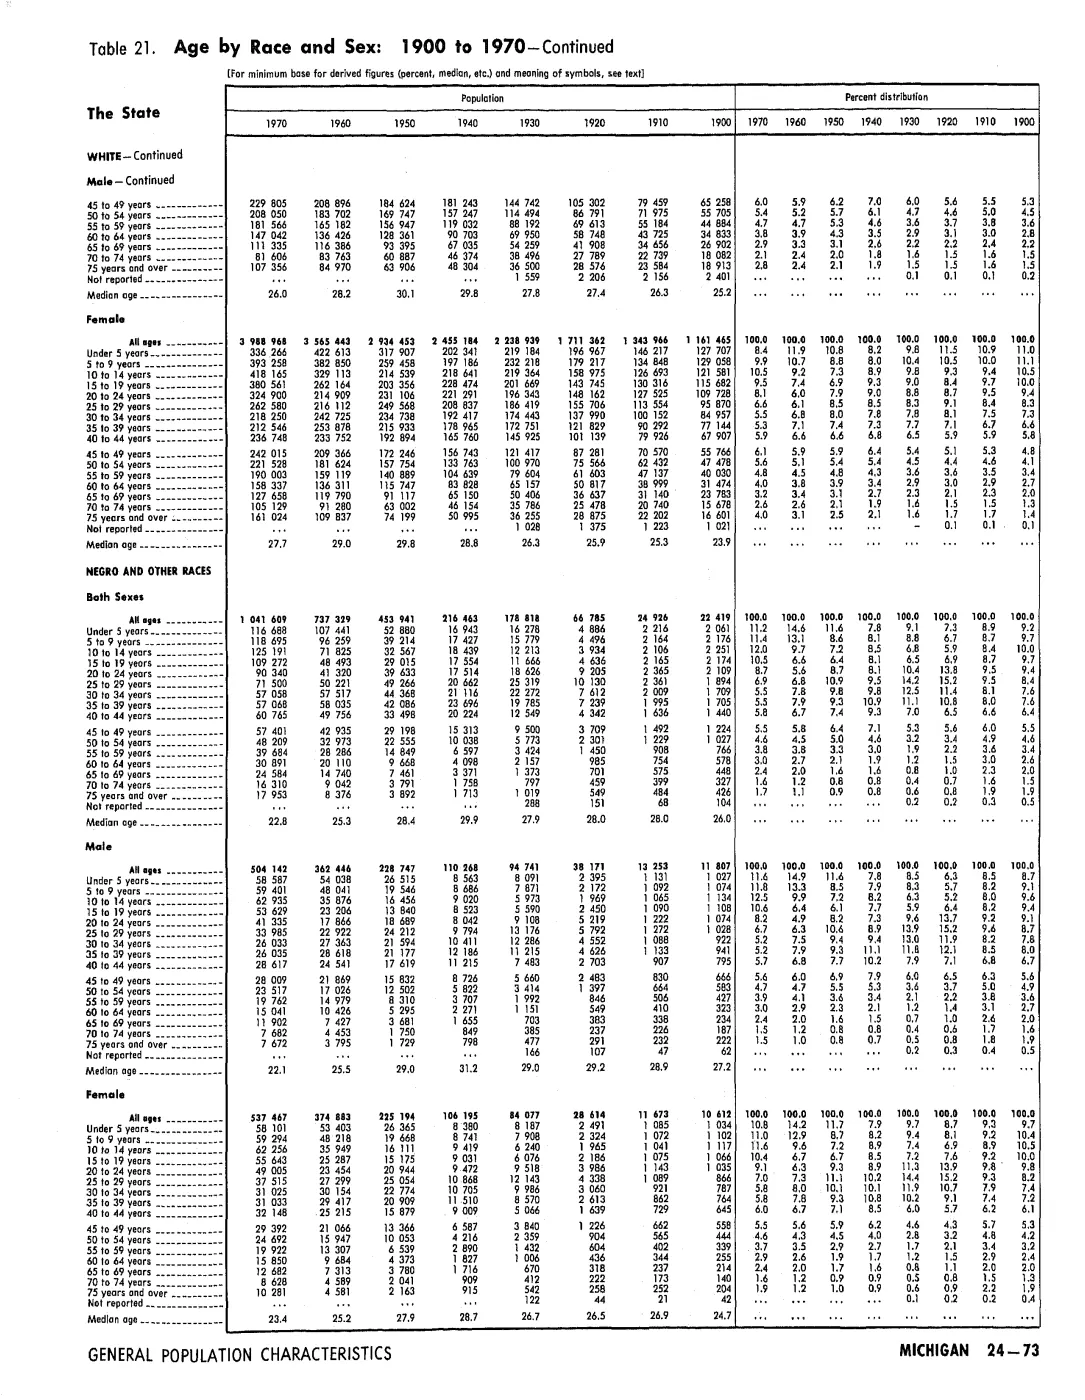
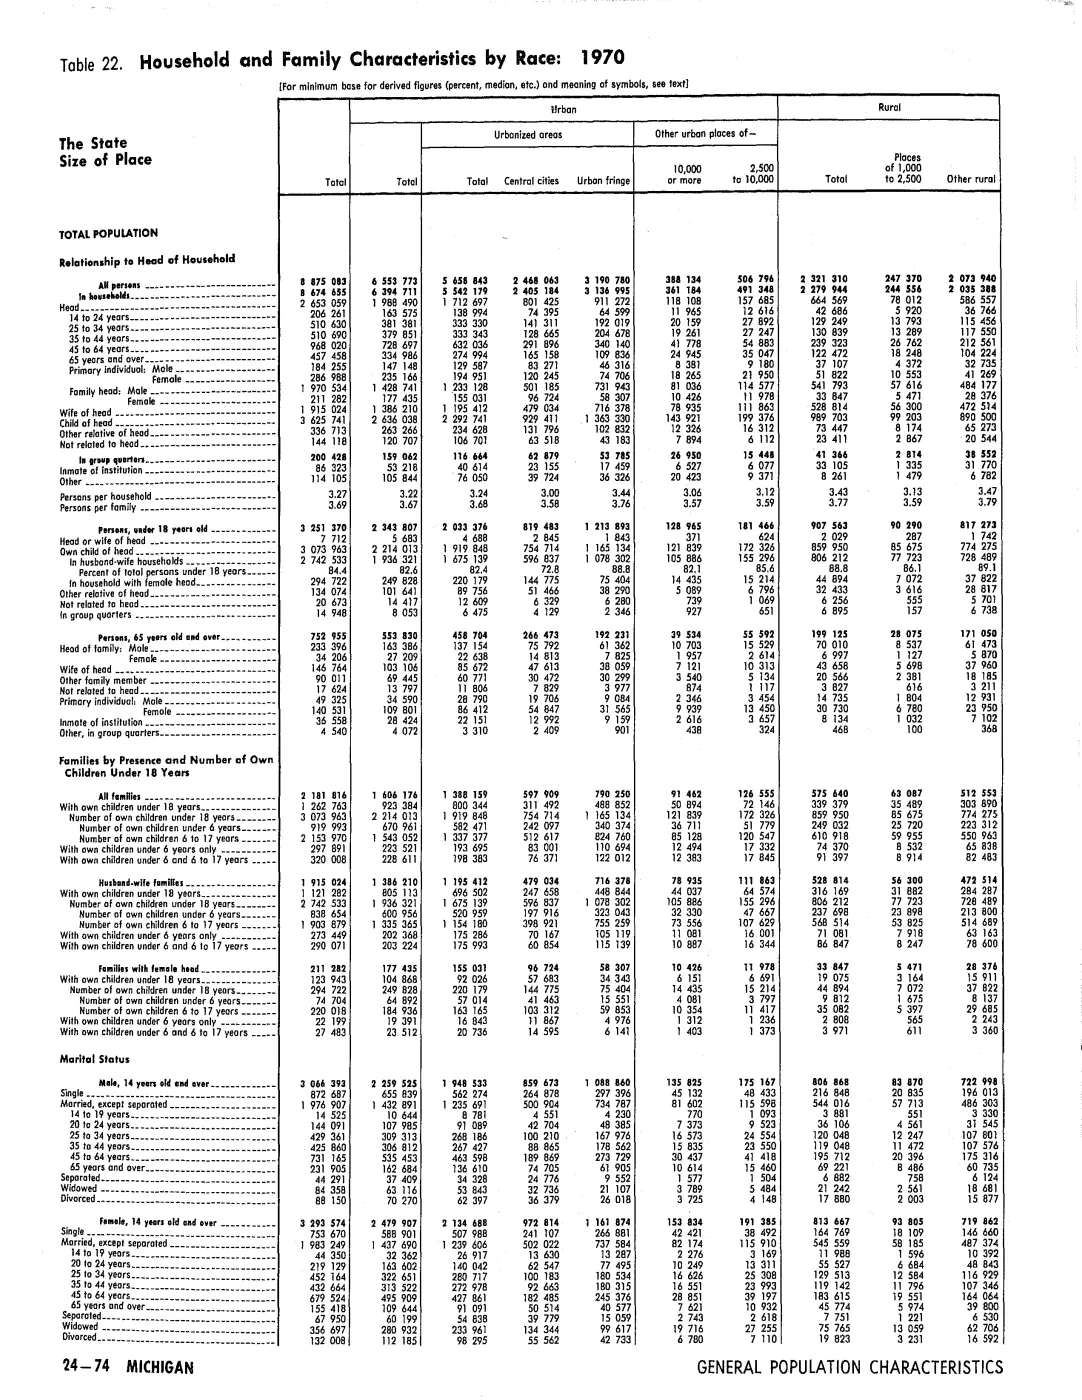
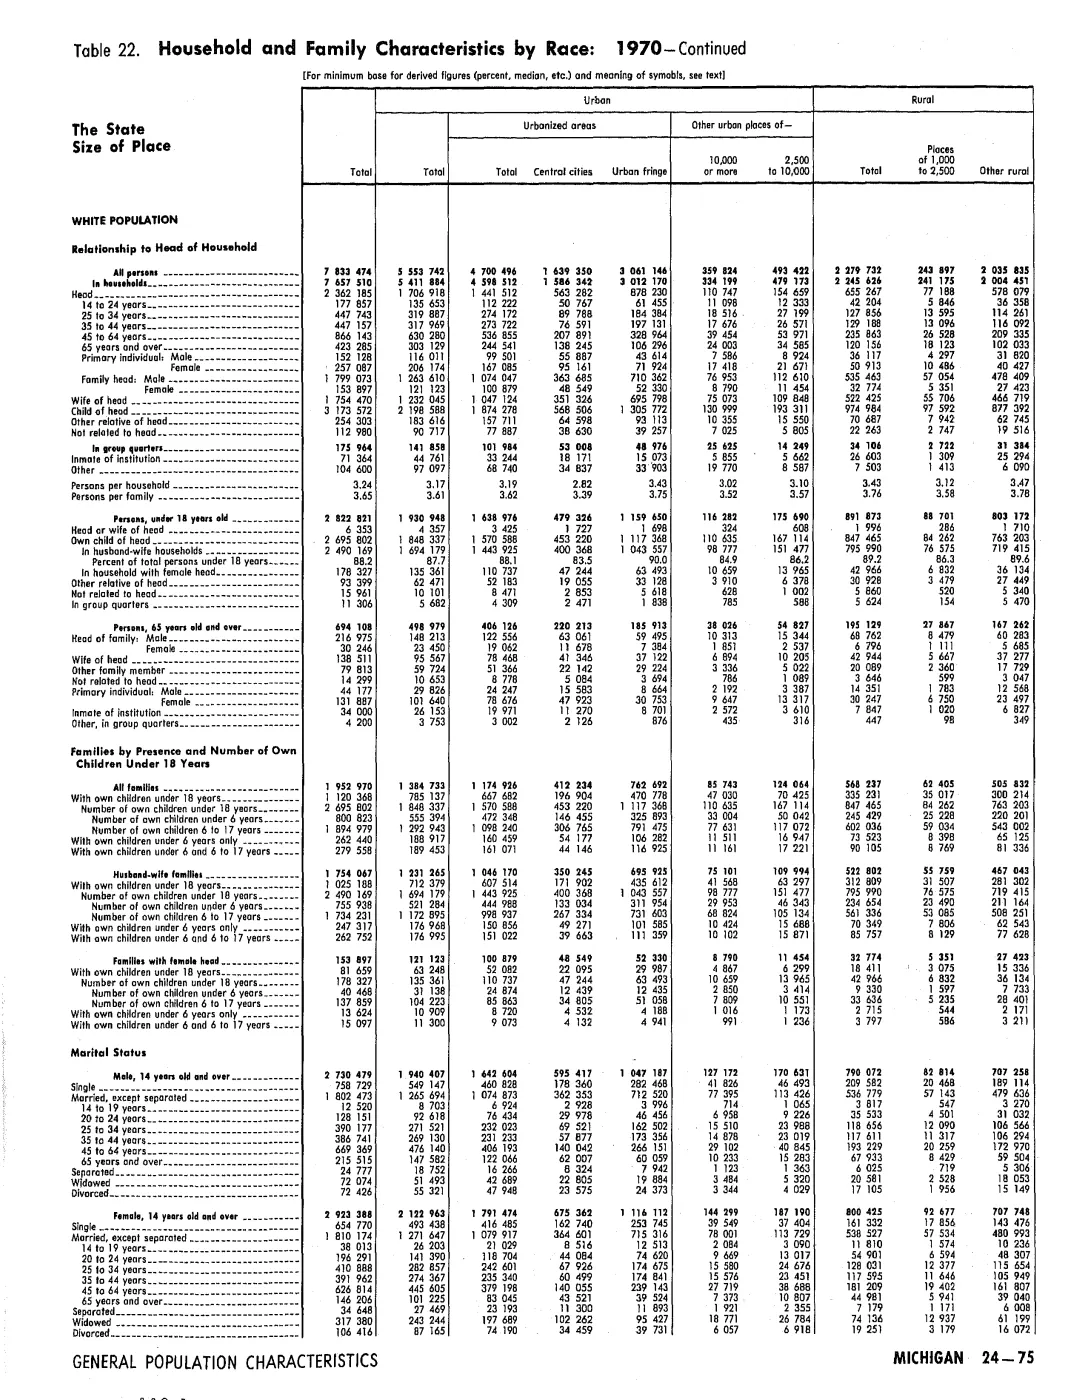
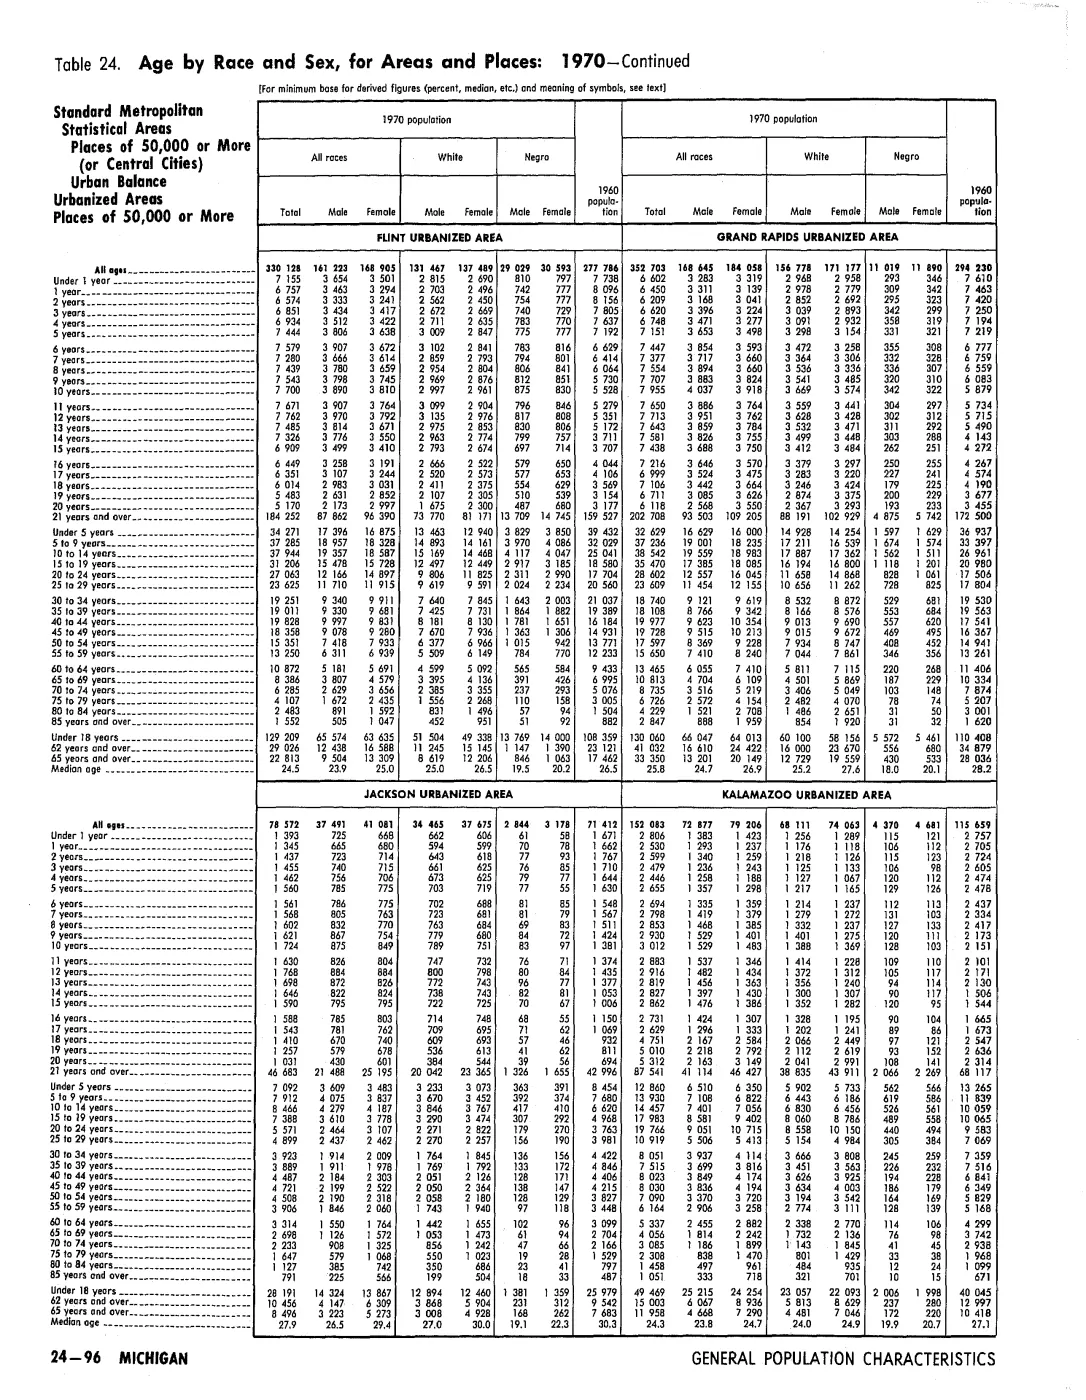
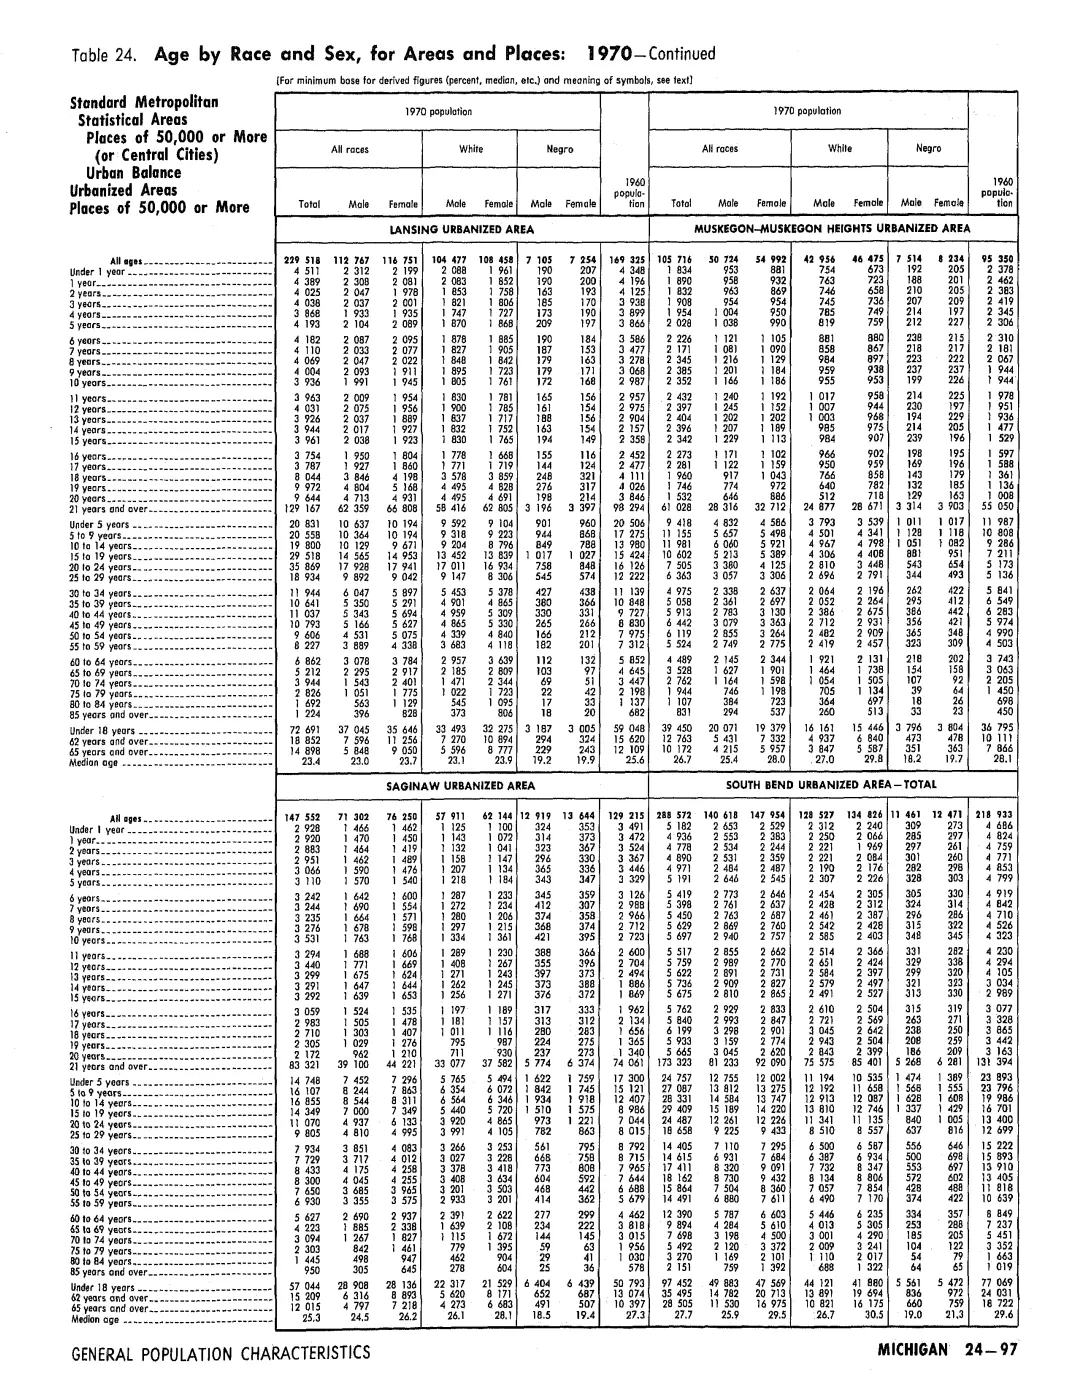
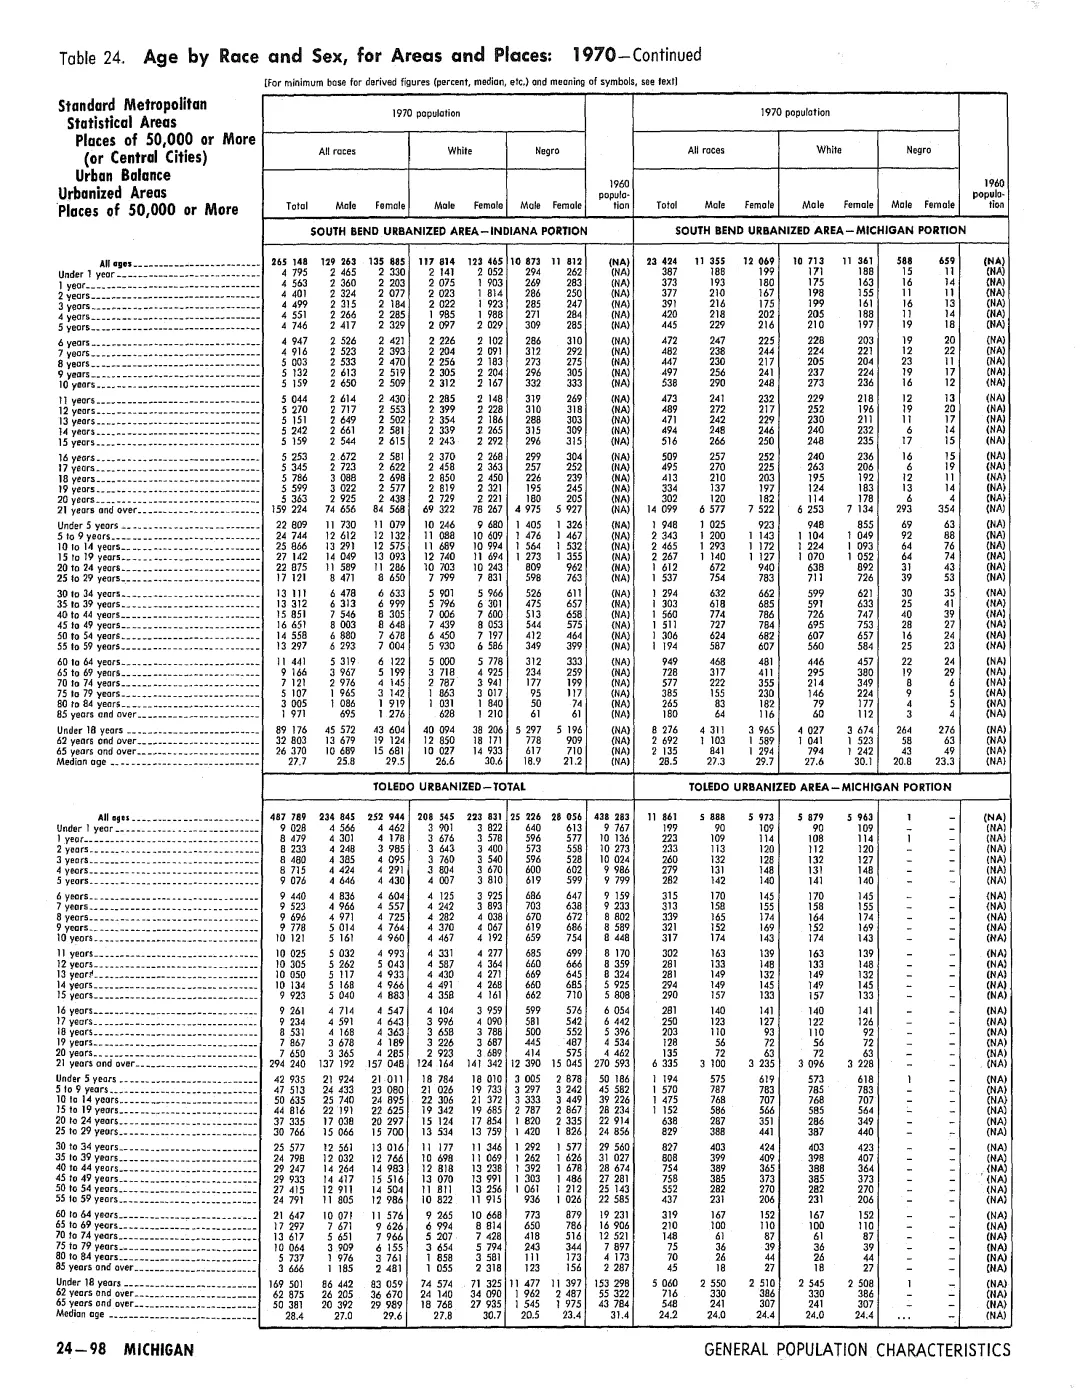
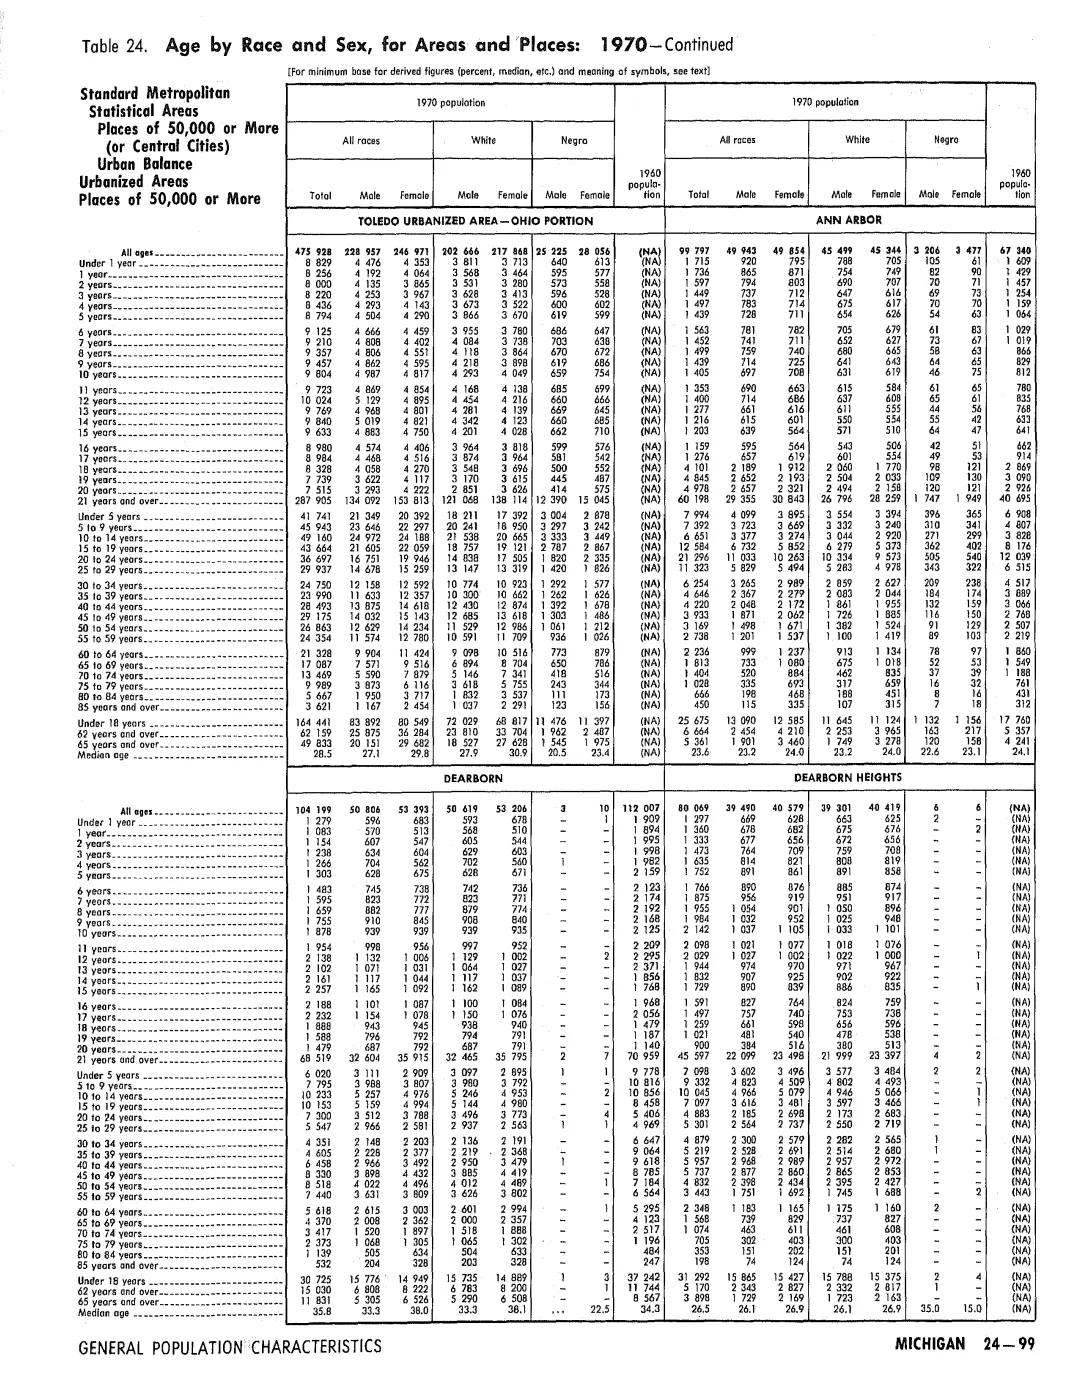
Read the document
164 pages, rendered from the held scan.
Jump to a page — 164 in all
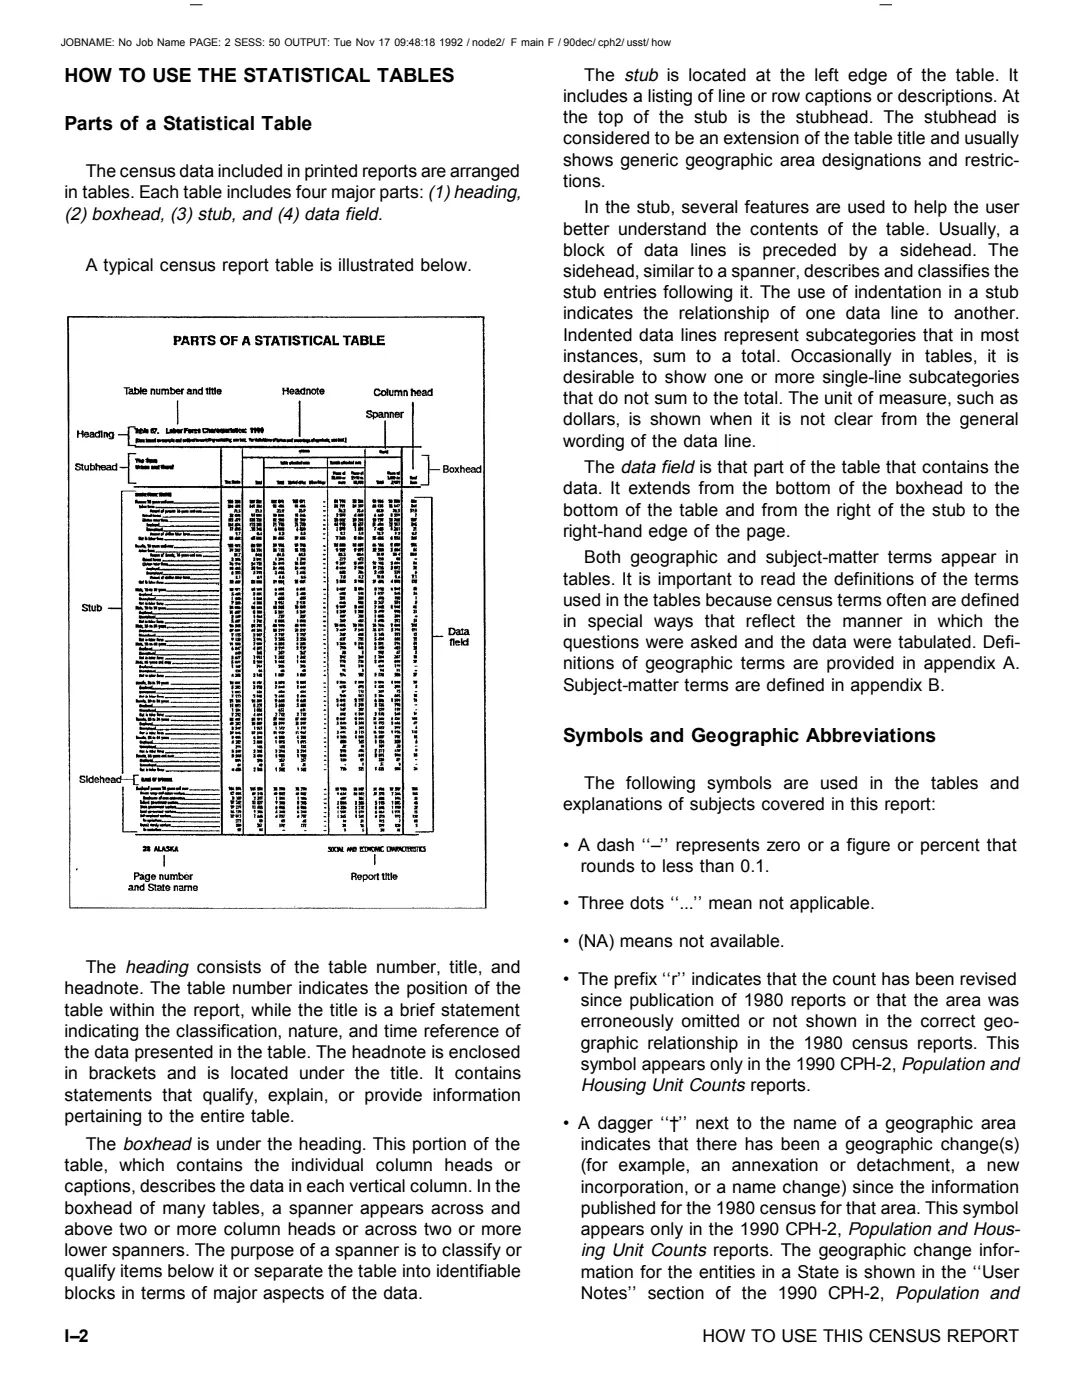
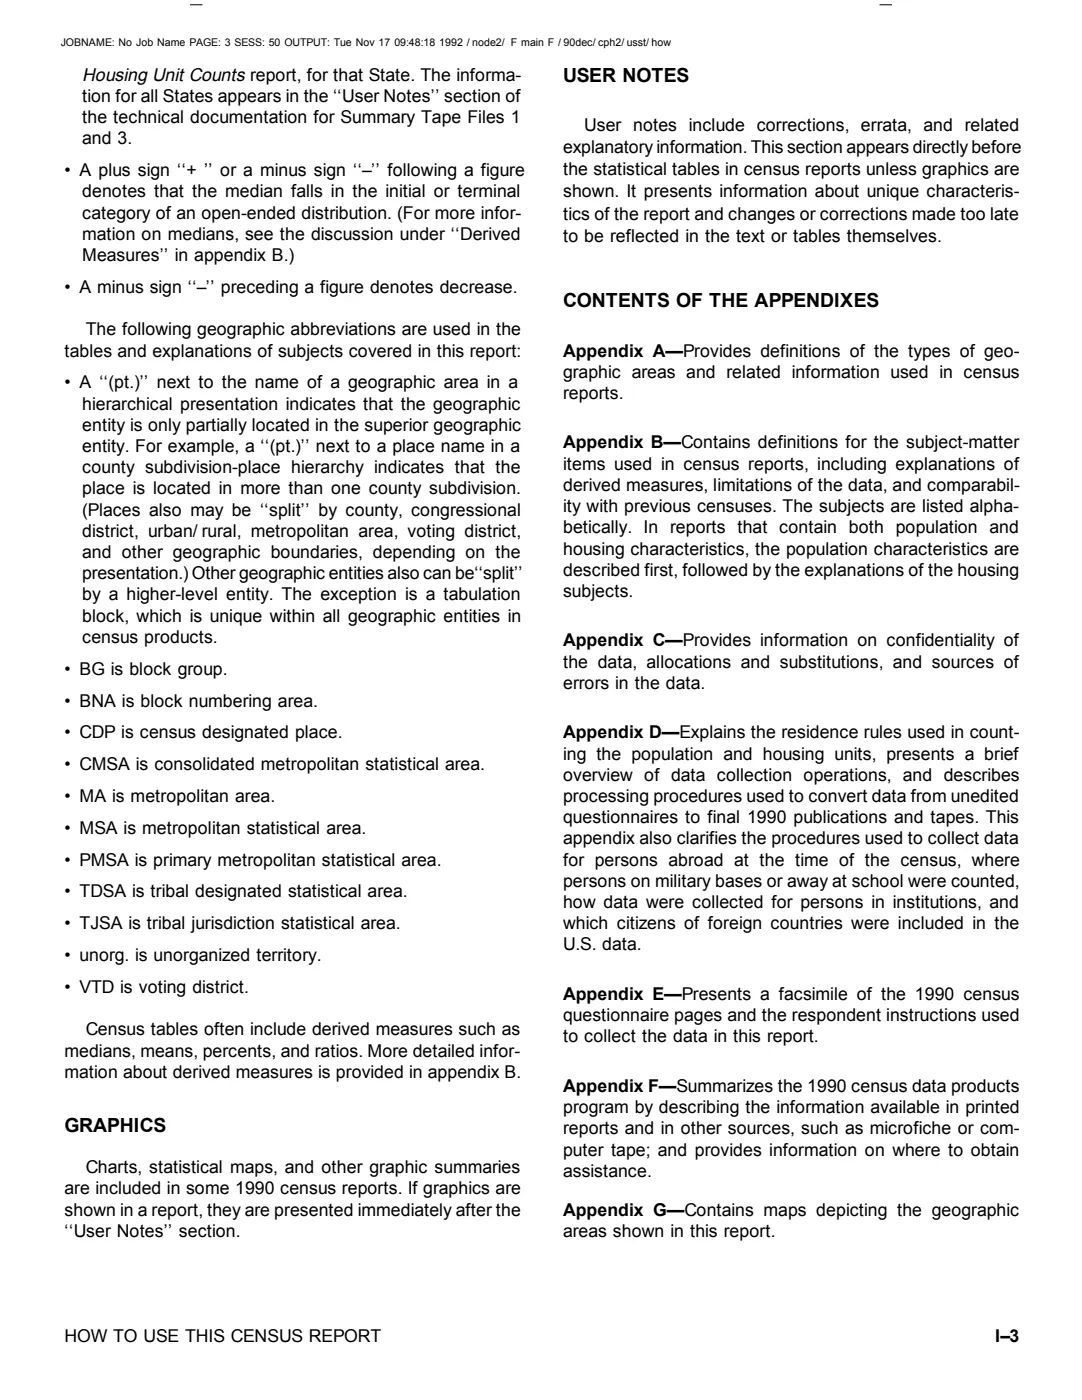
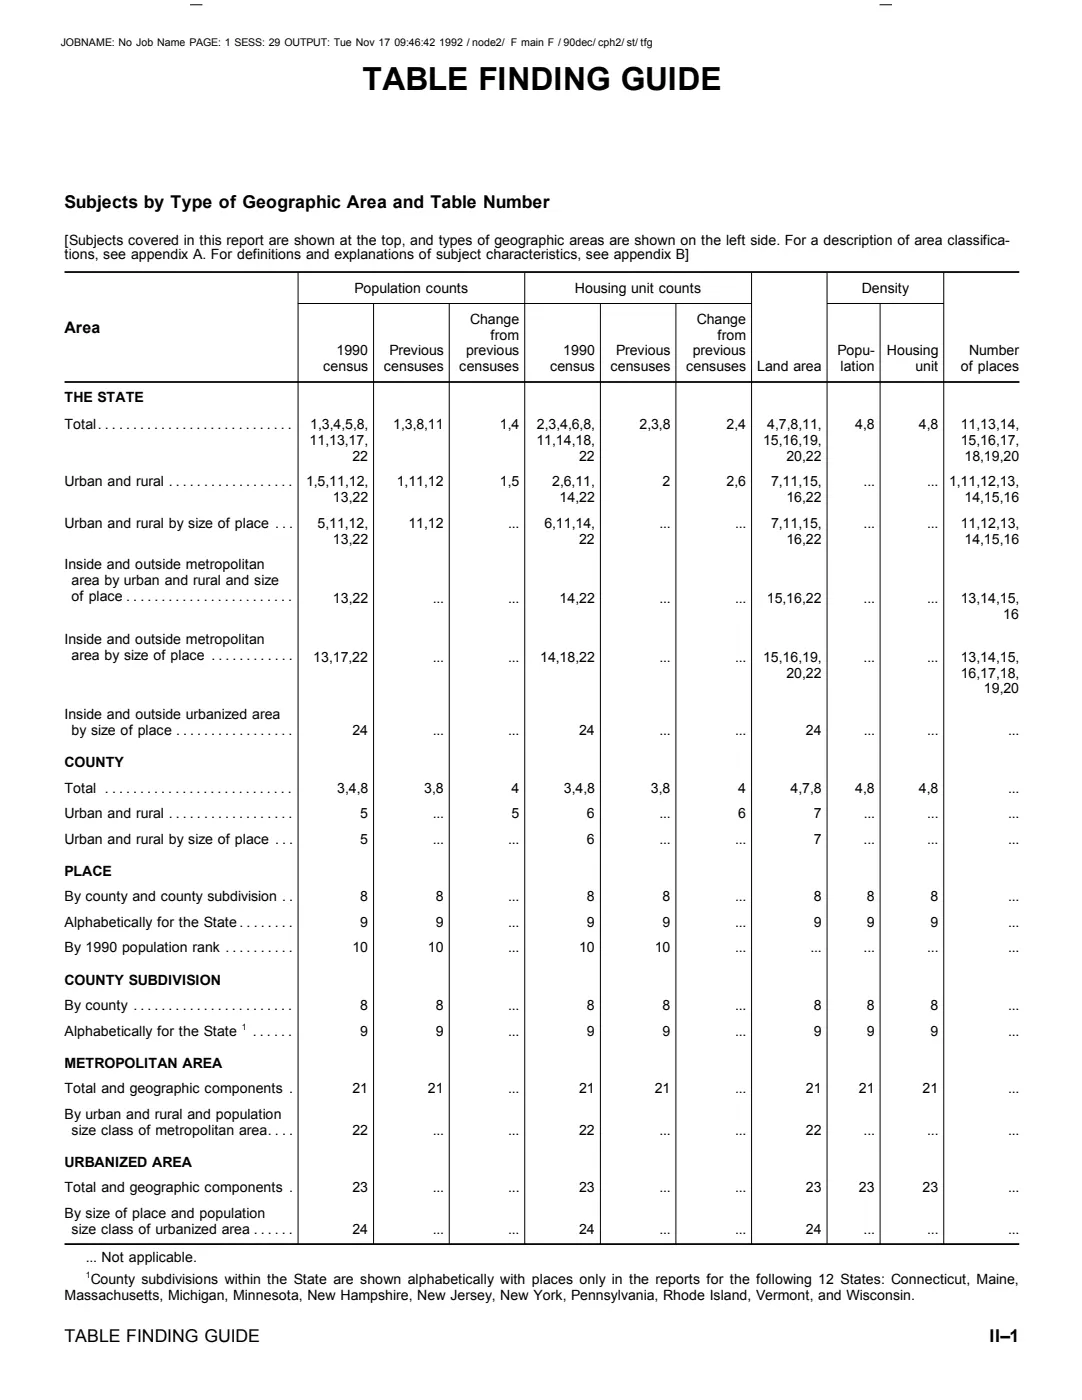
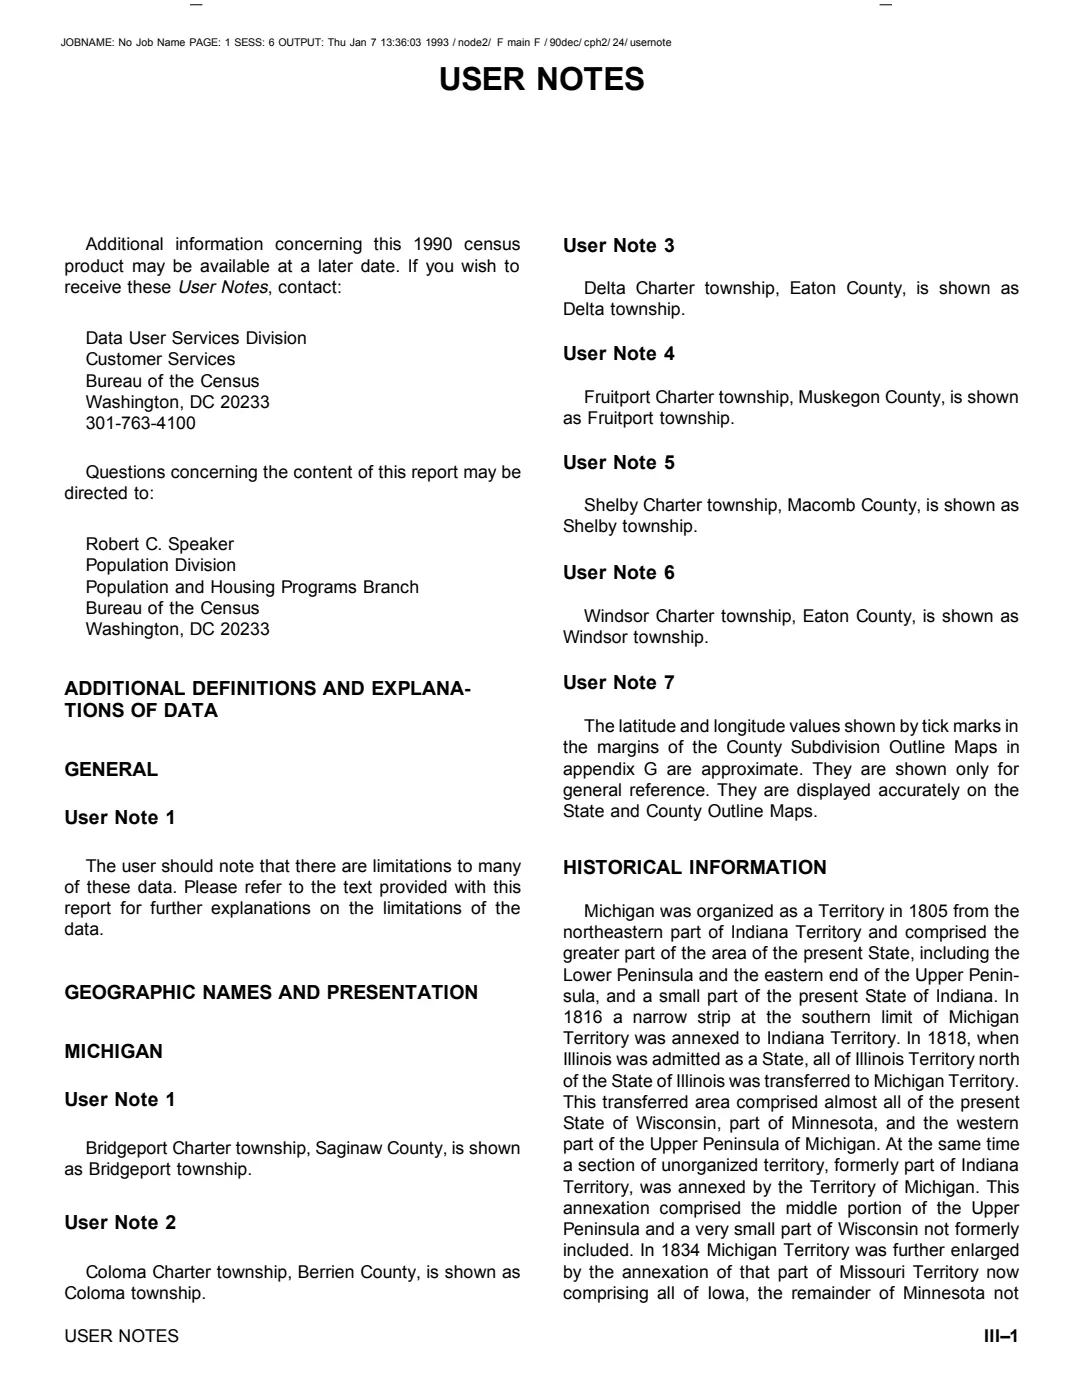
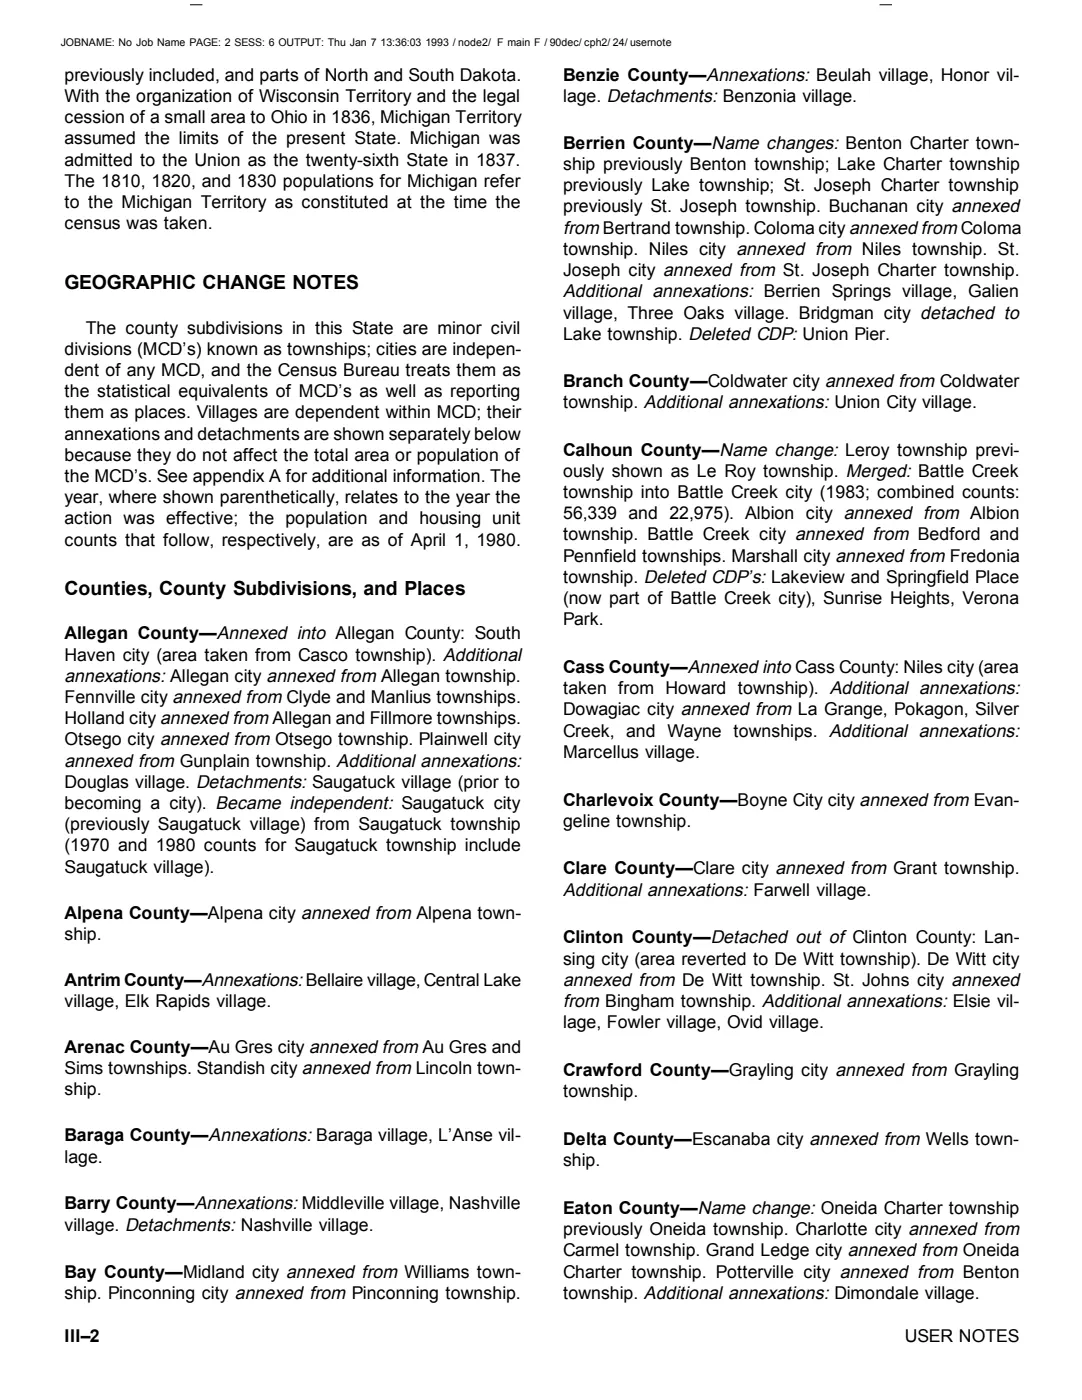
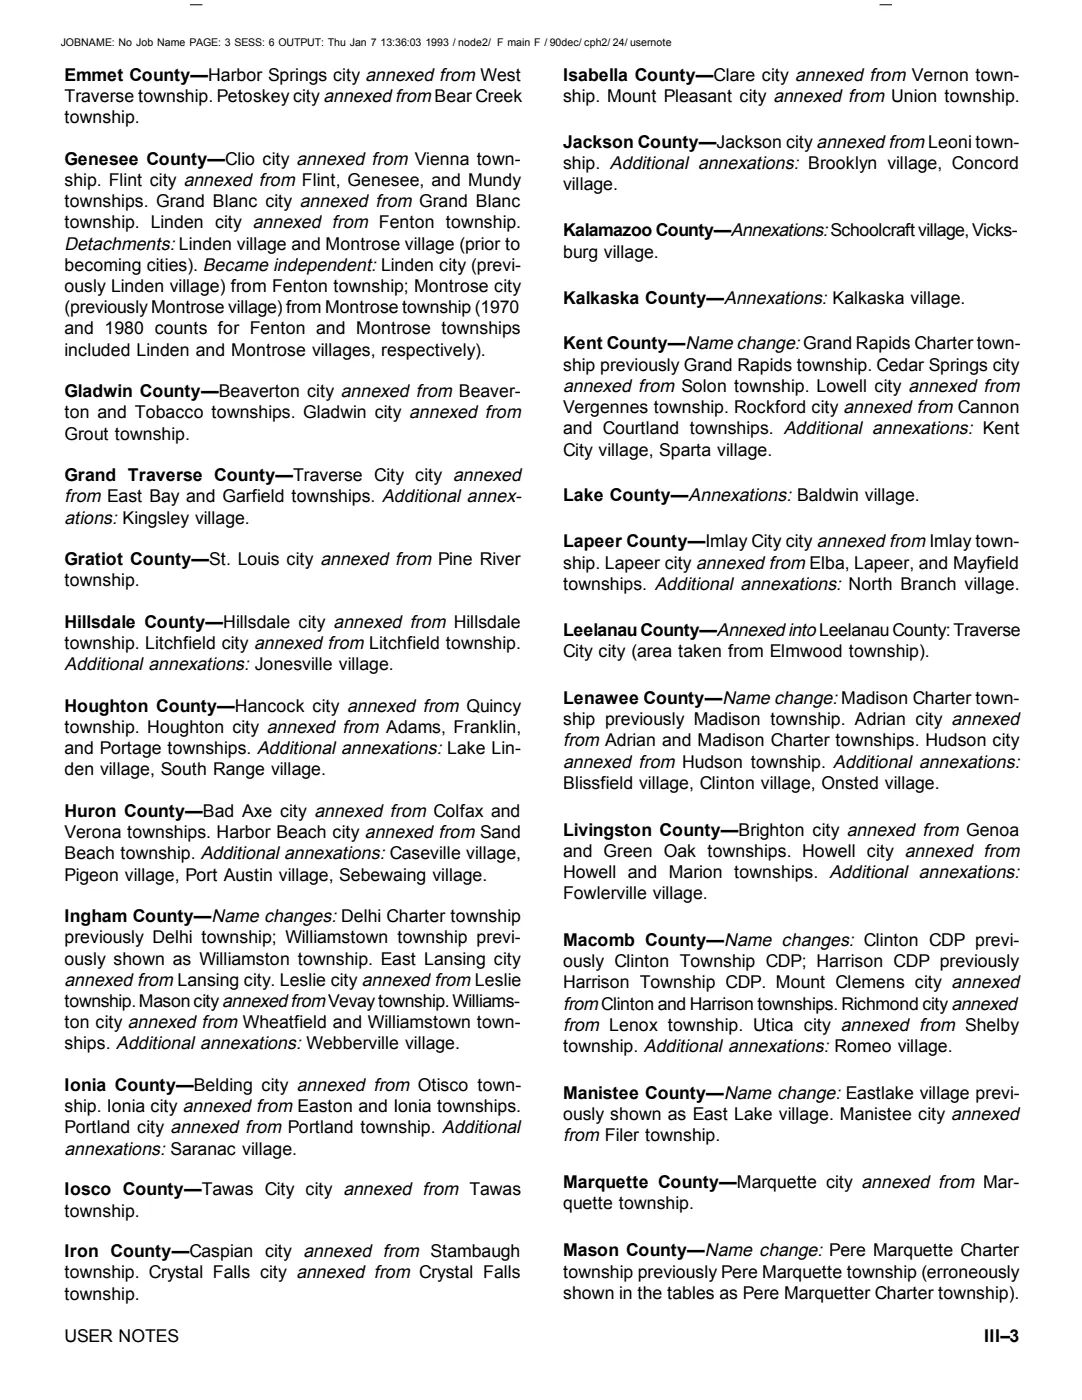
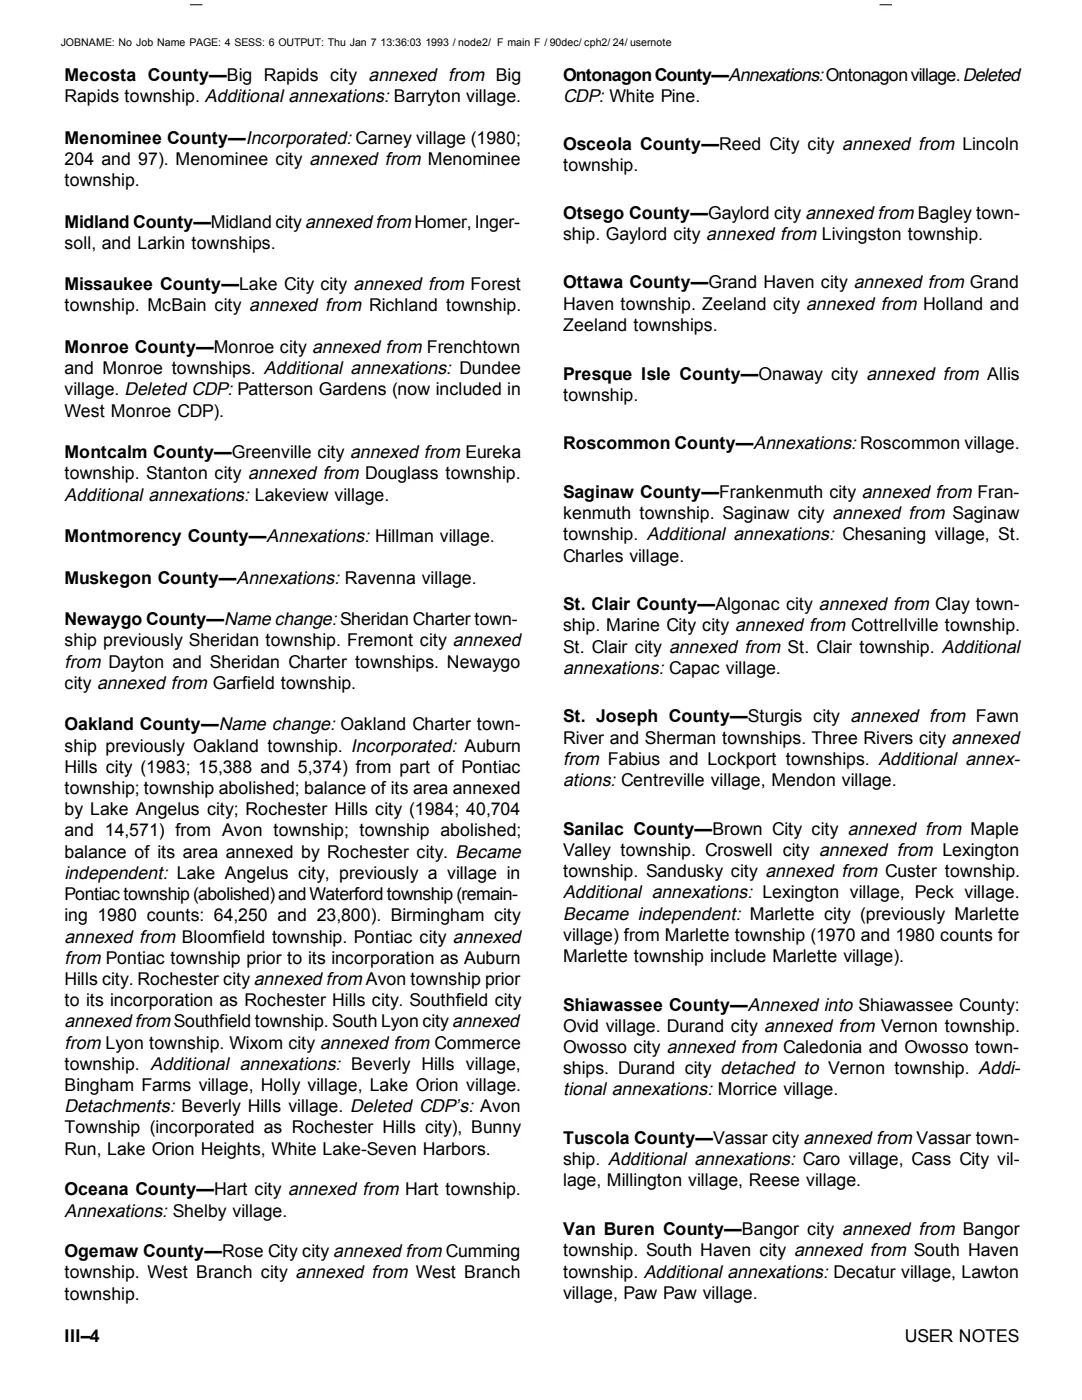
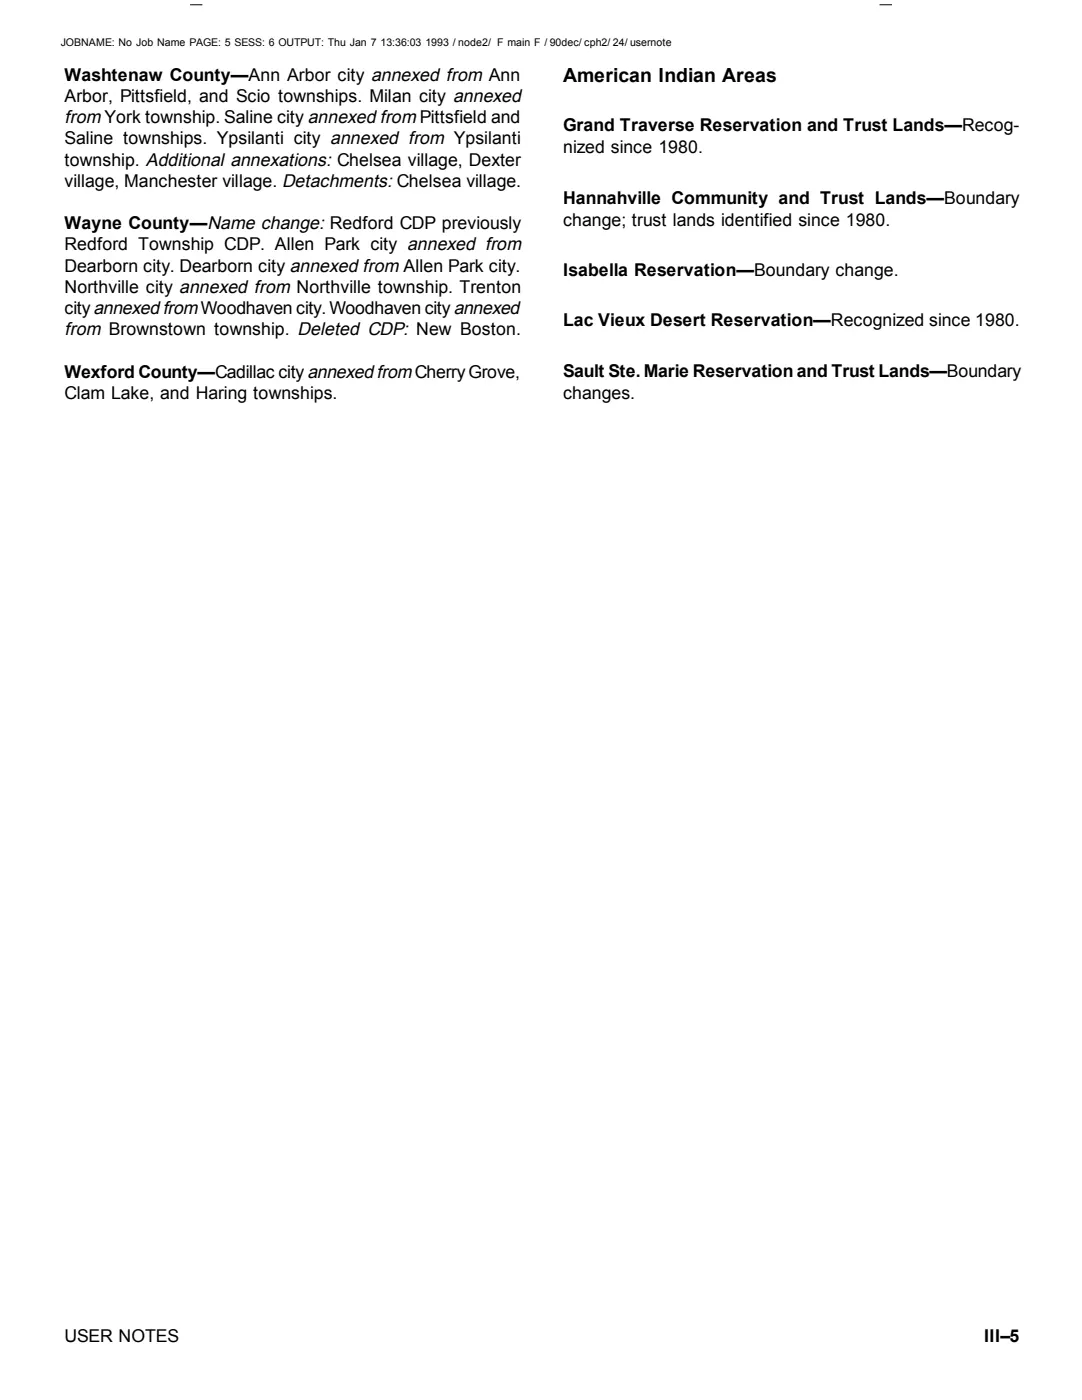
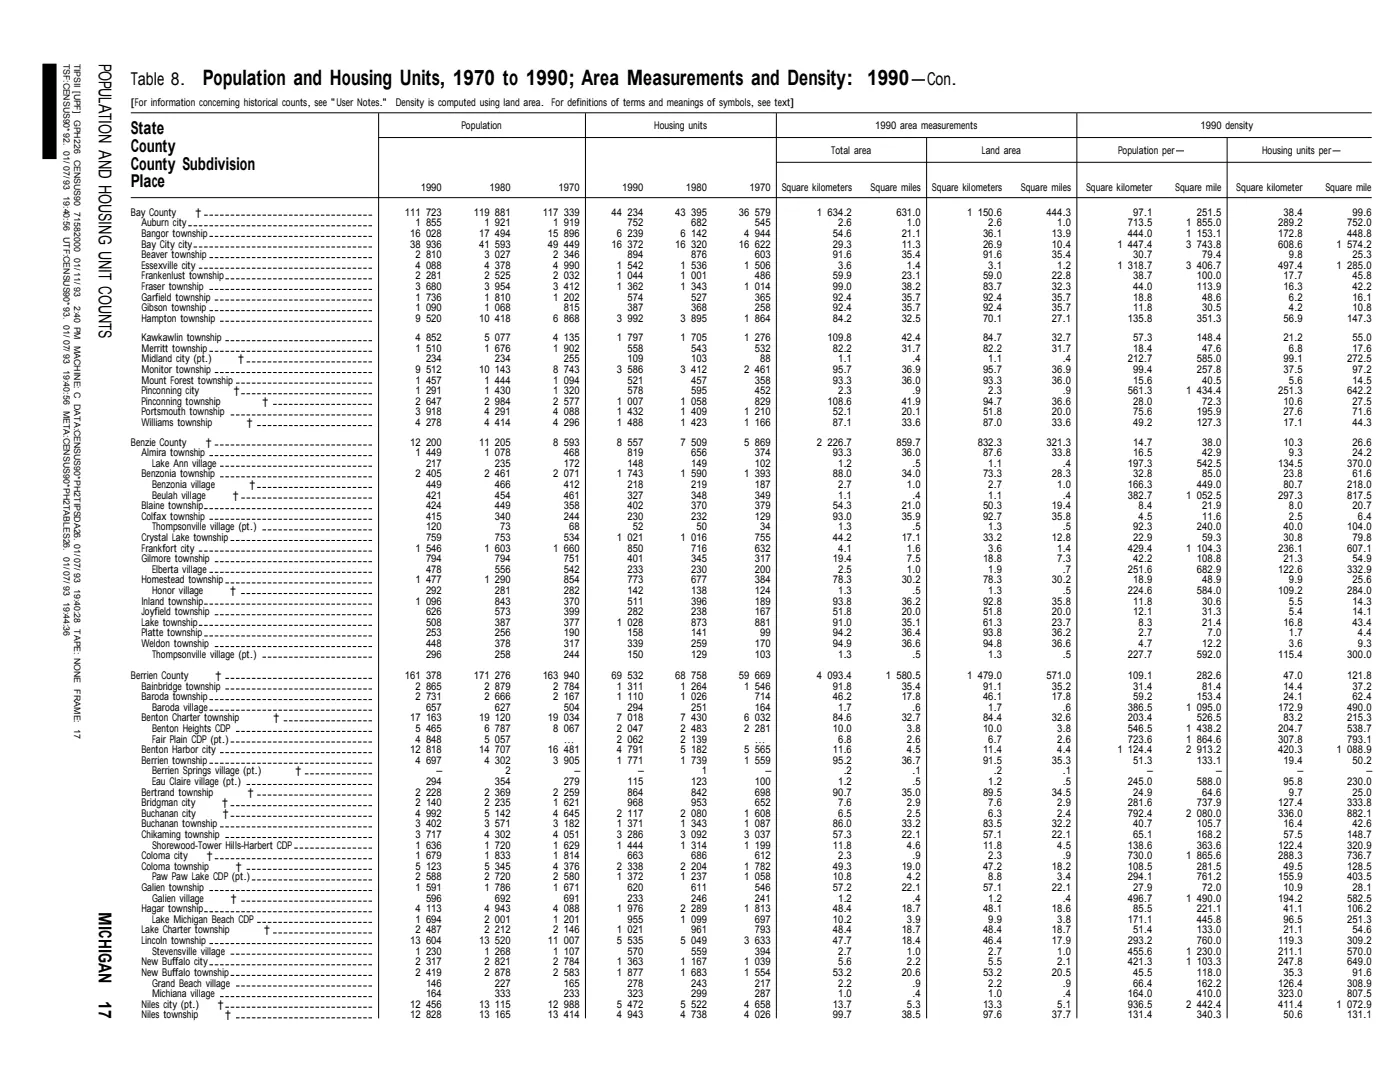
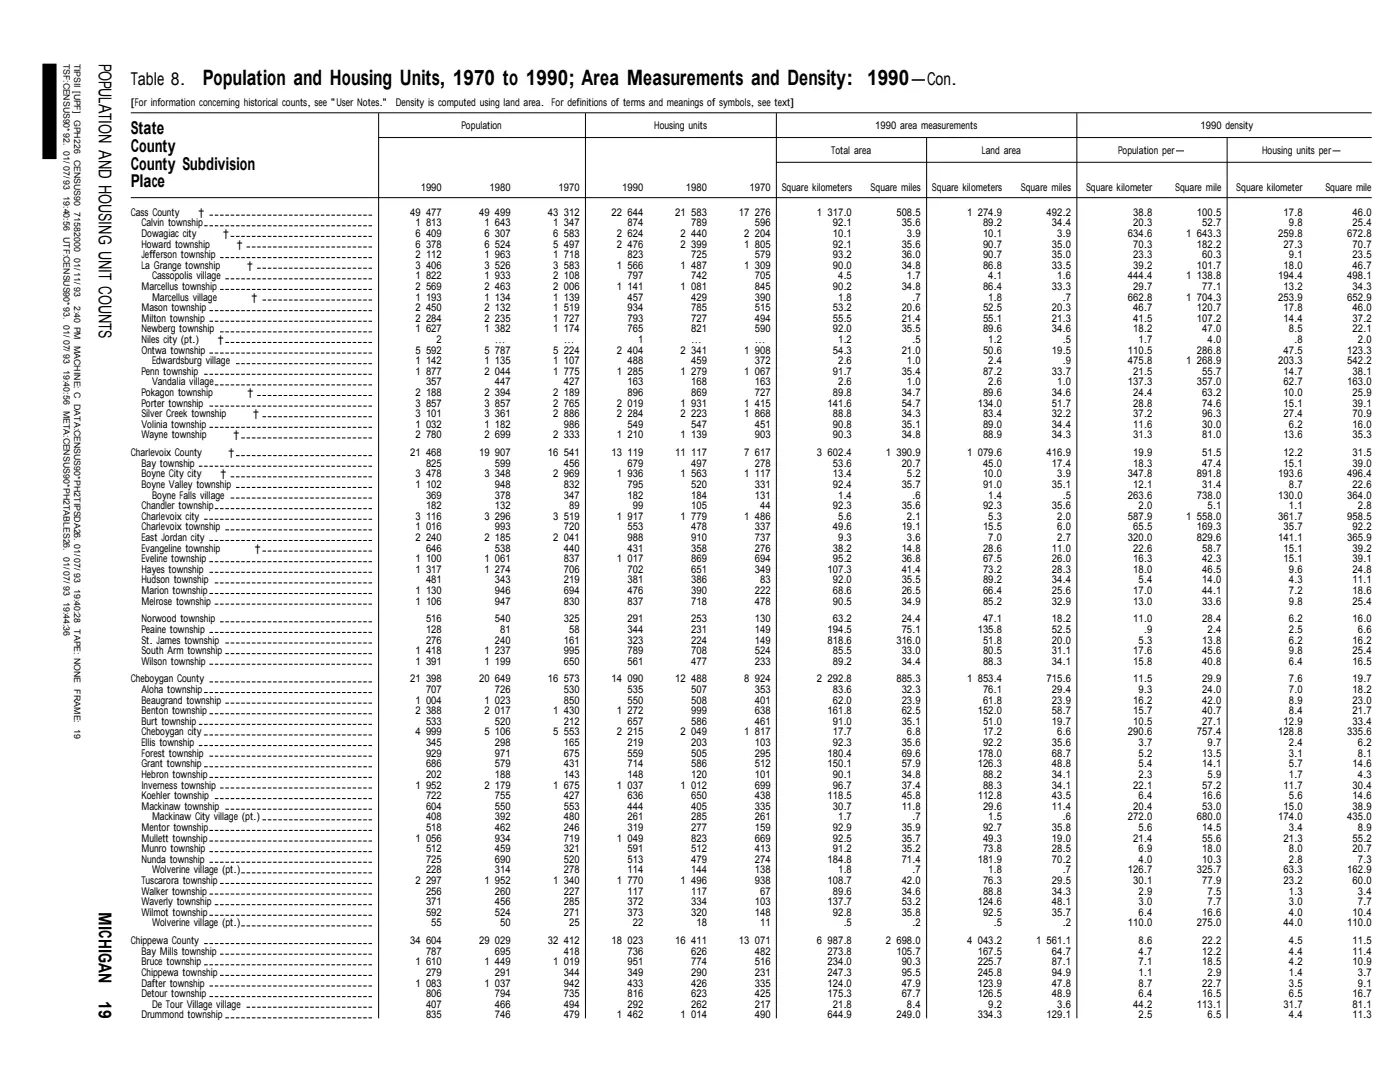
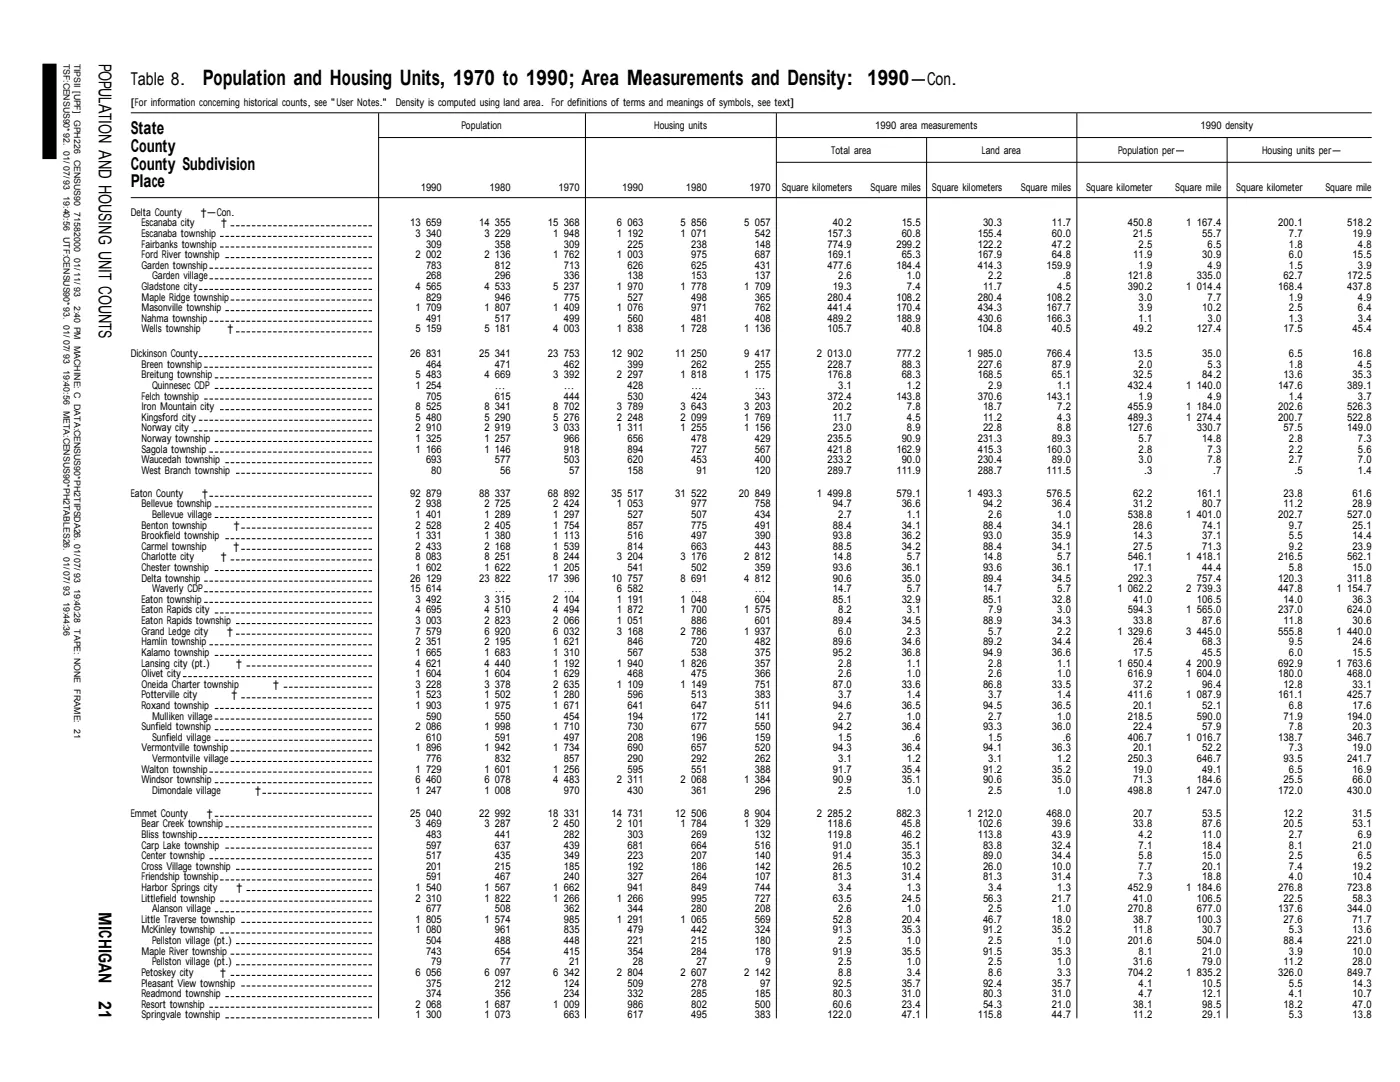
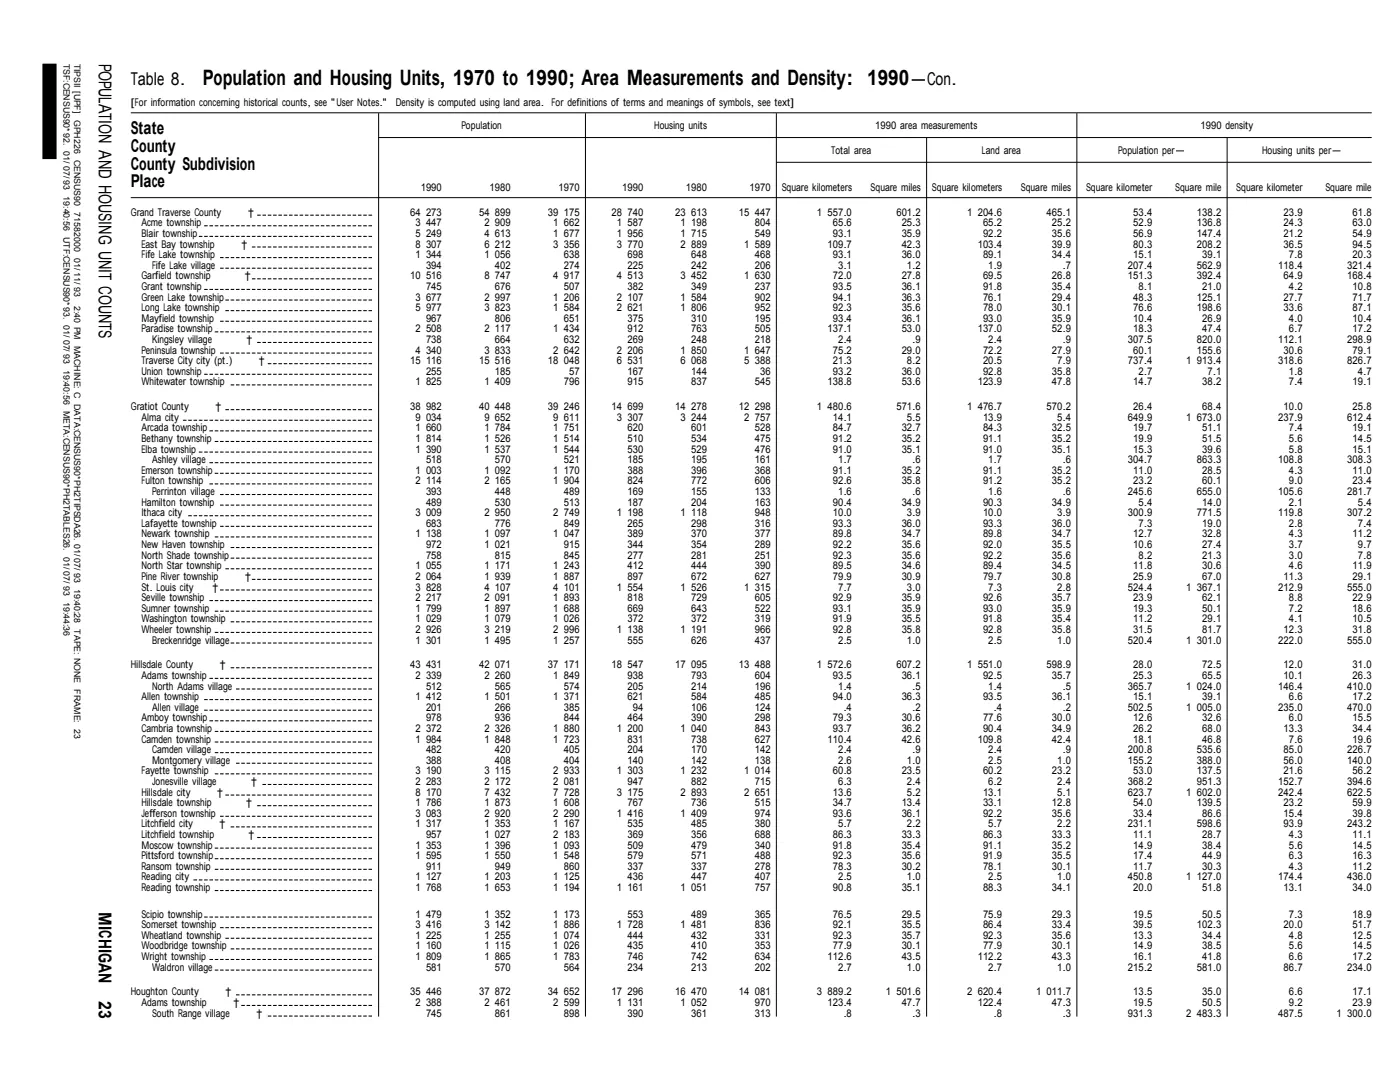
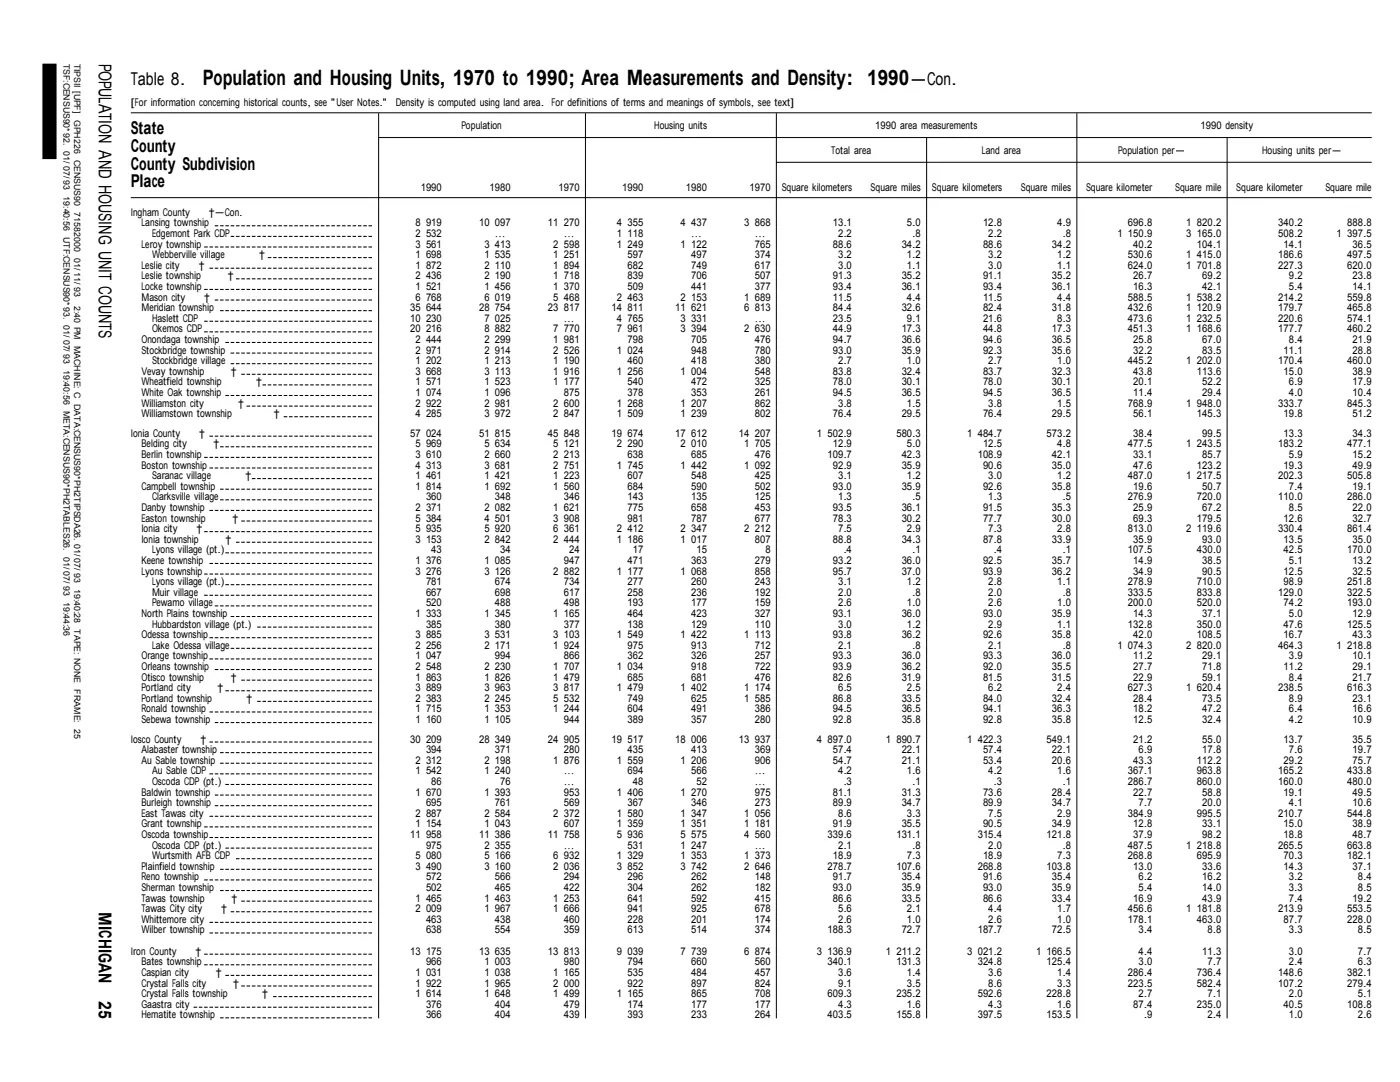
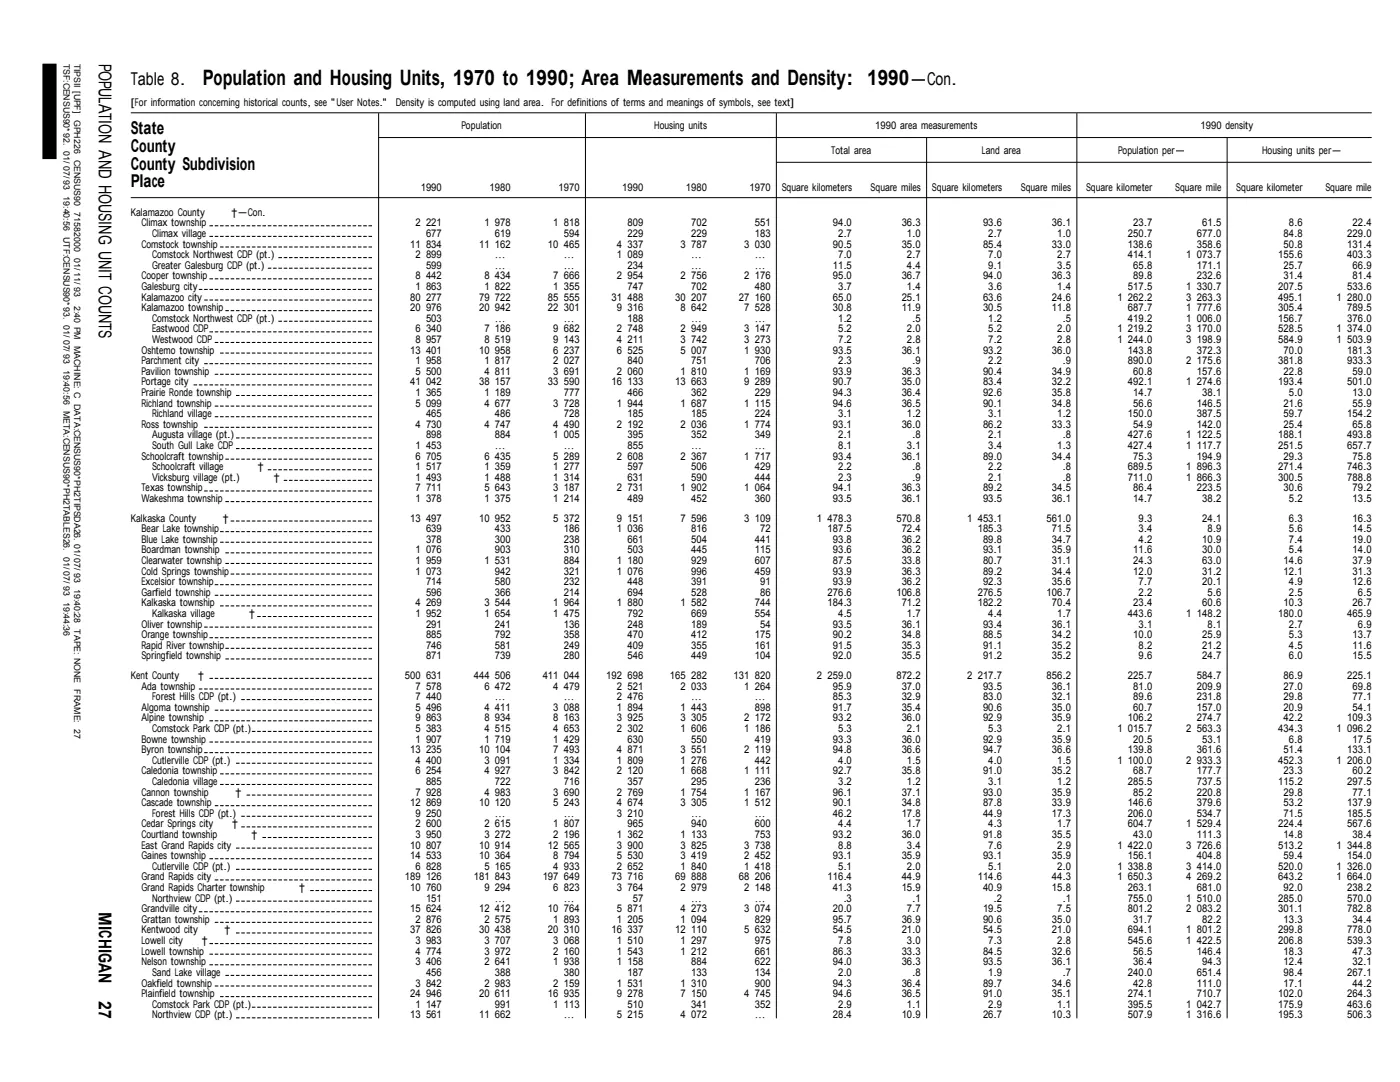
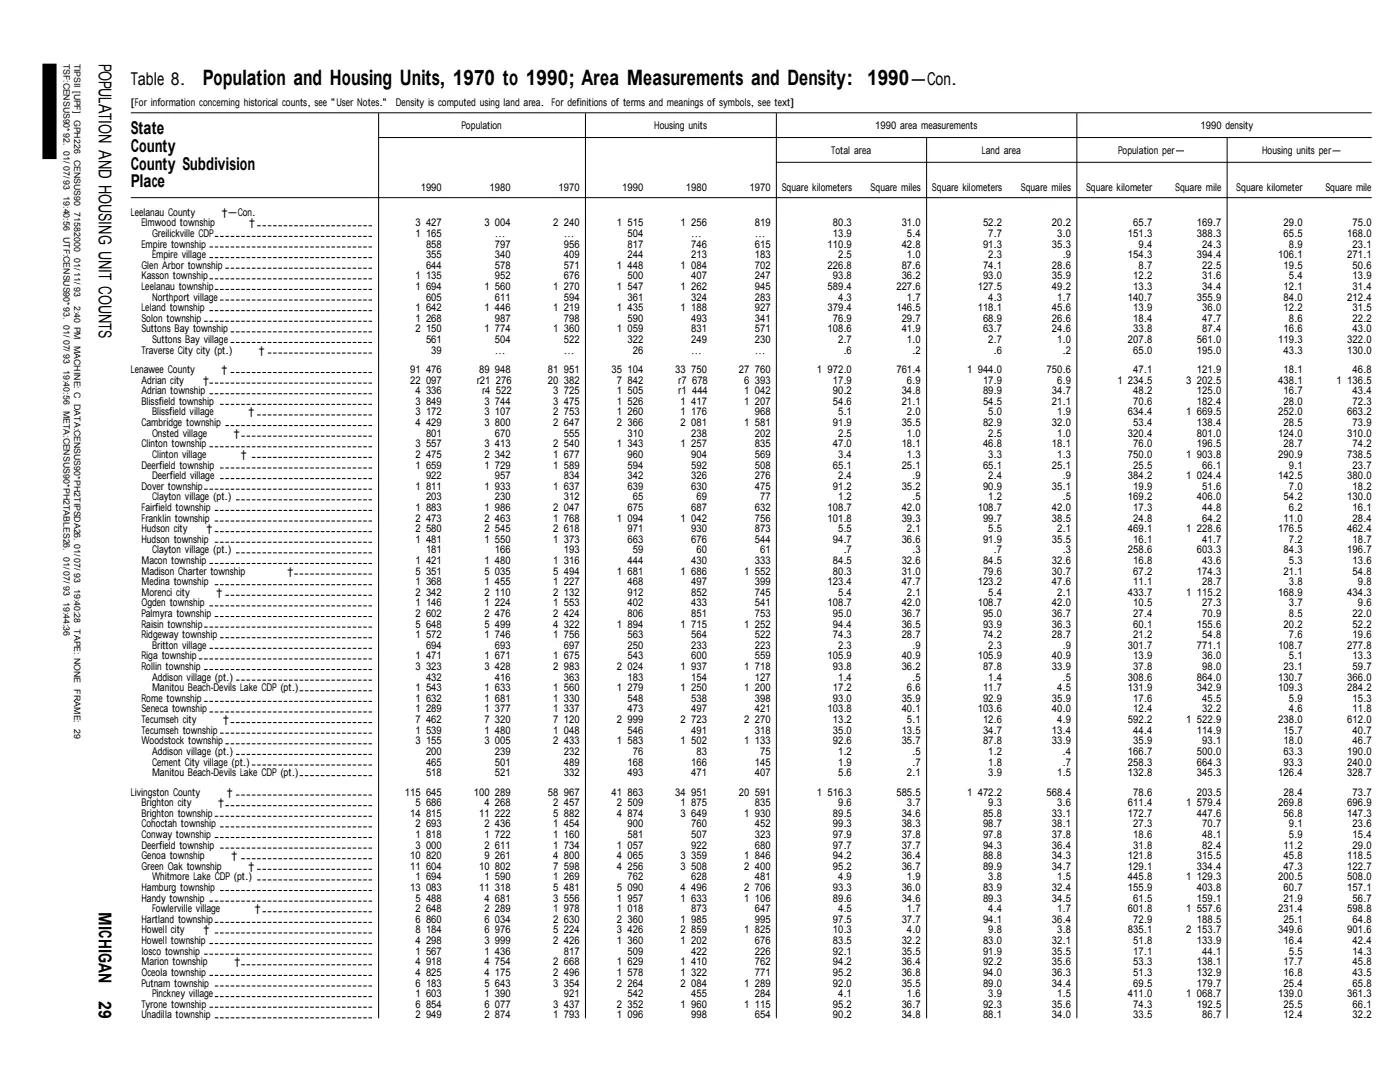
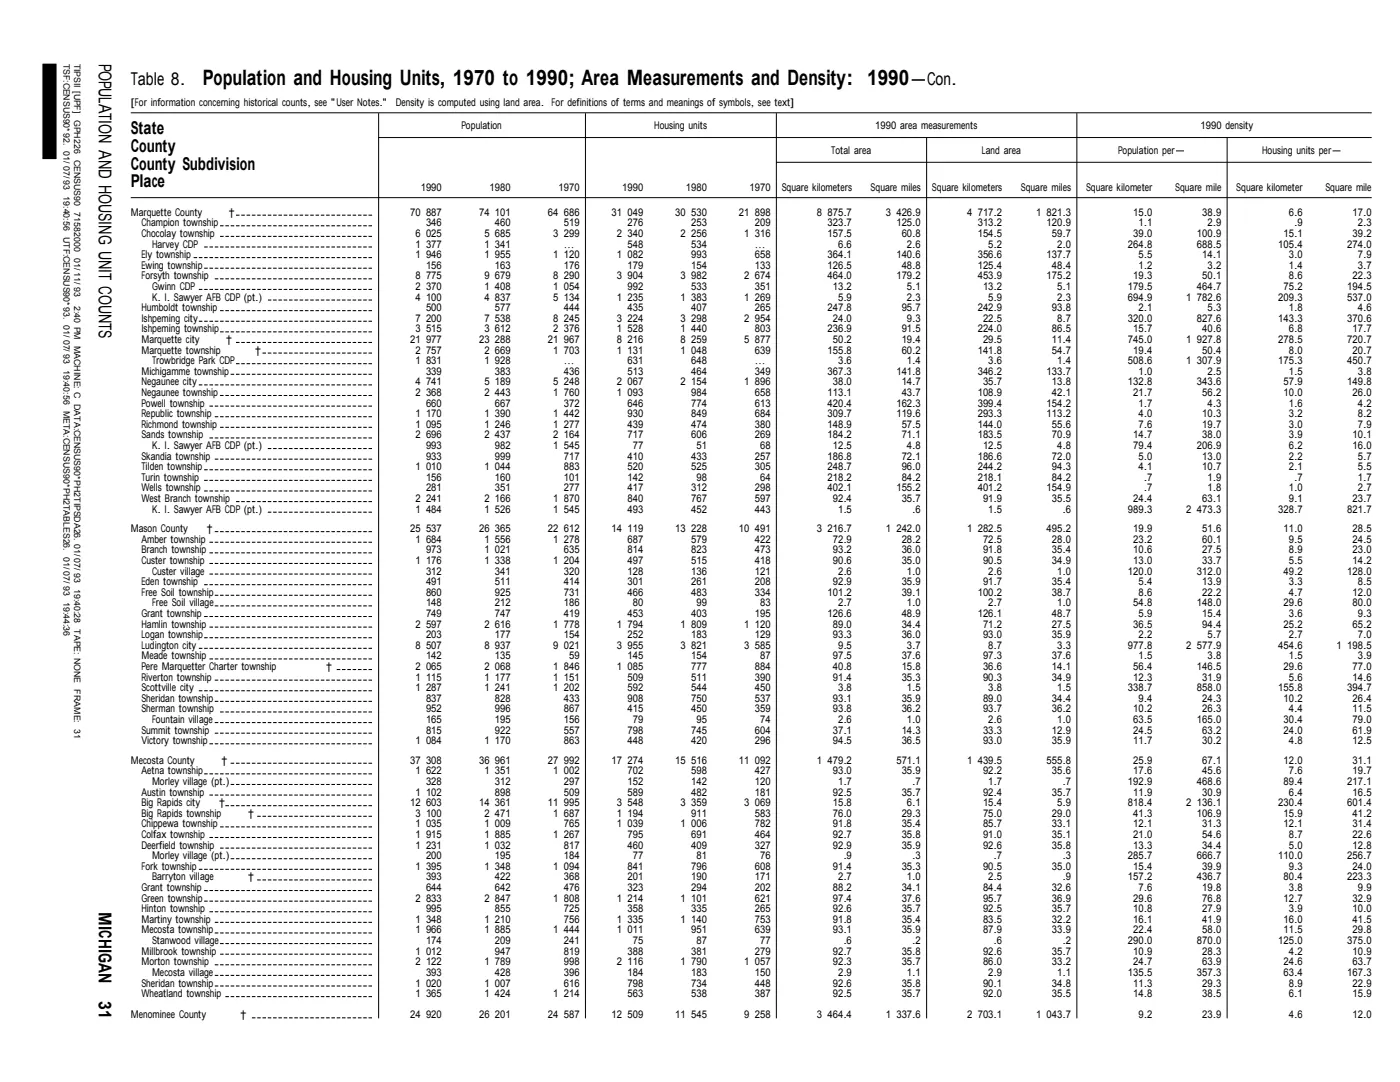
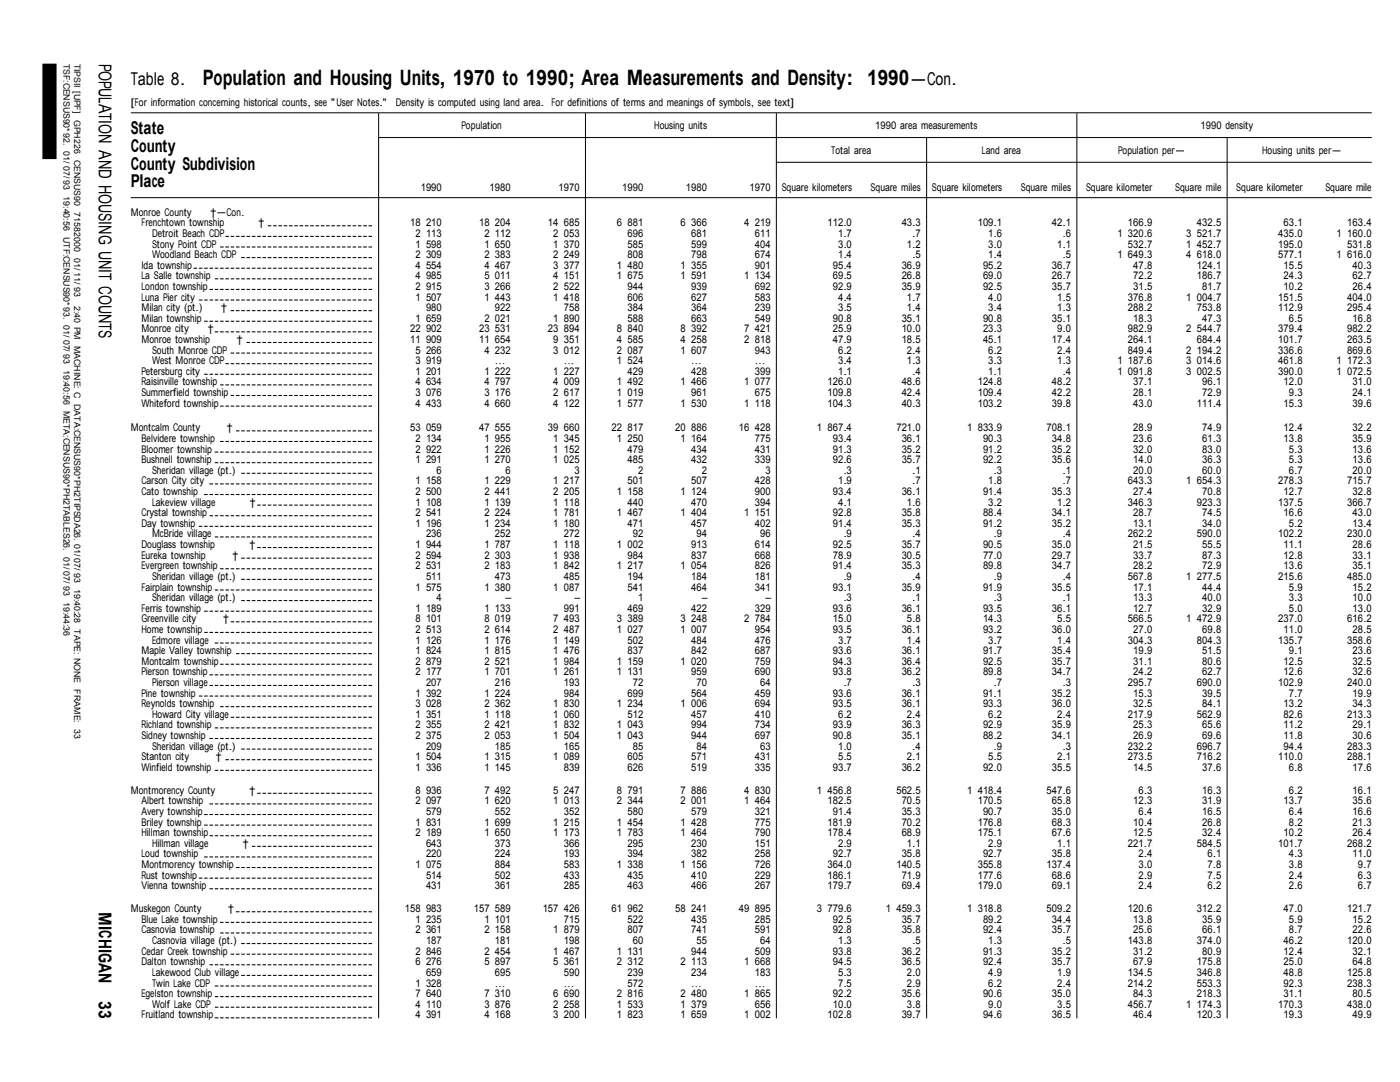
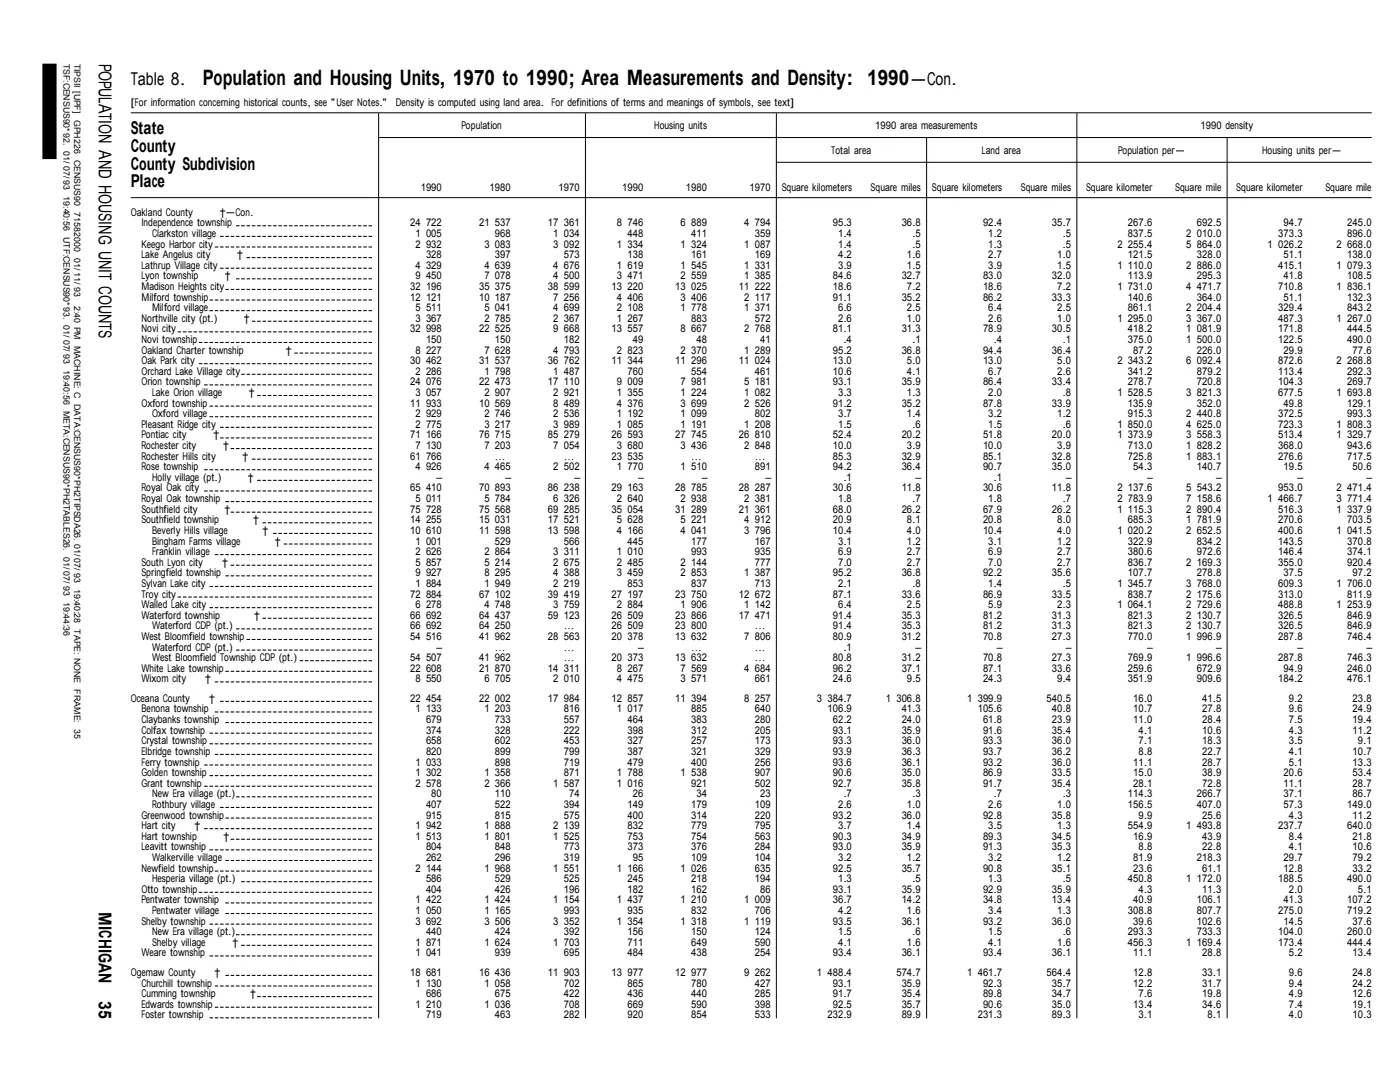
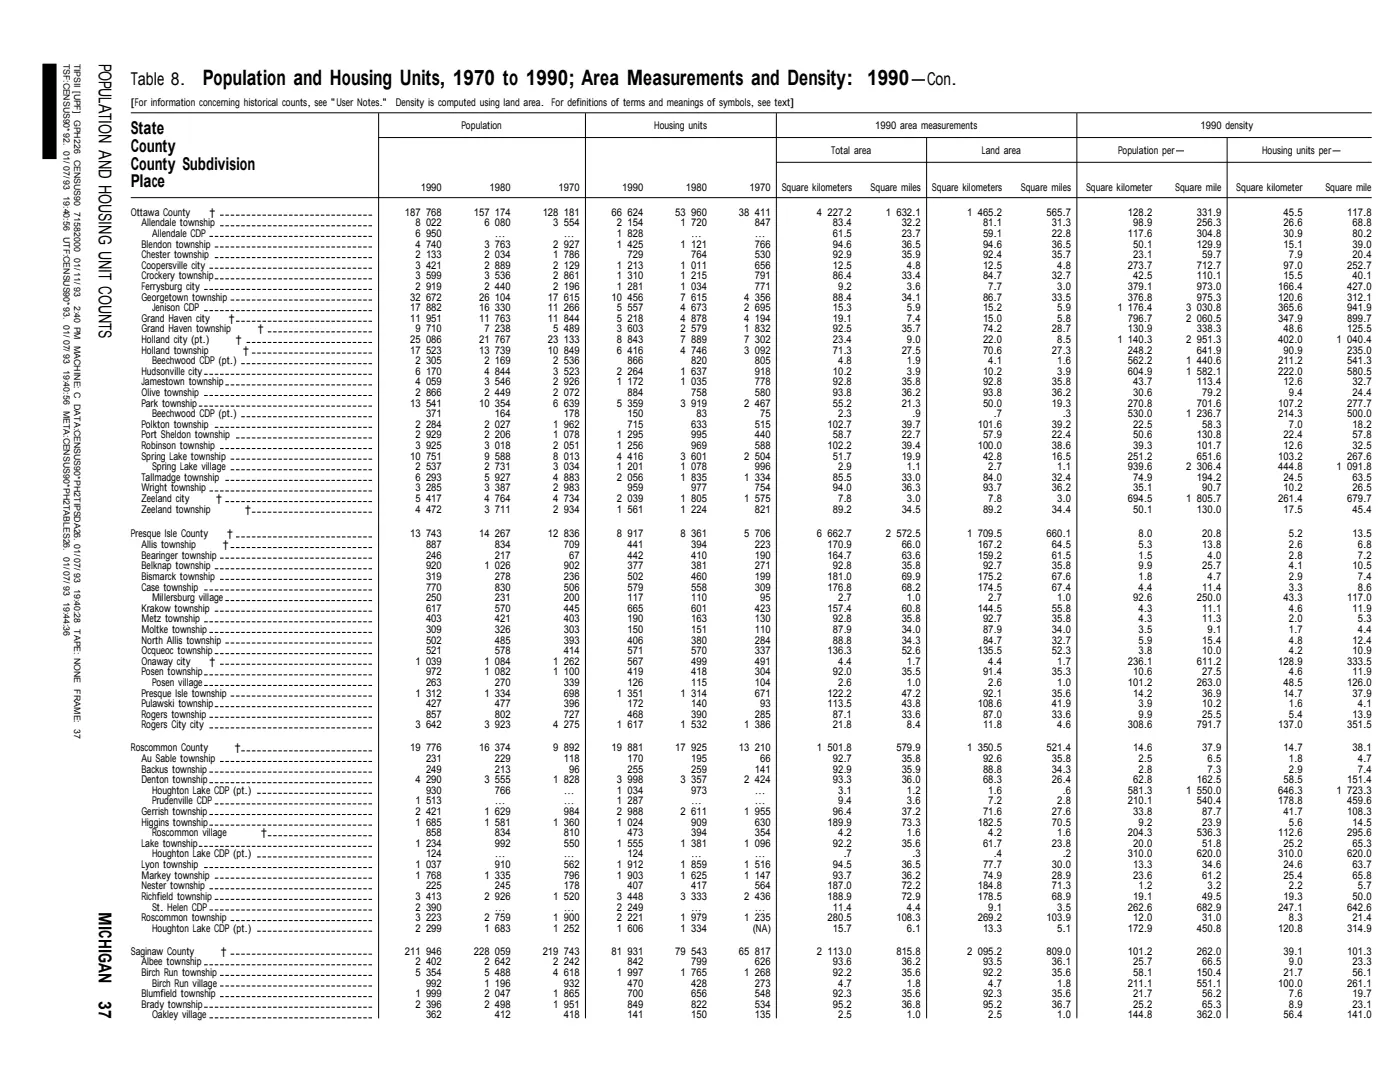
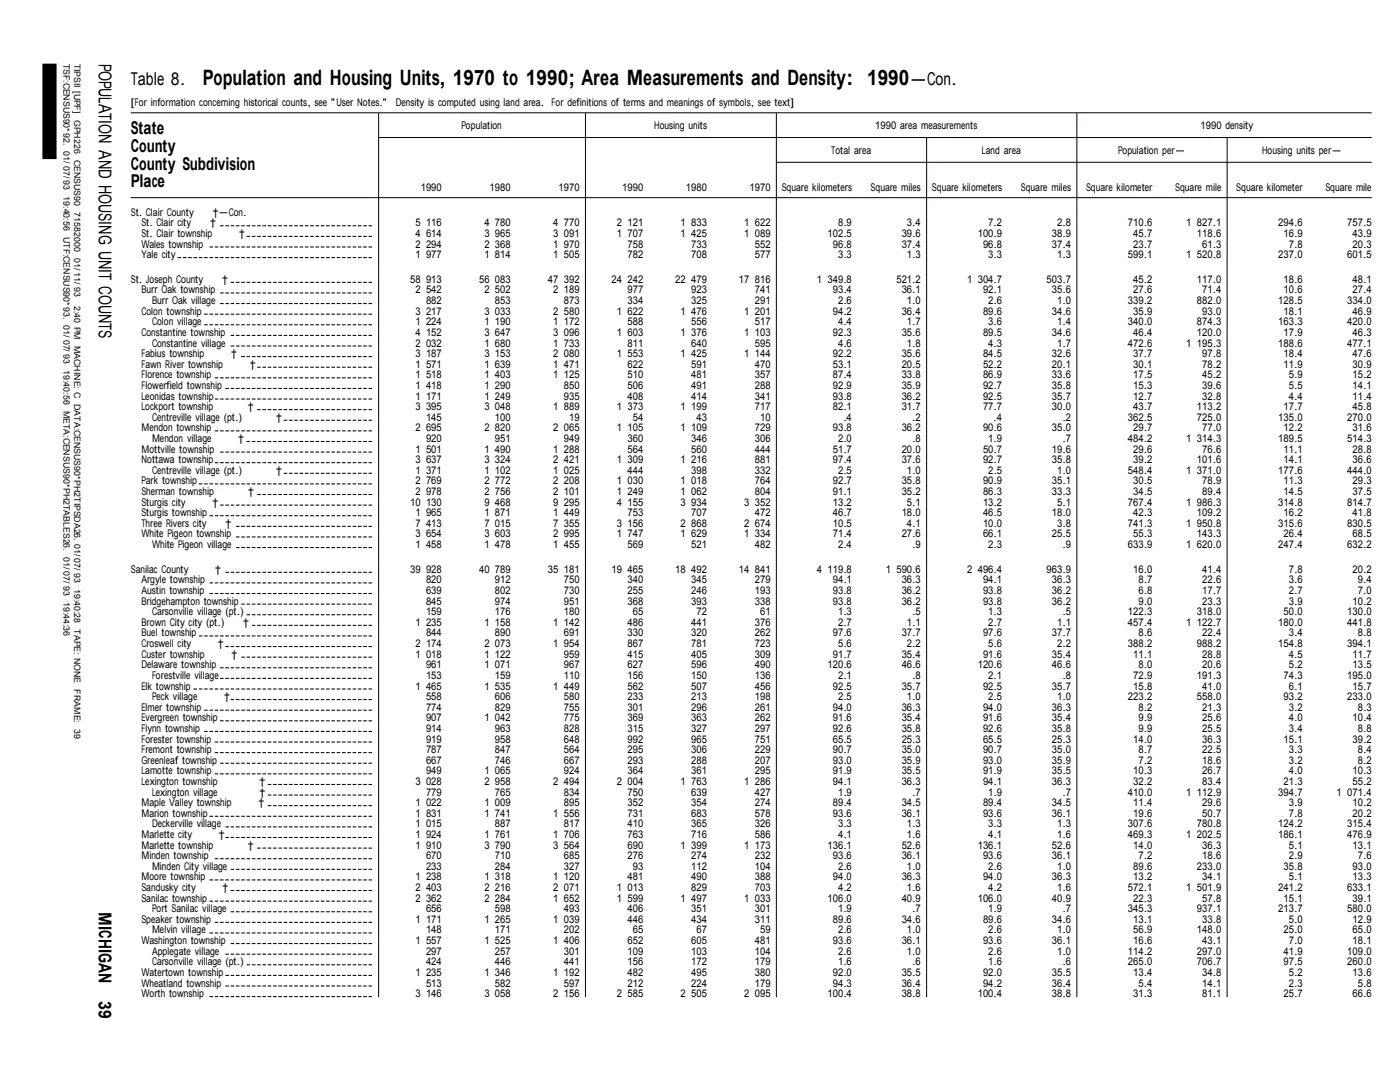
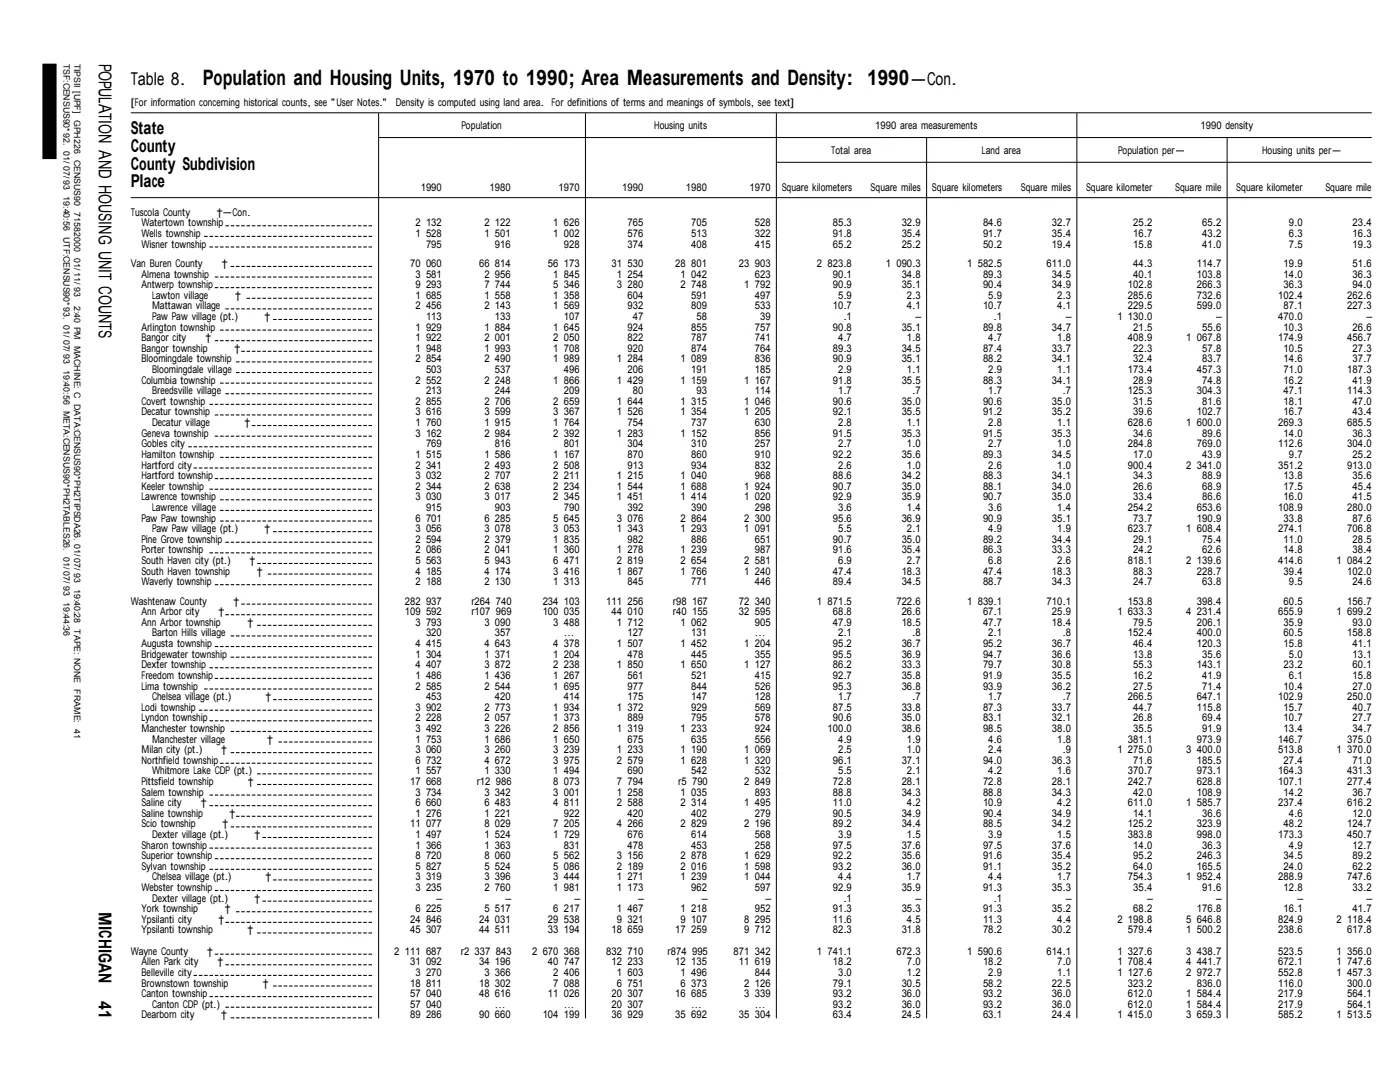
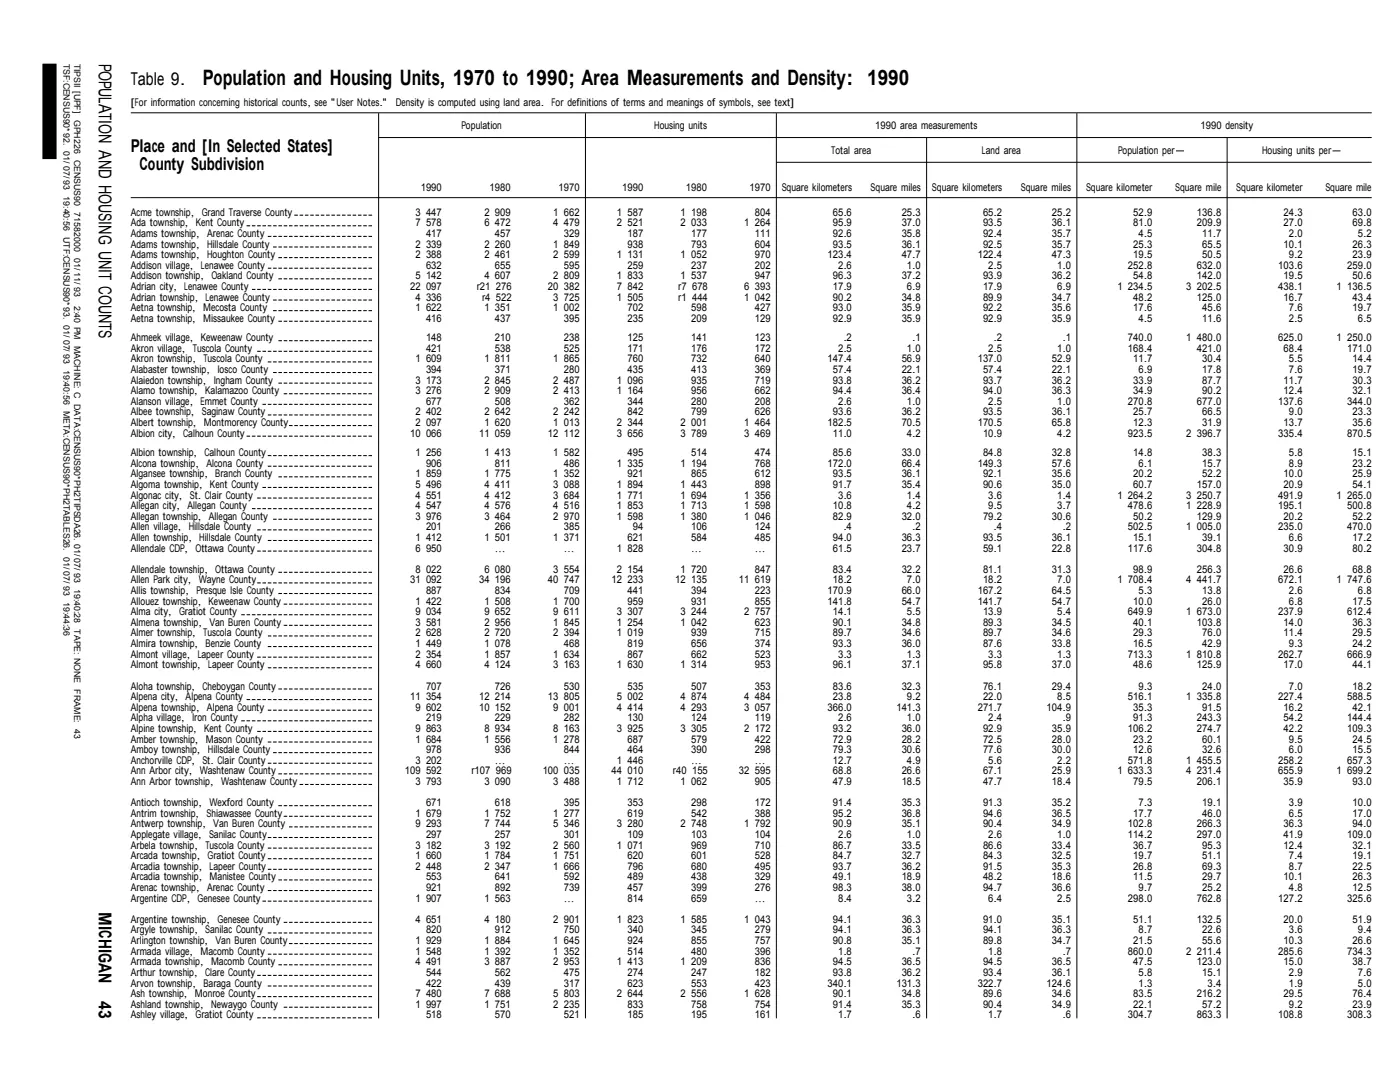
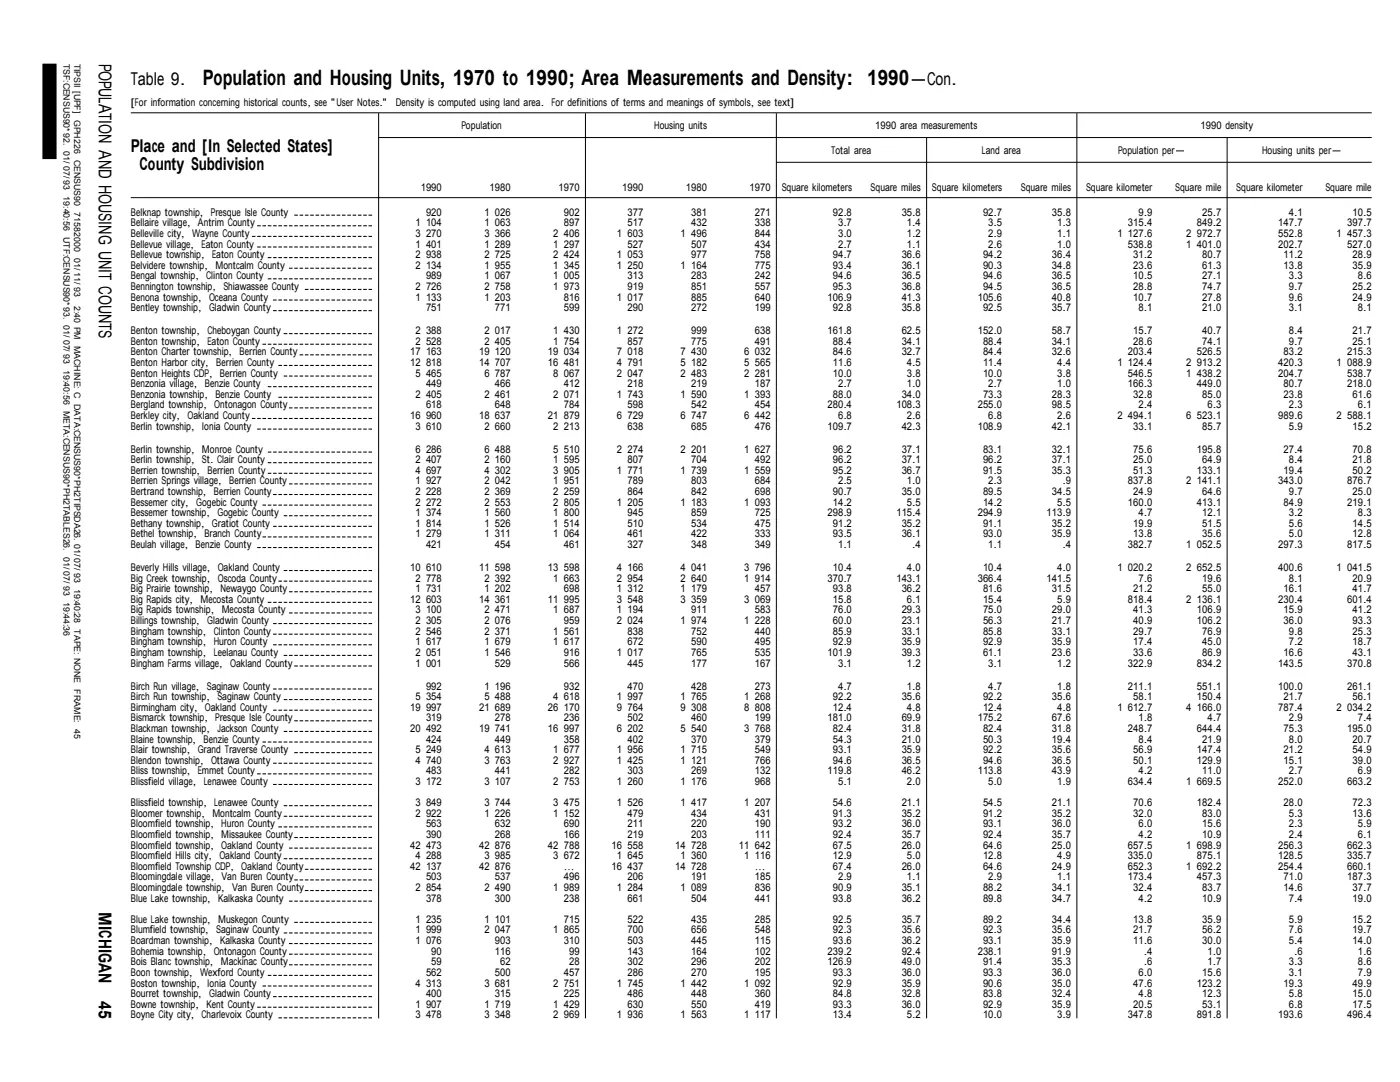
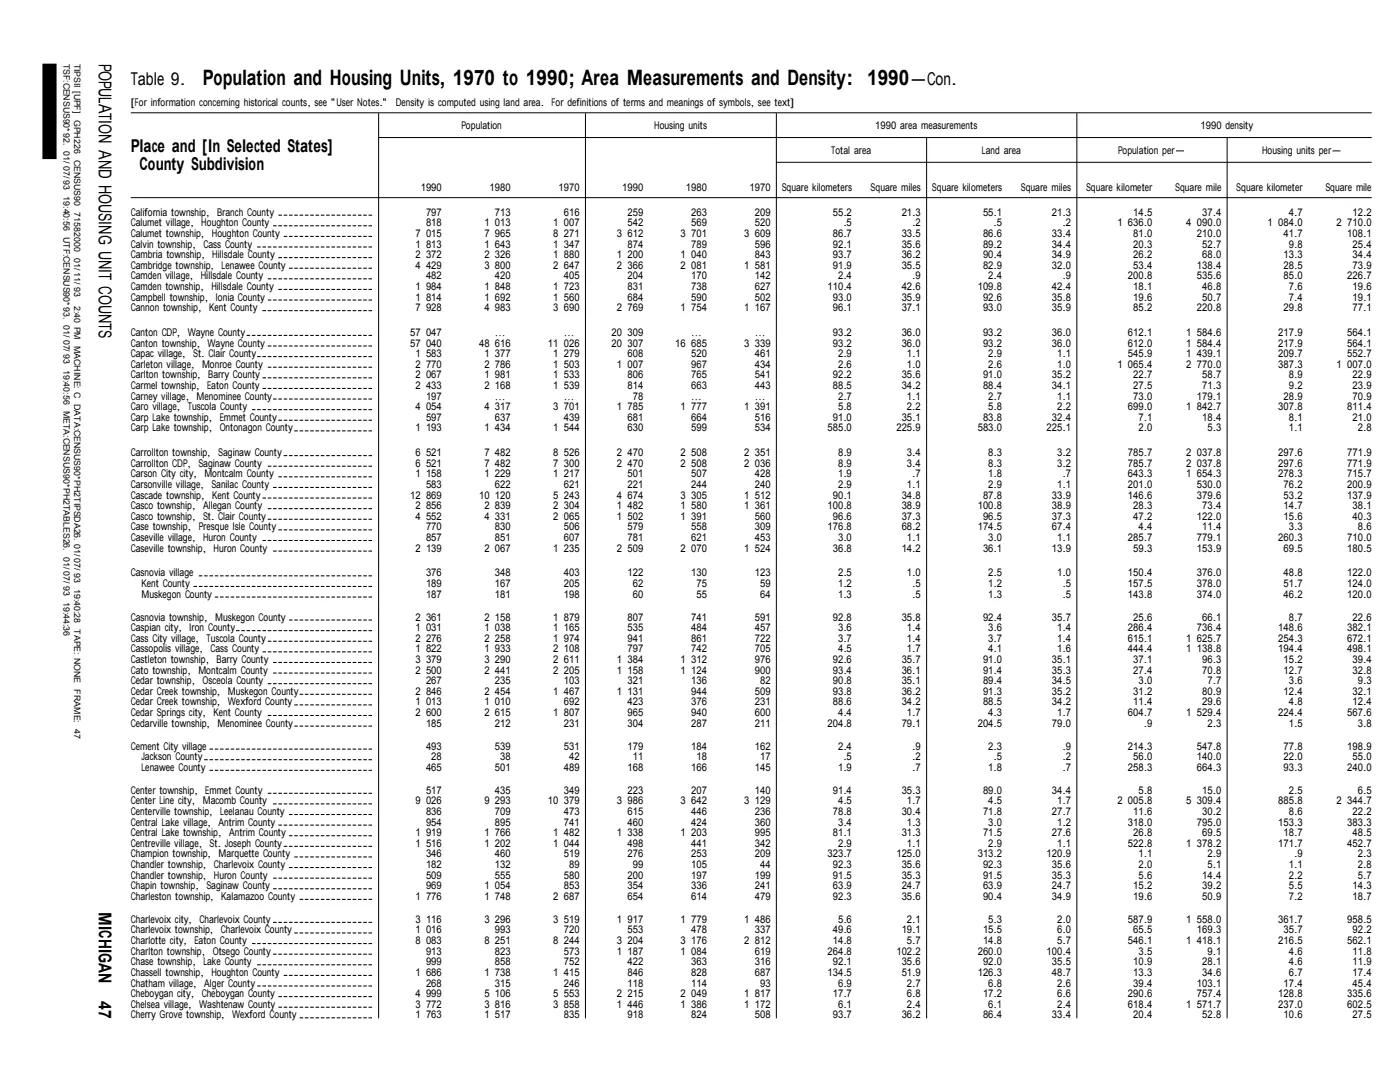
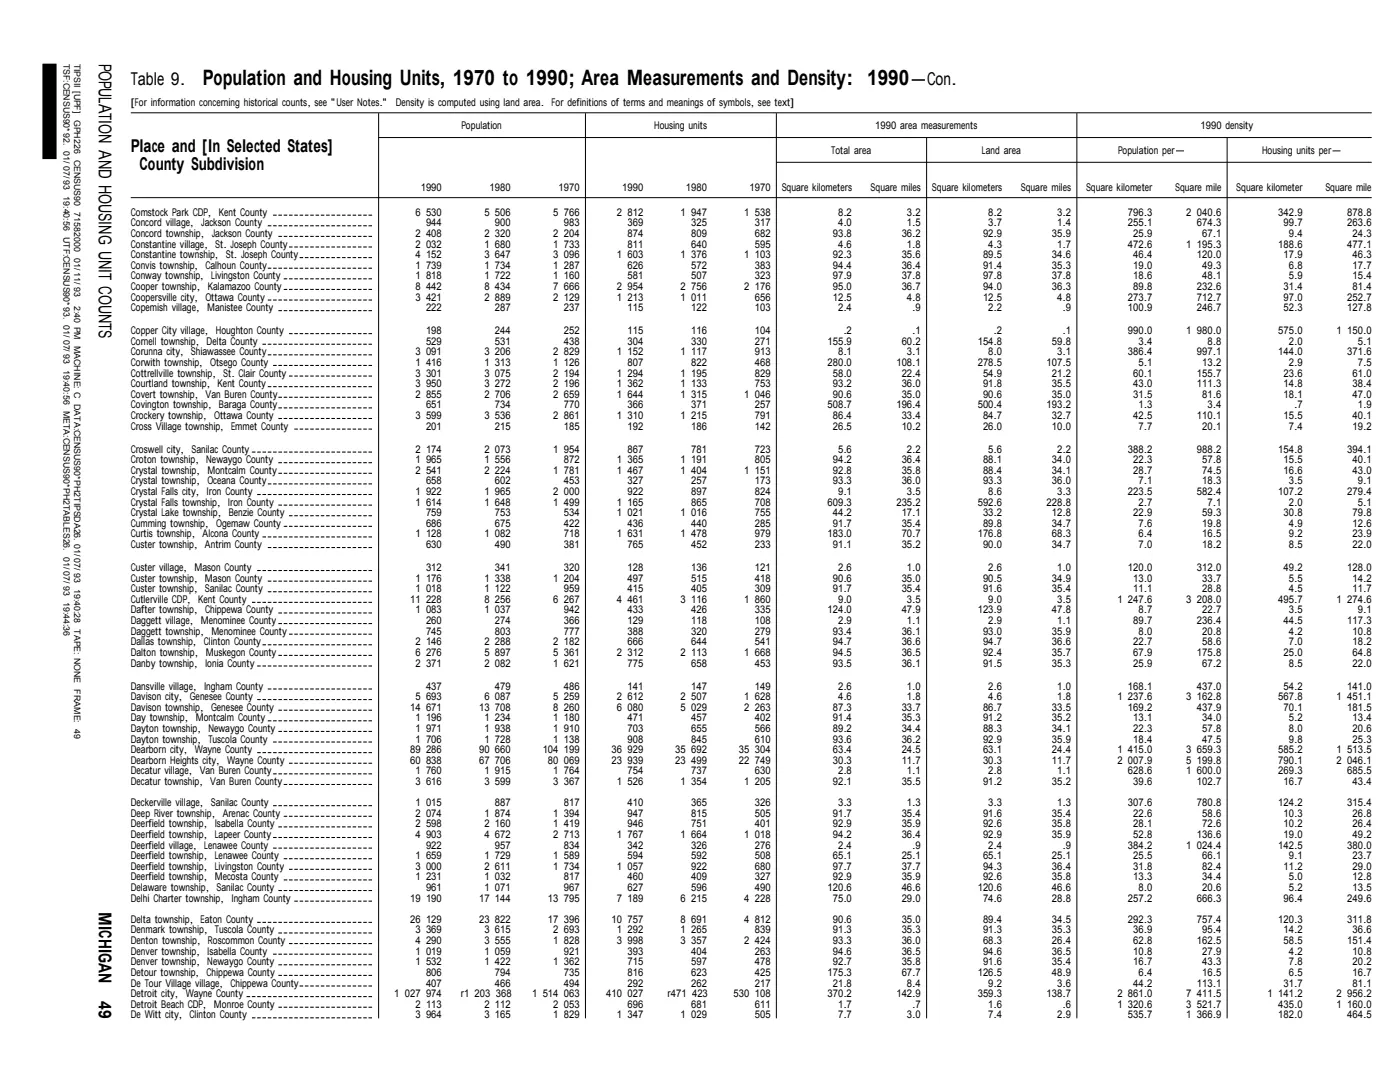
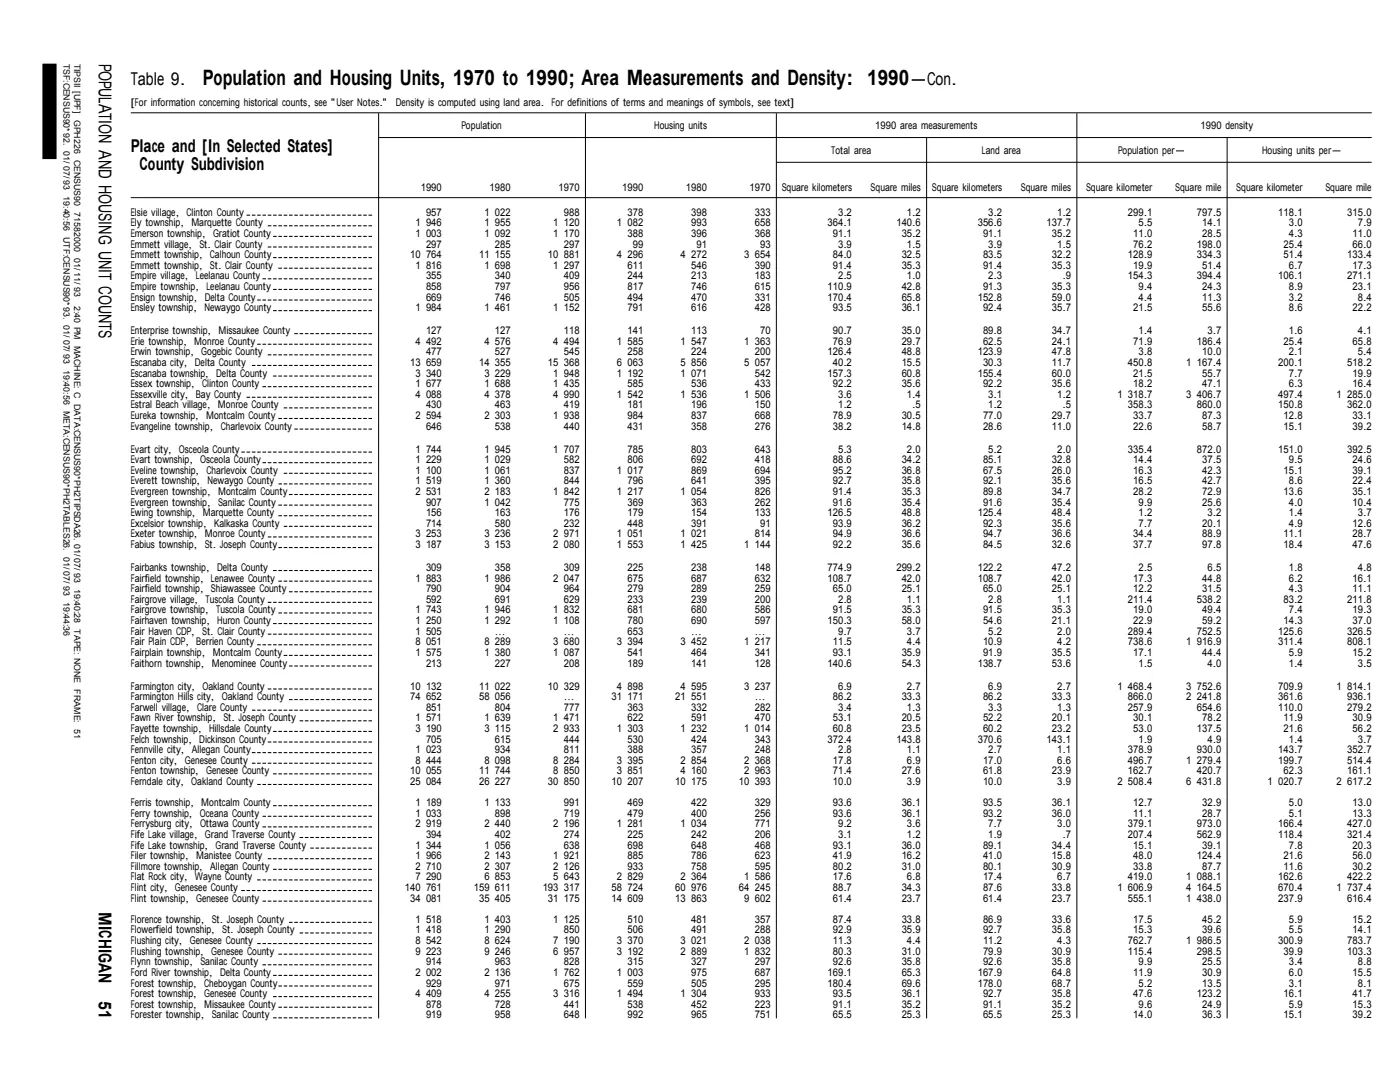
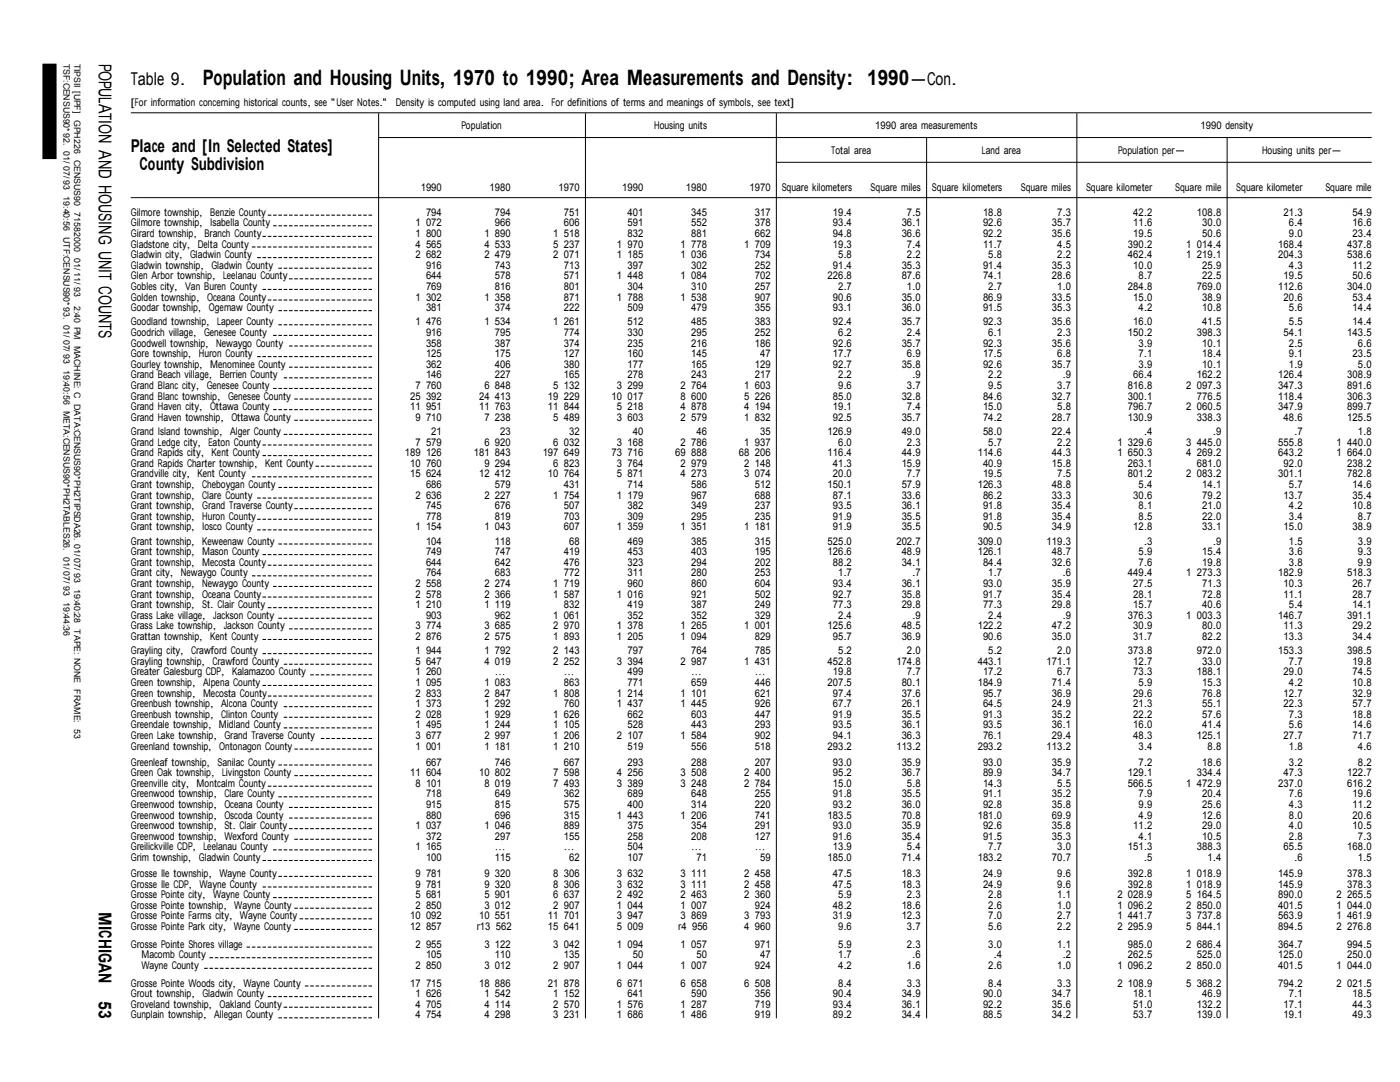
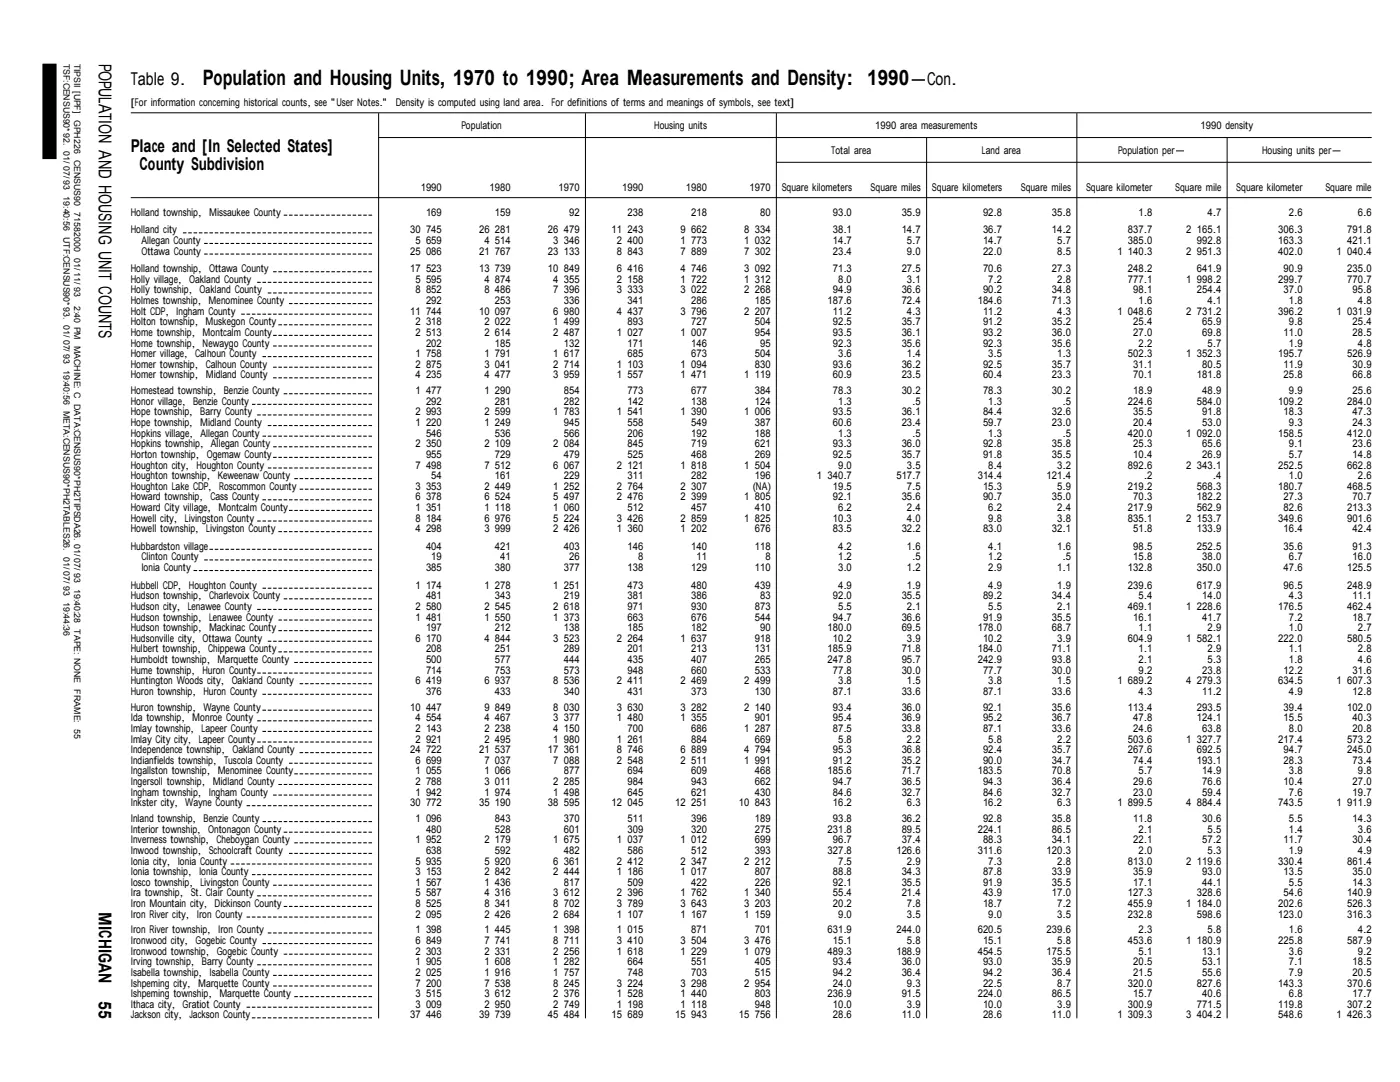
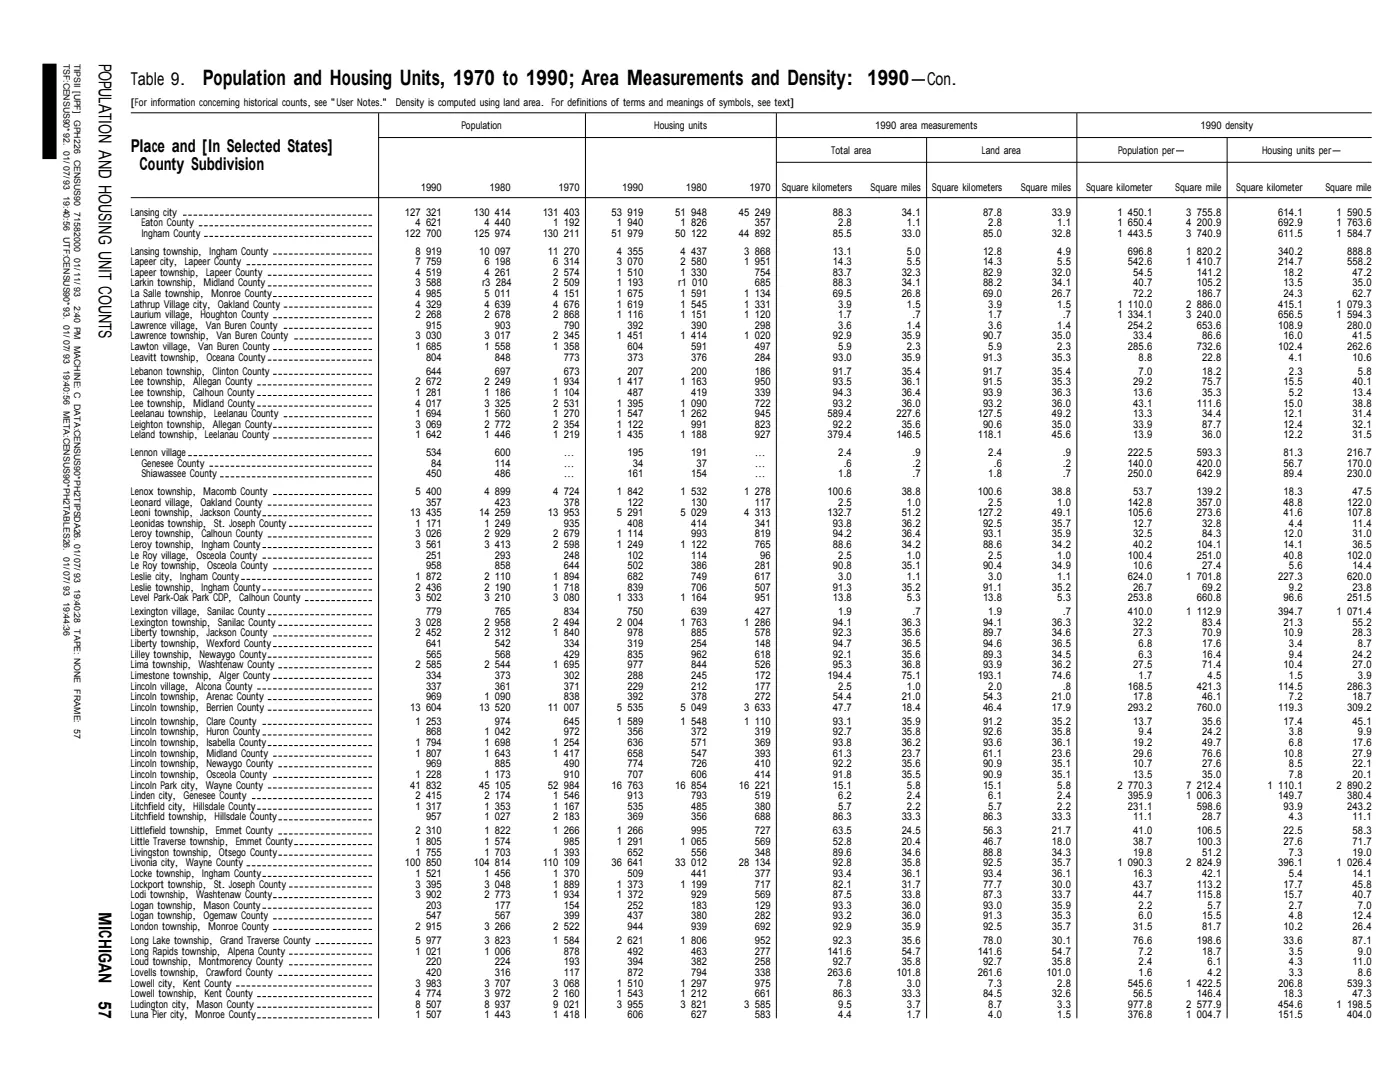
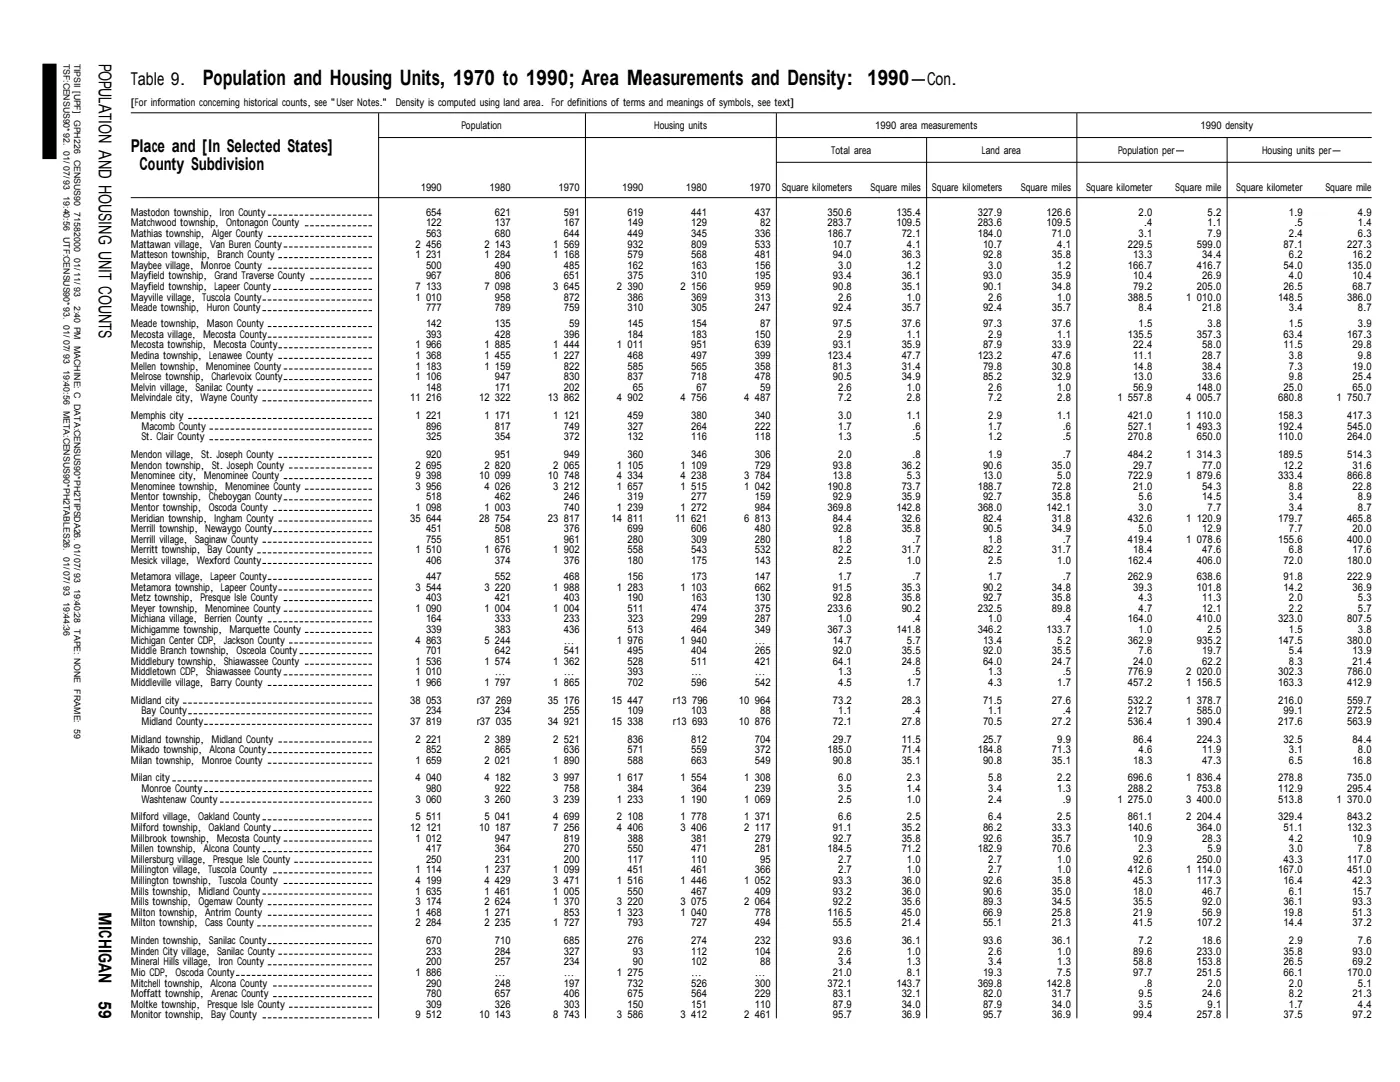
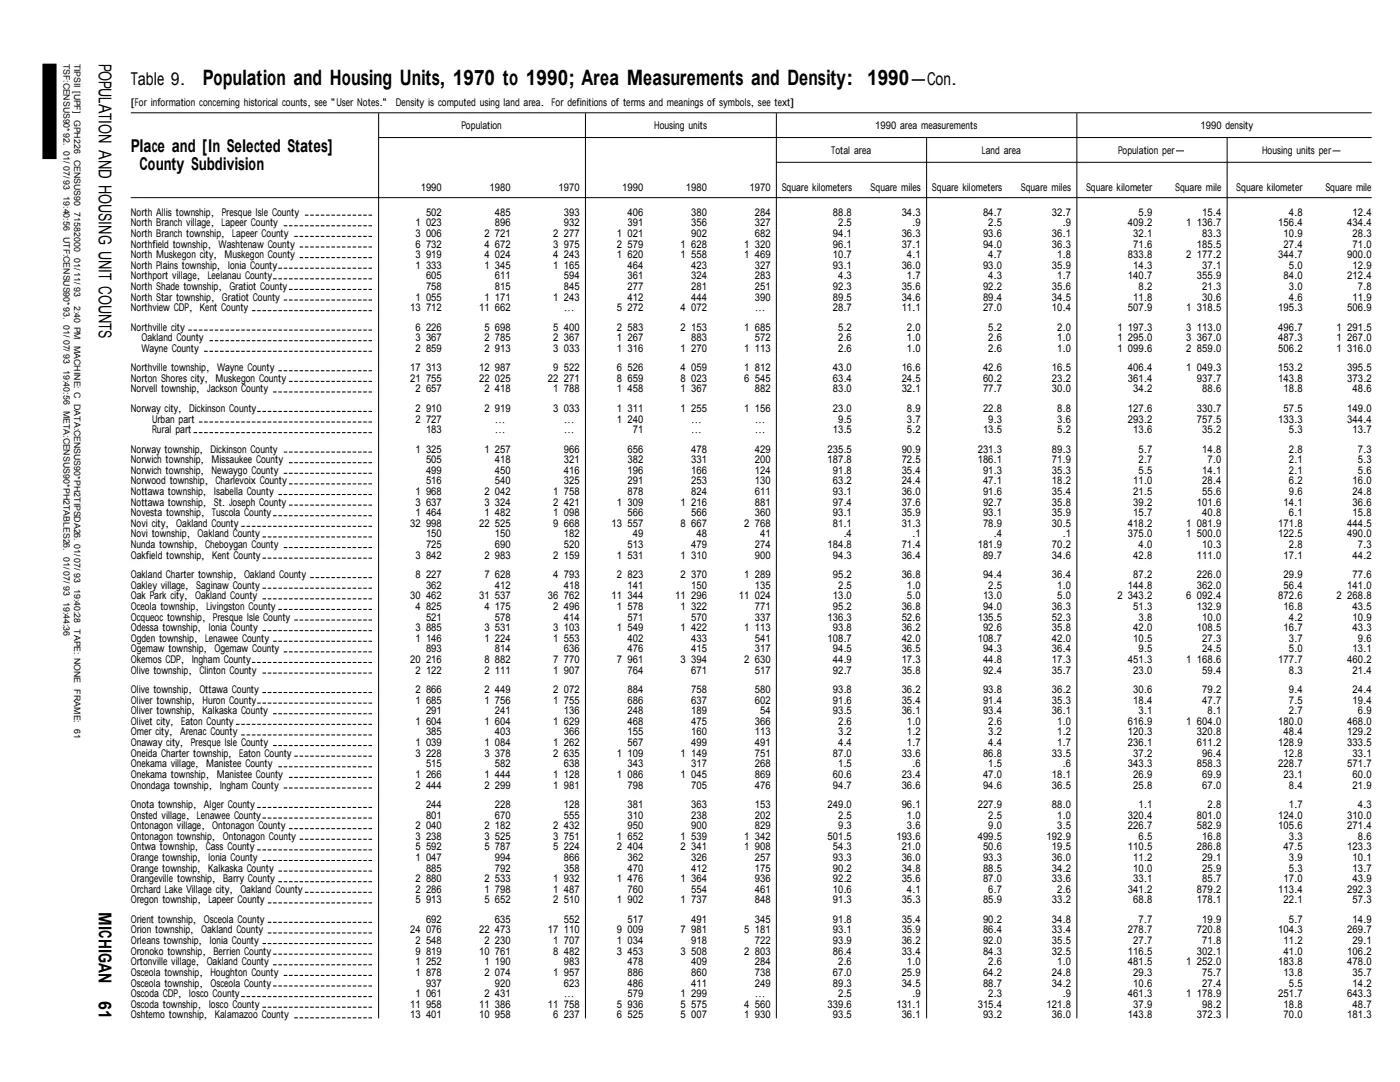
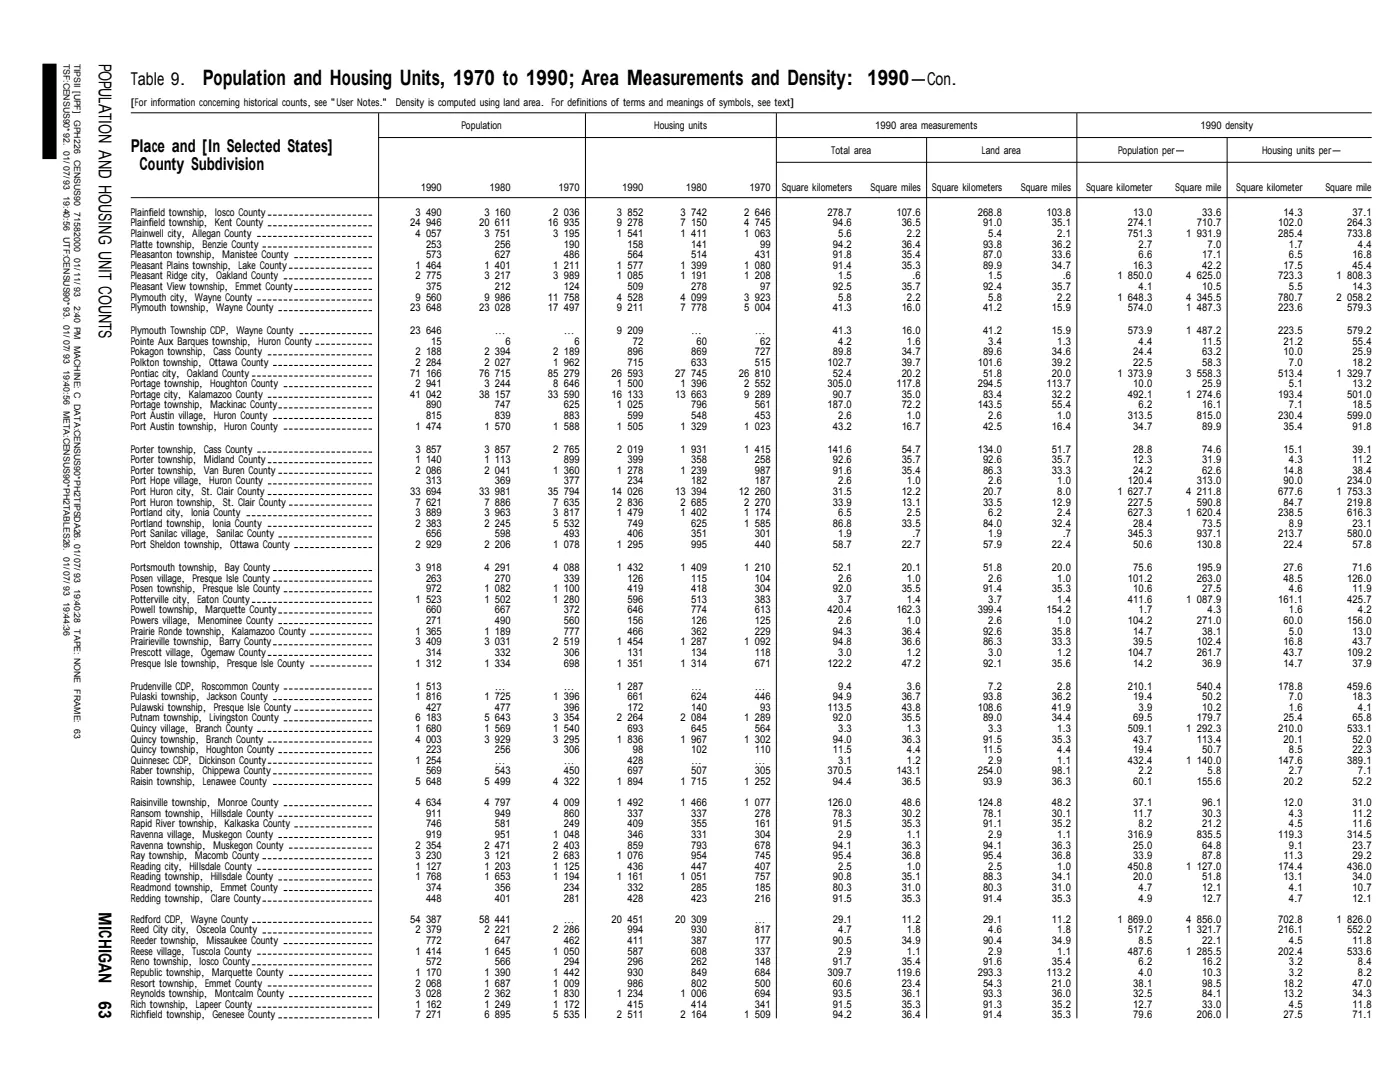
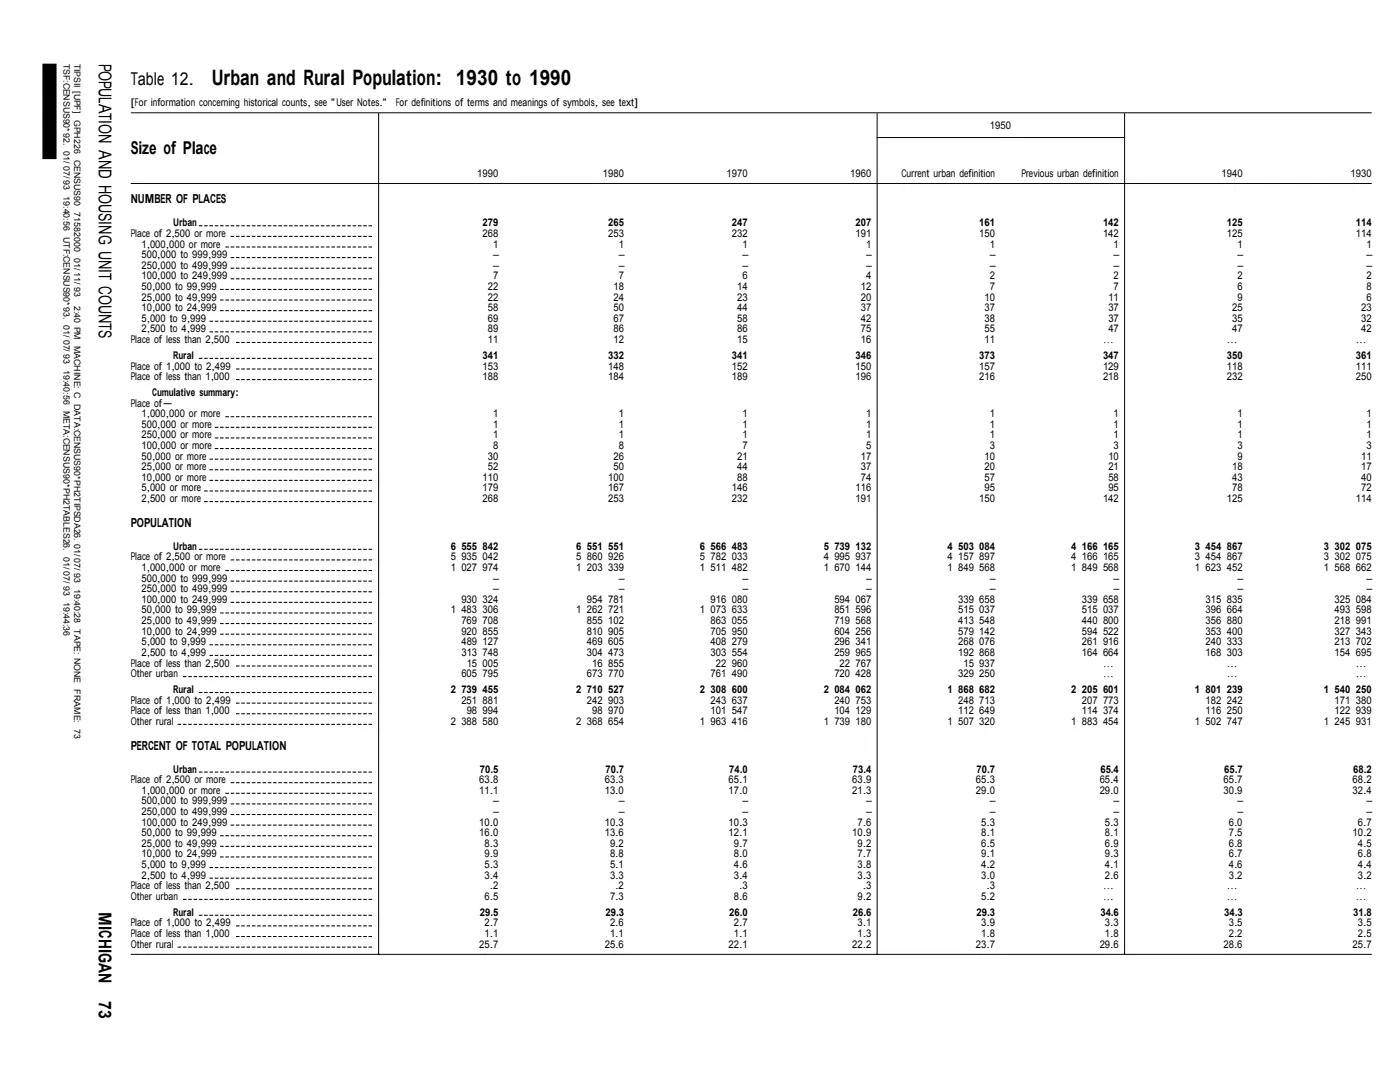
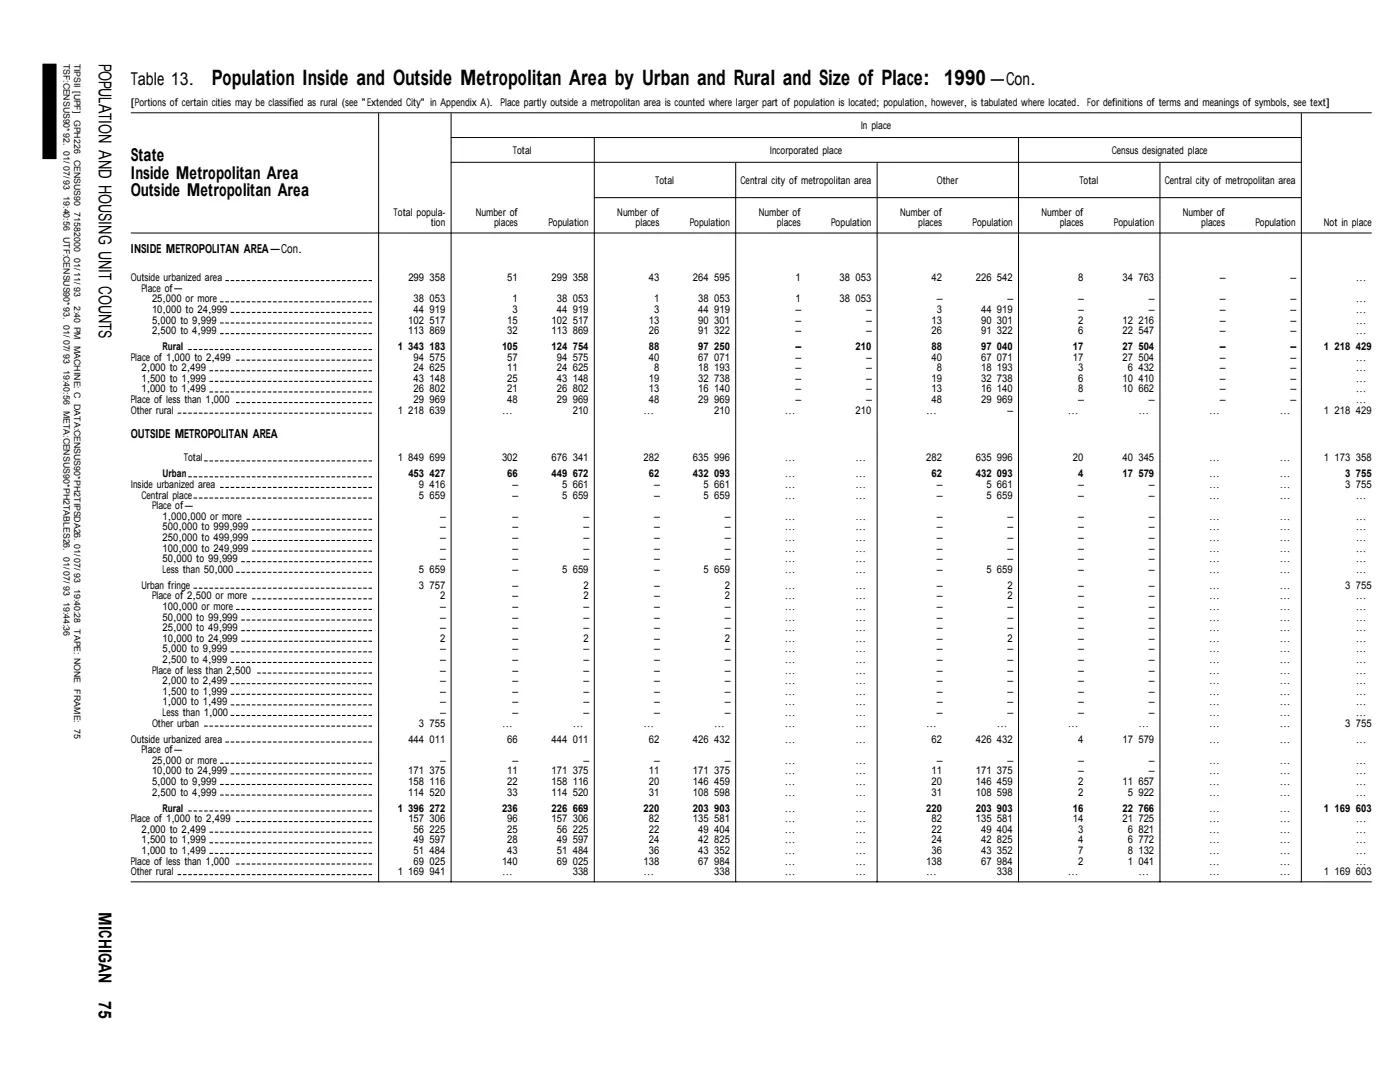
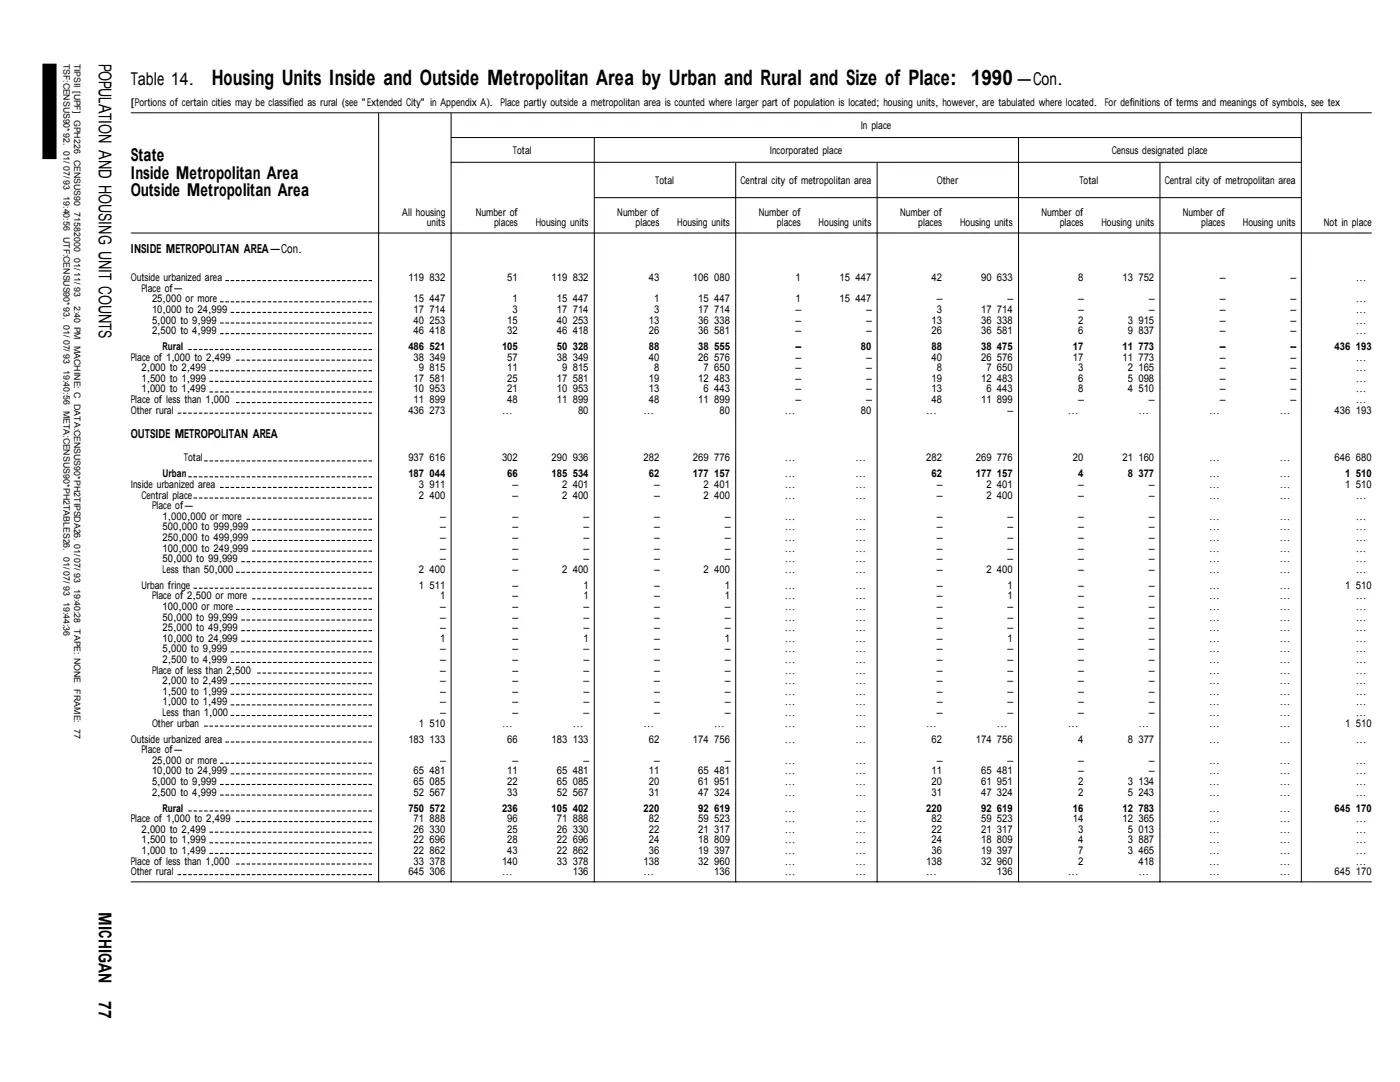
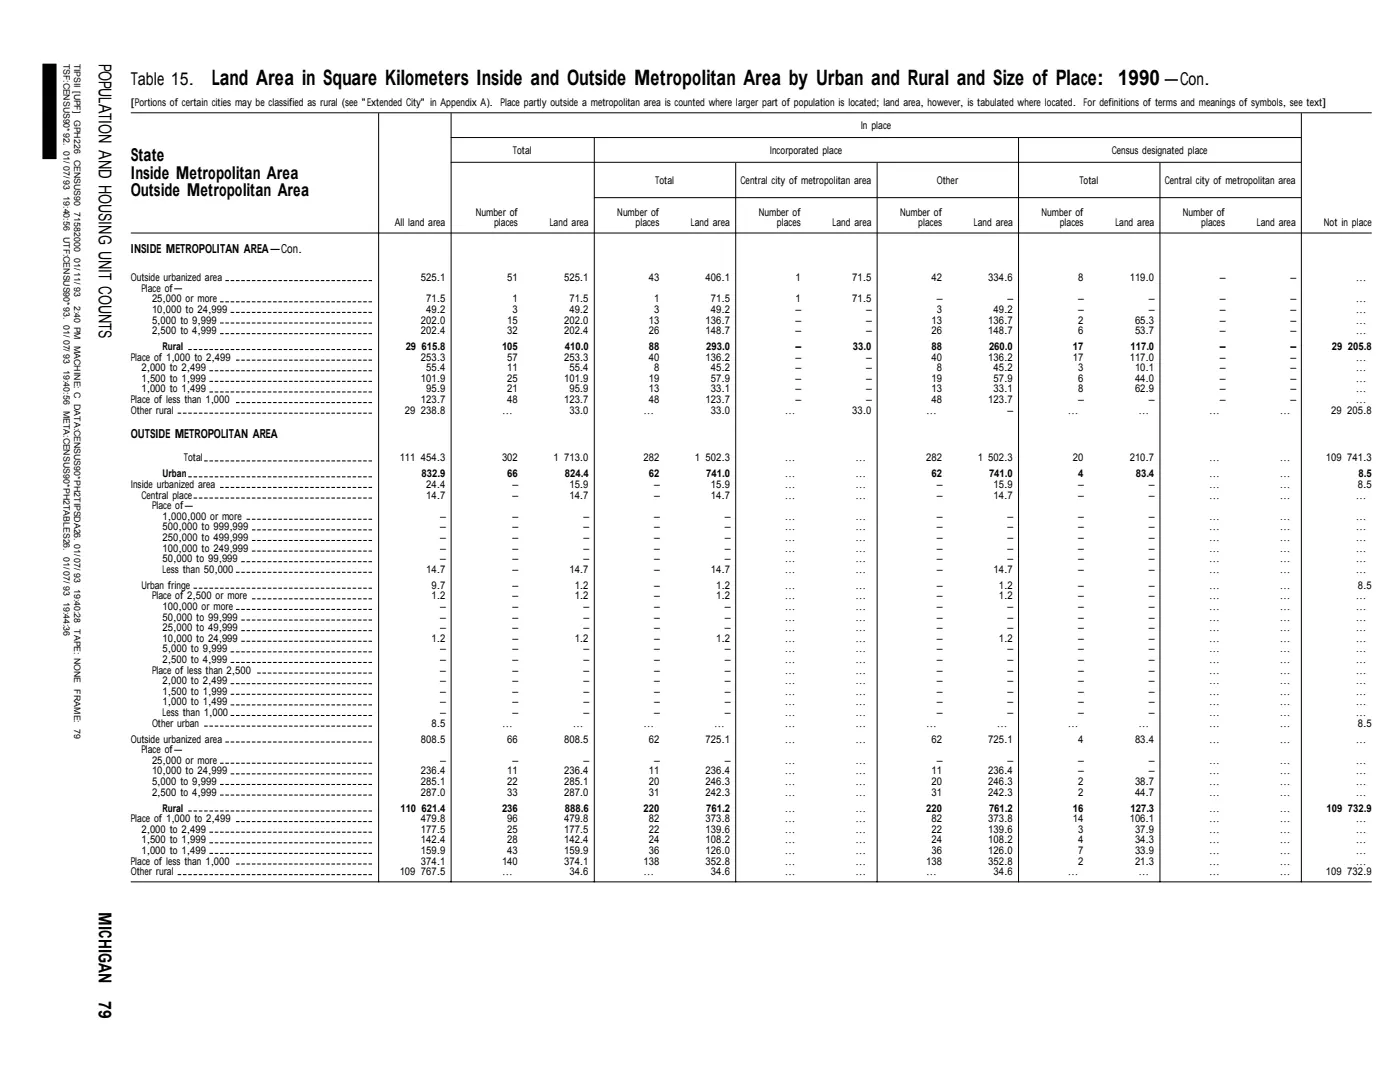
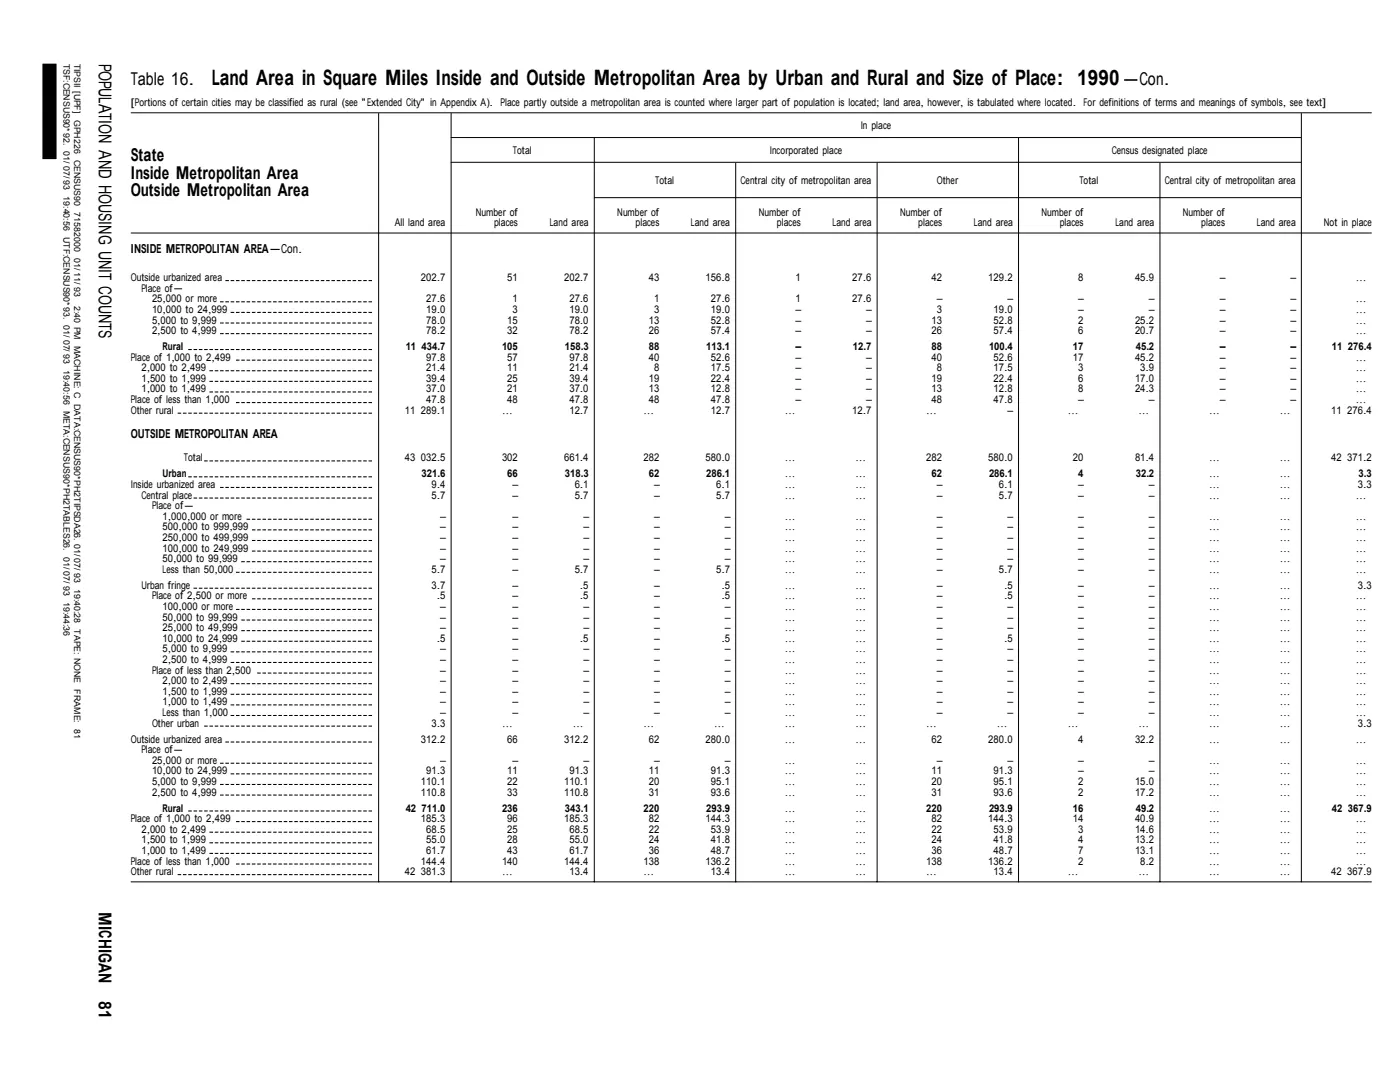
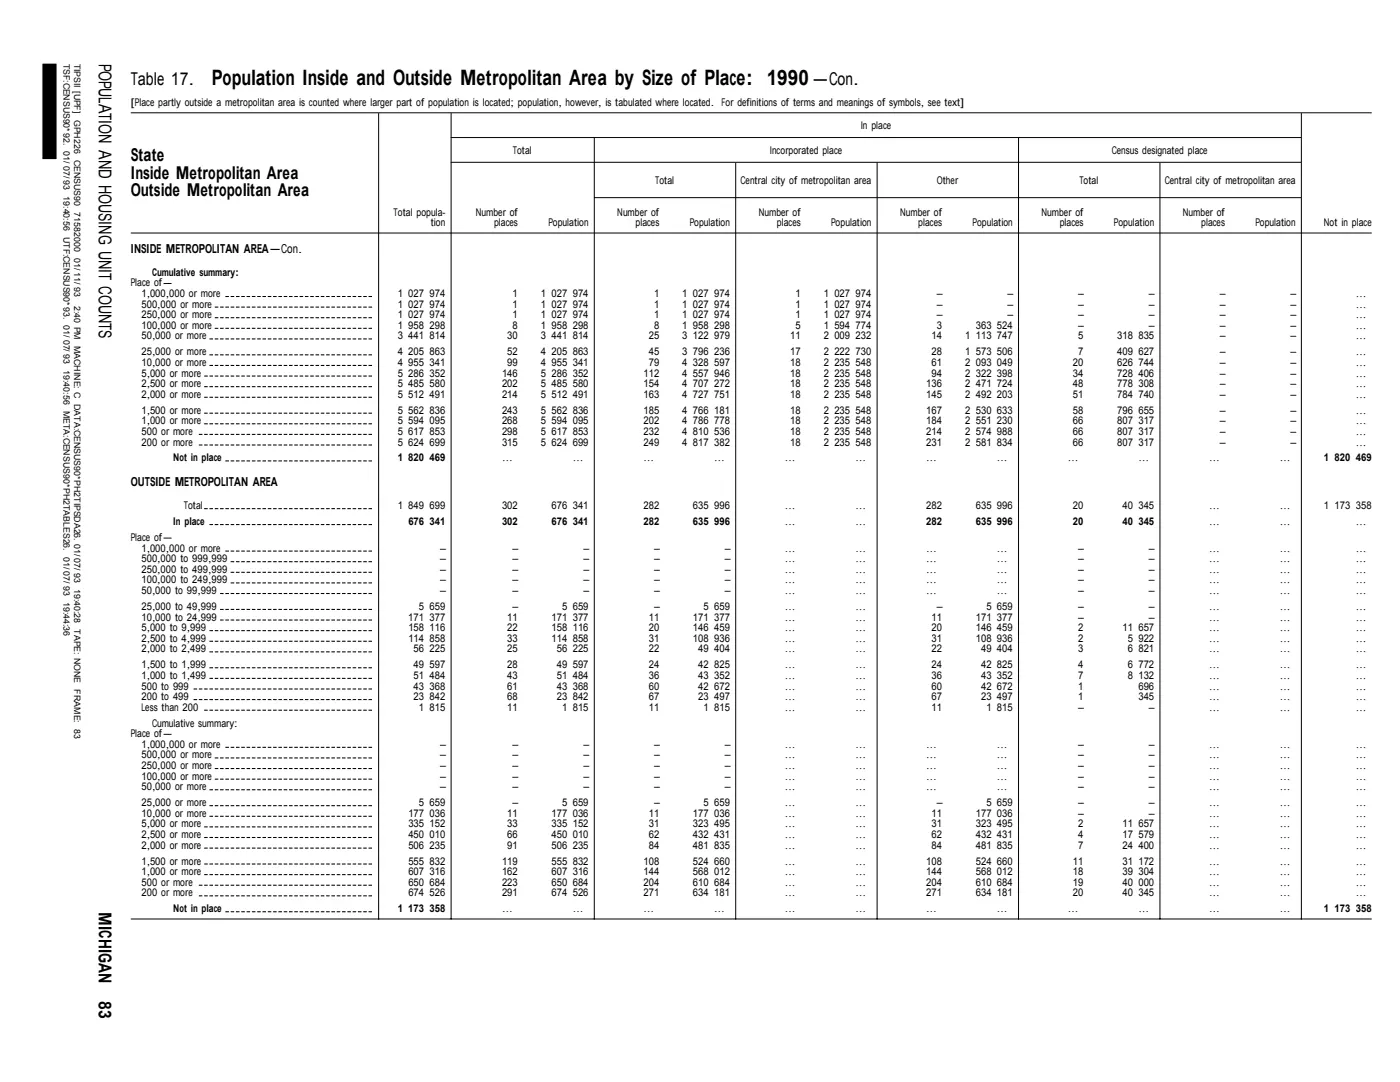
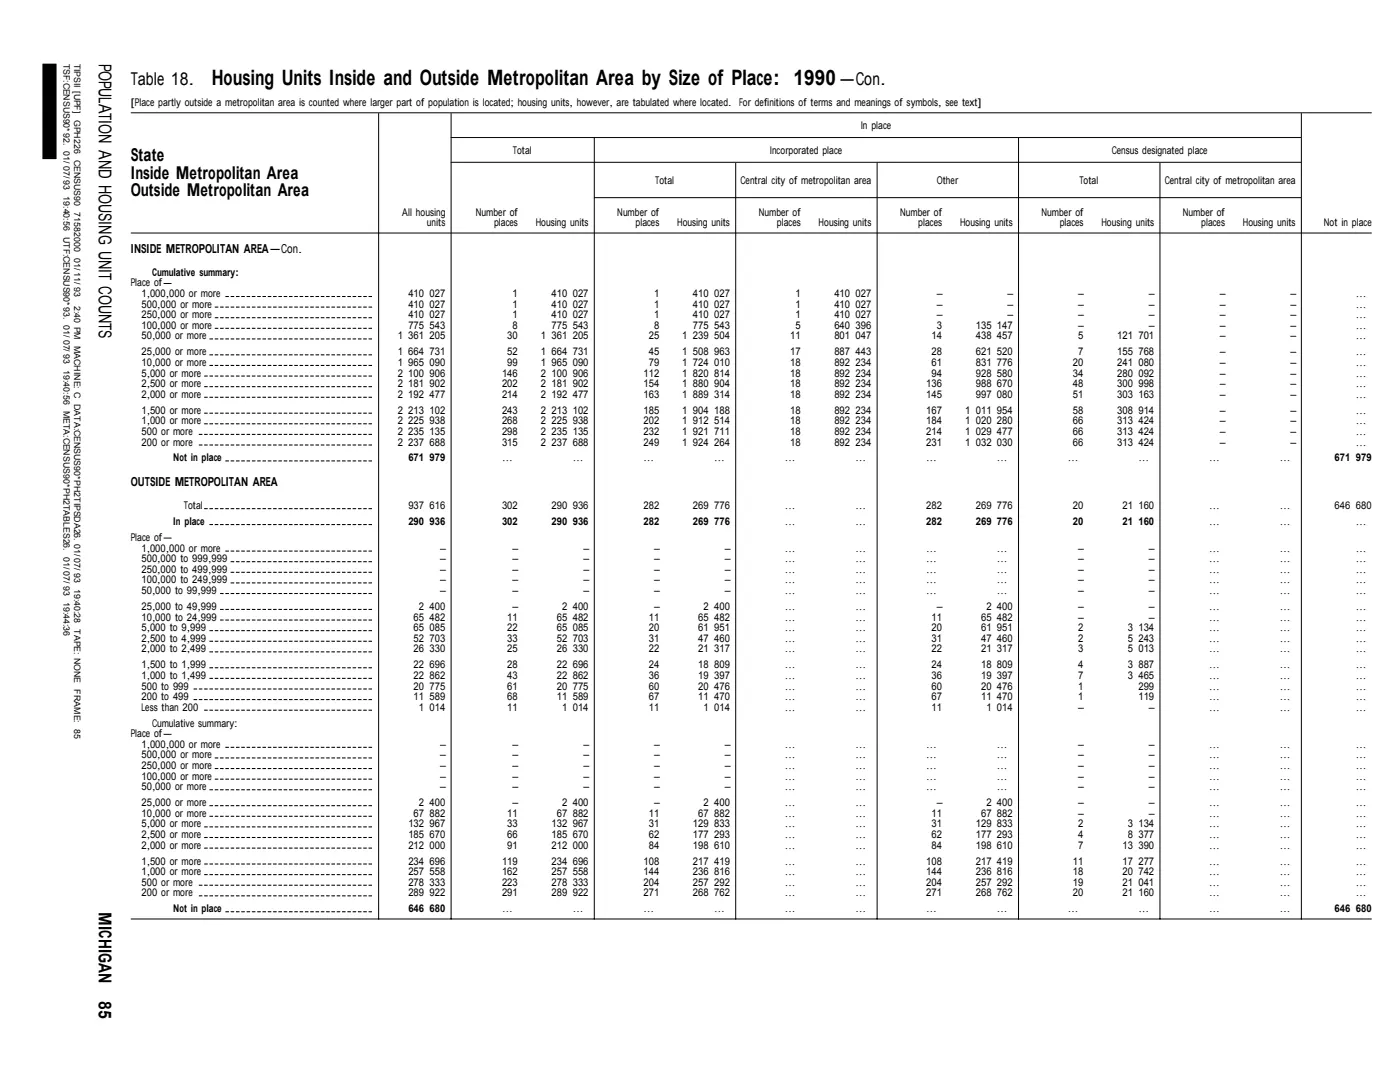
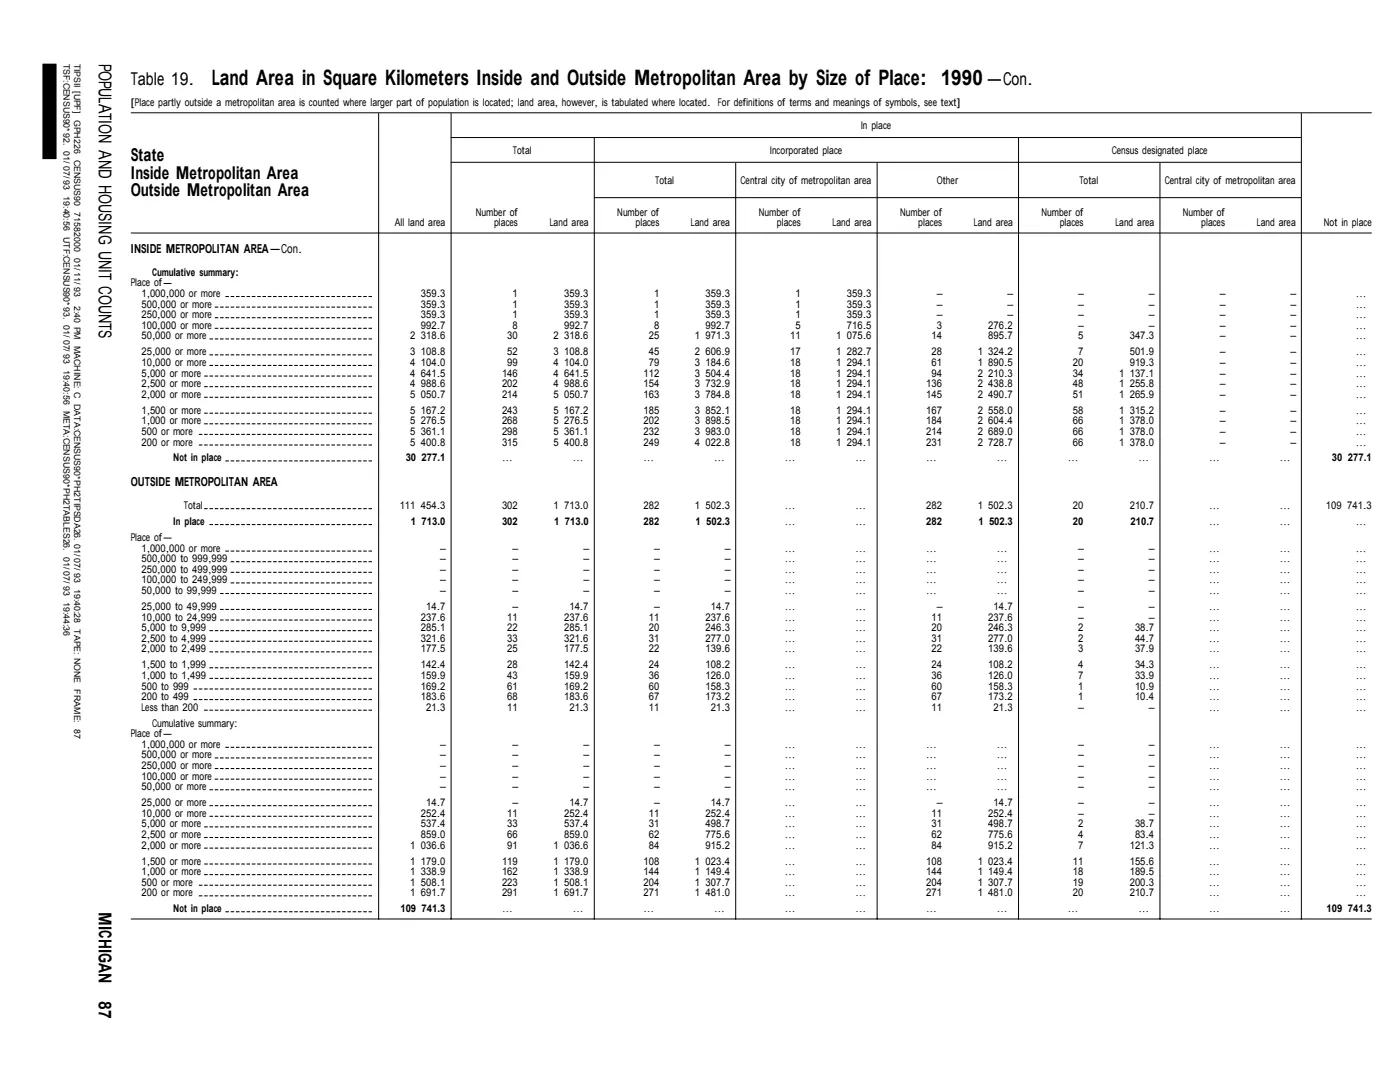
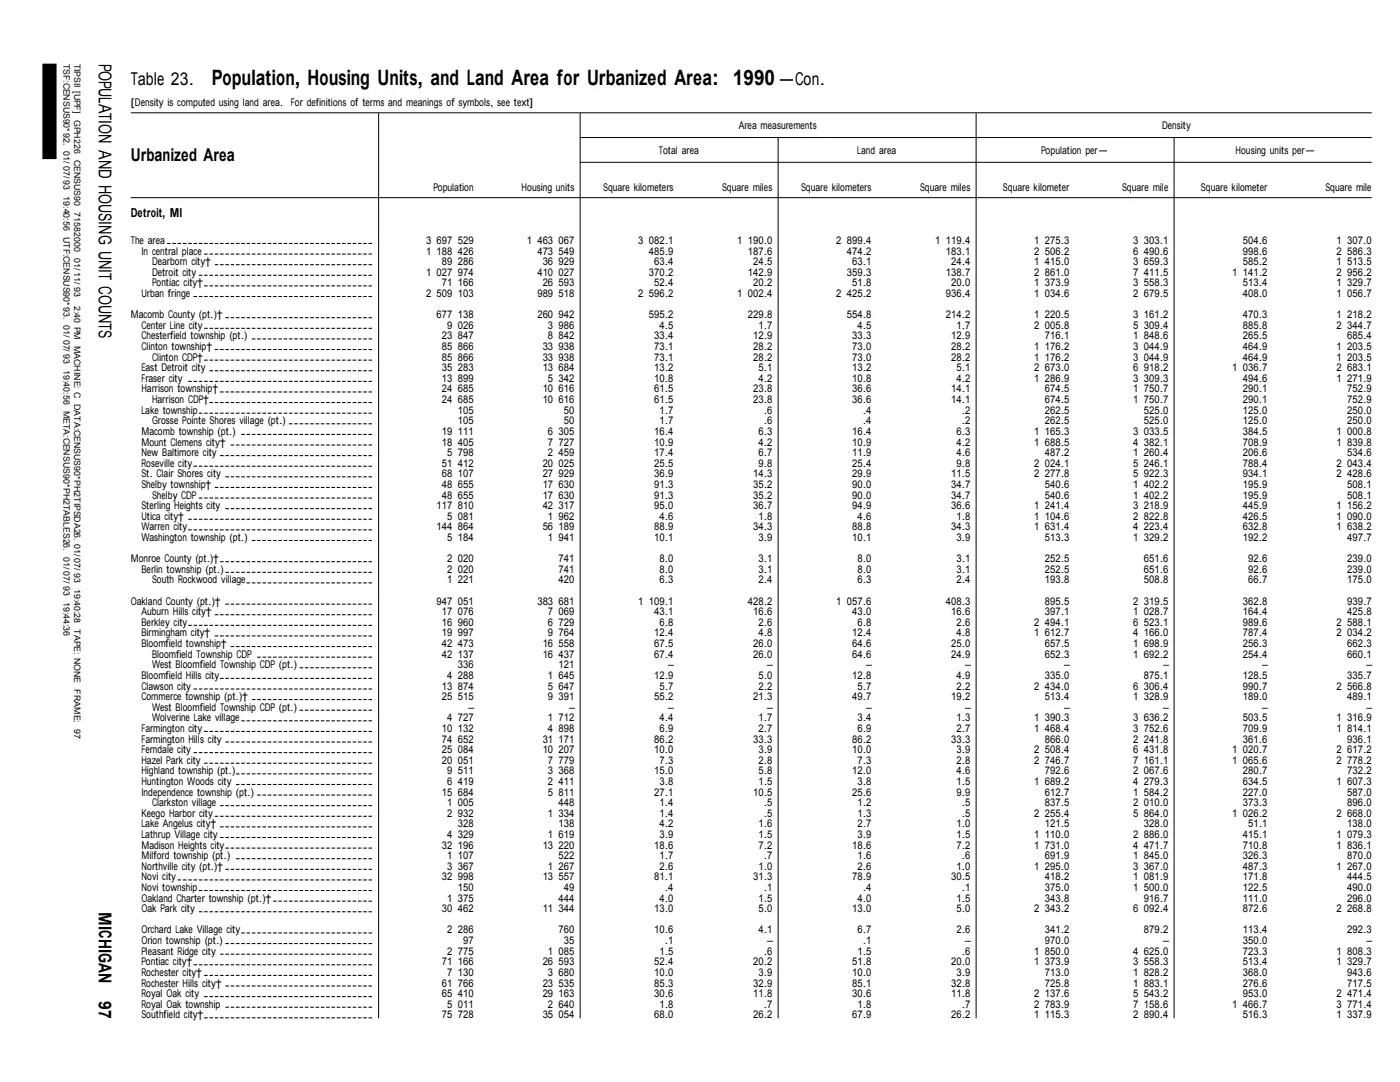
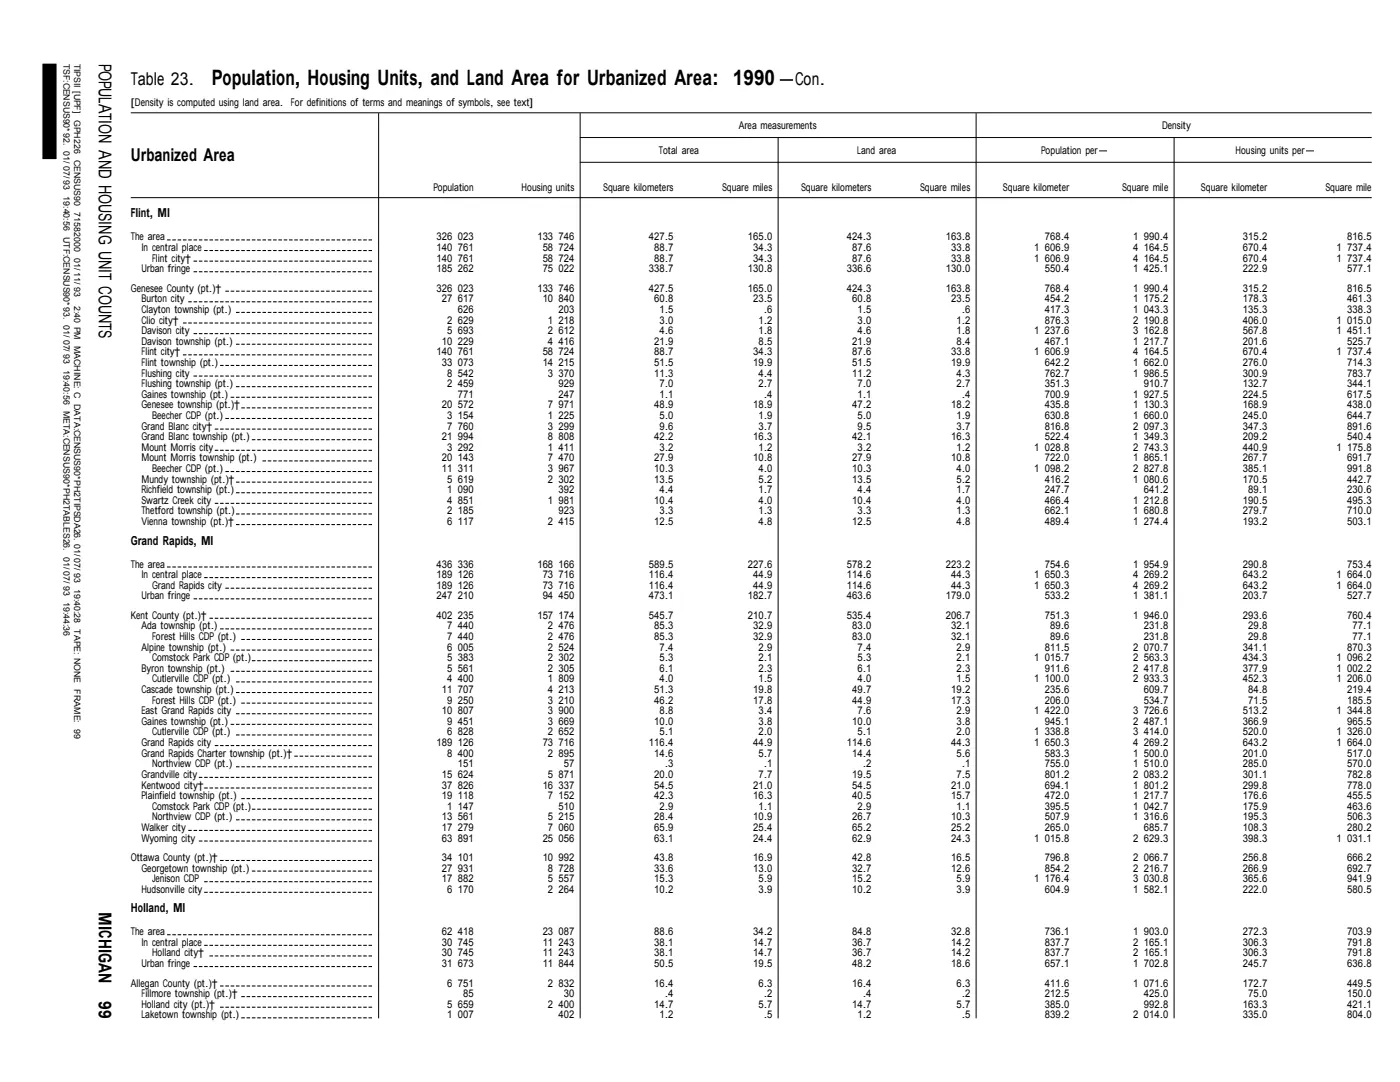
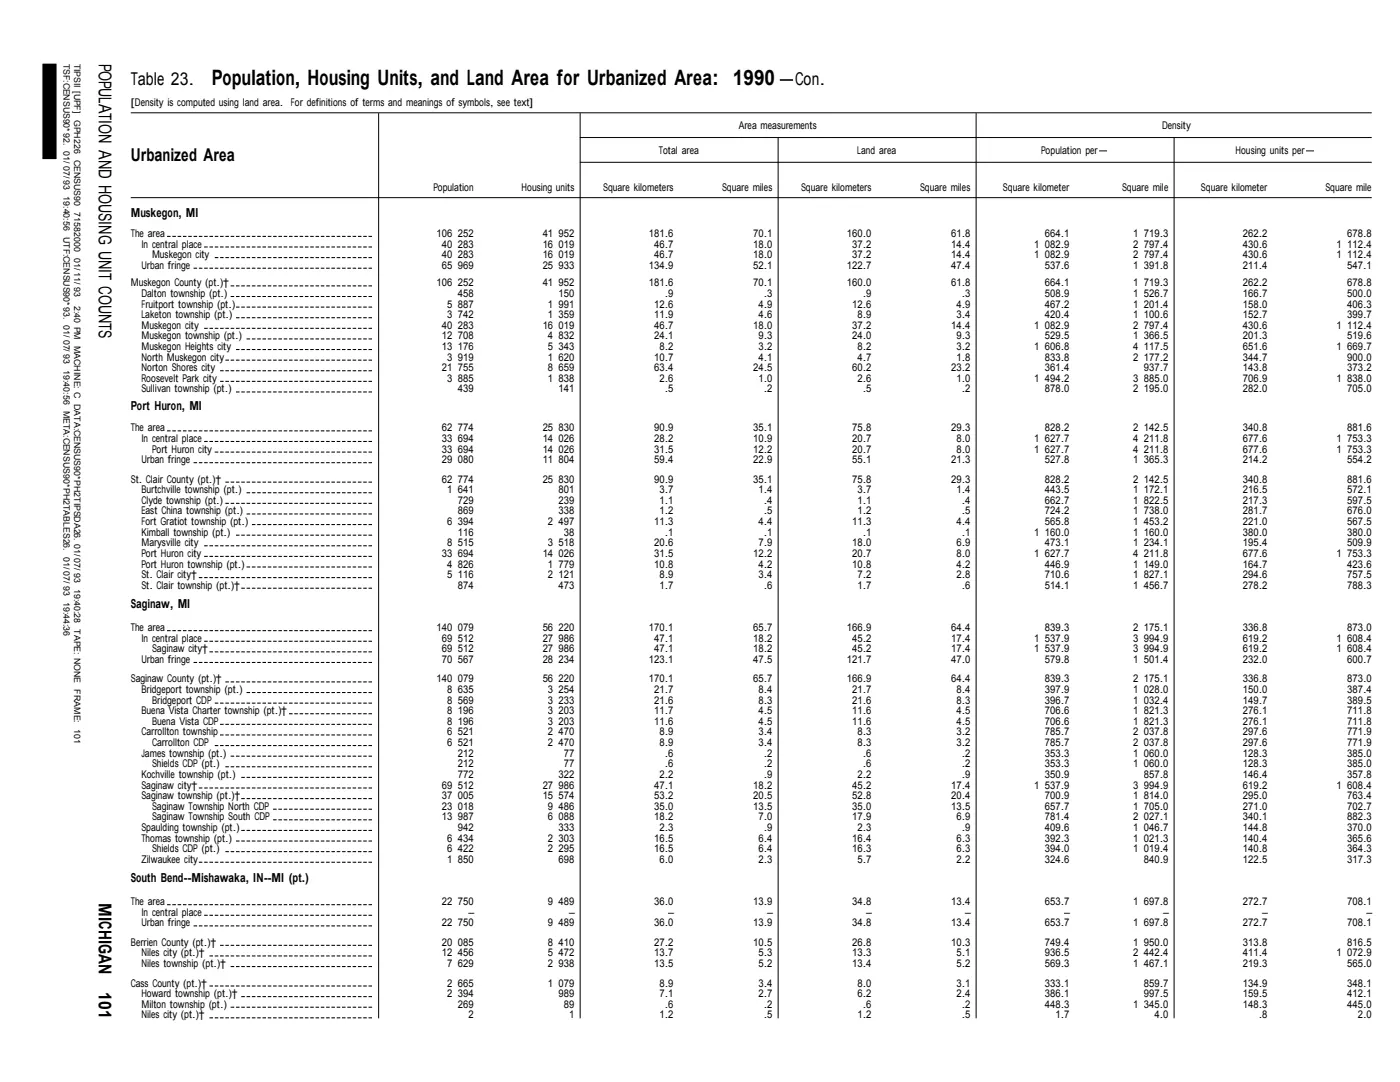
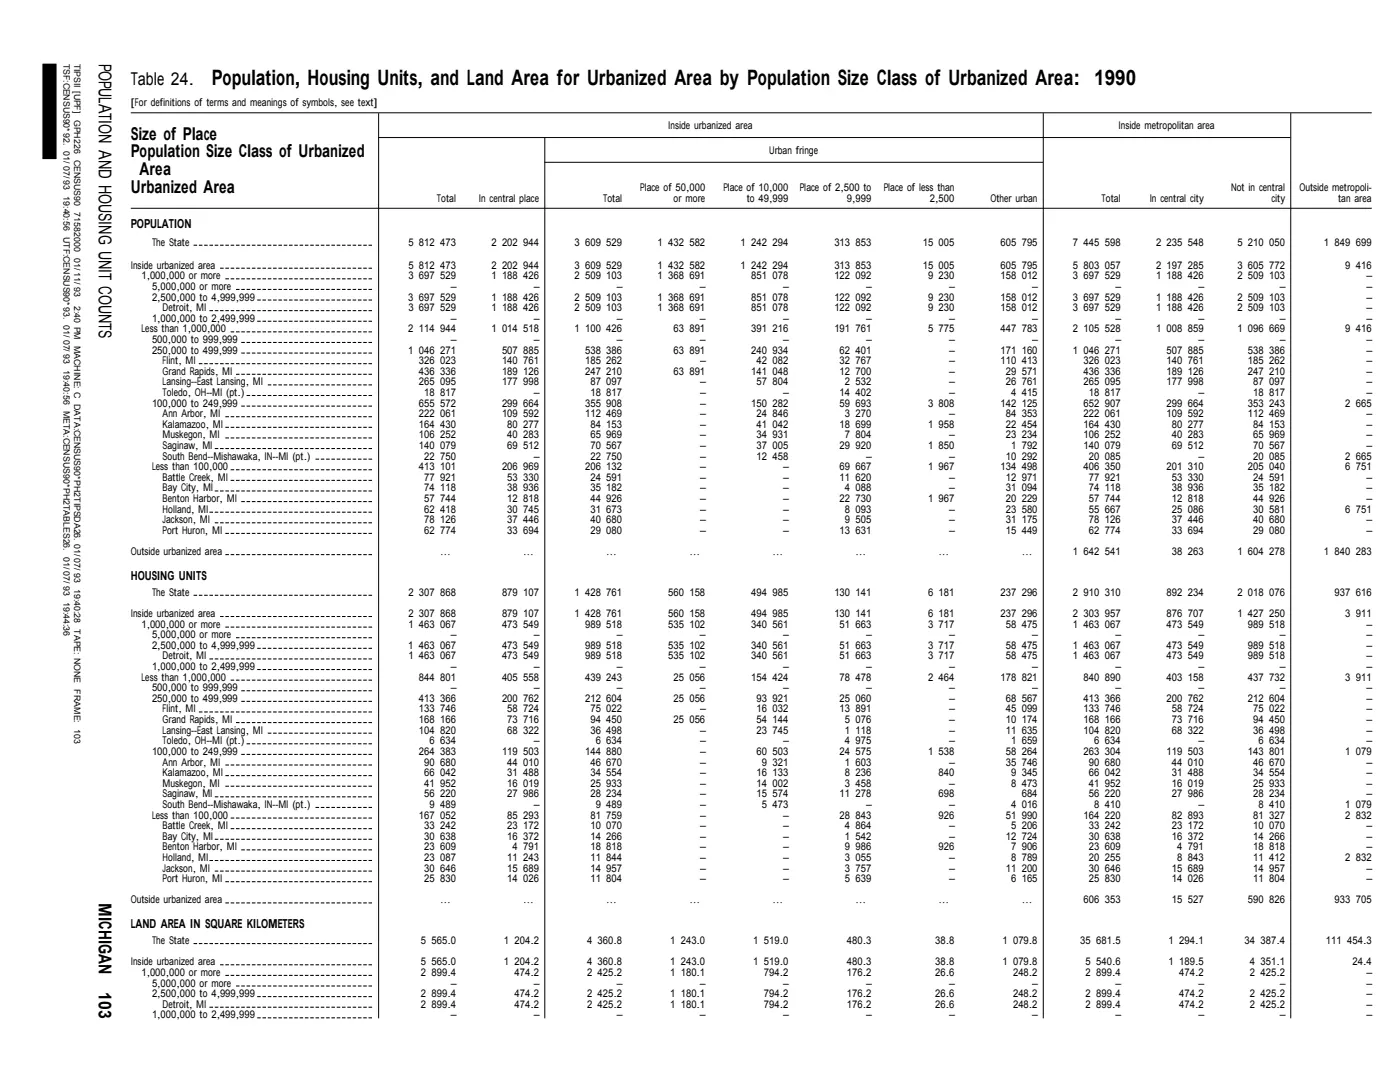

106 of 164 pages linked here — every page to 32, then every 2th, then the last 16. With JavaScript, every page.
Sources
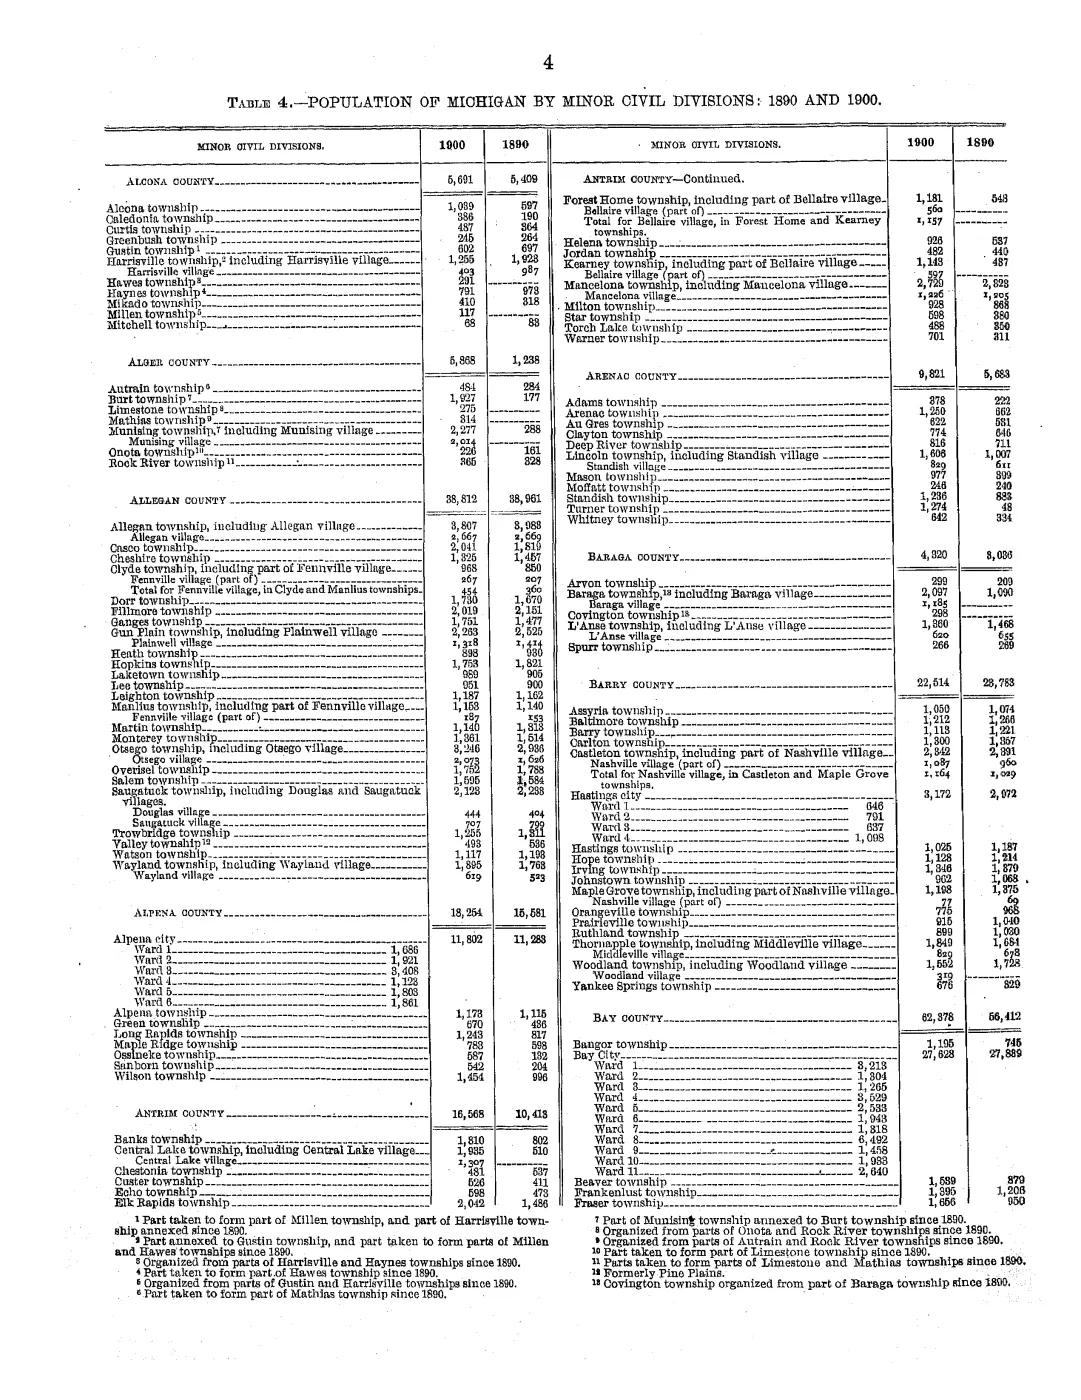
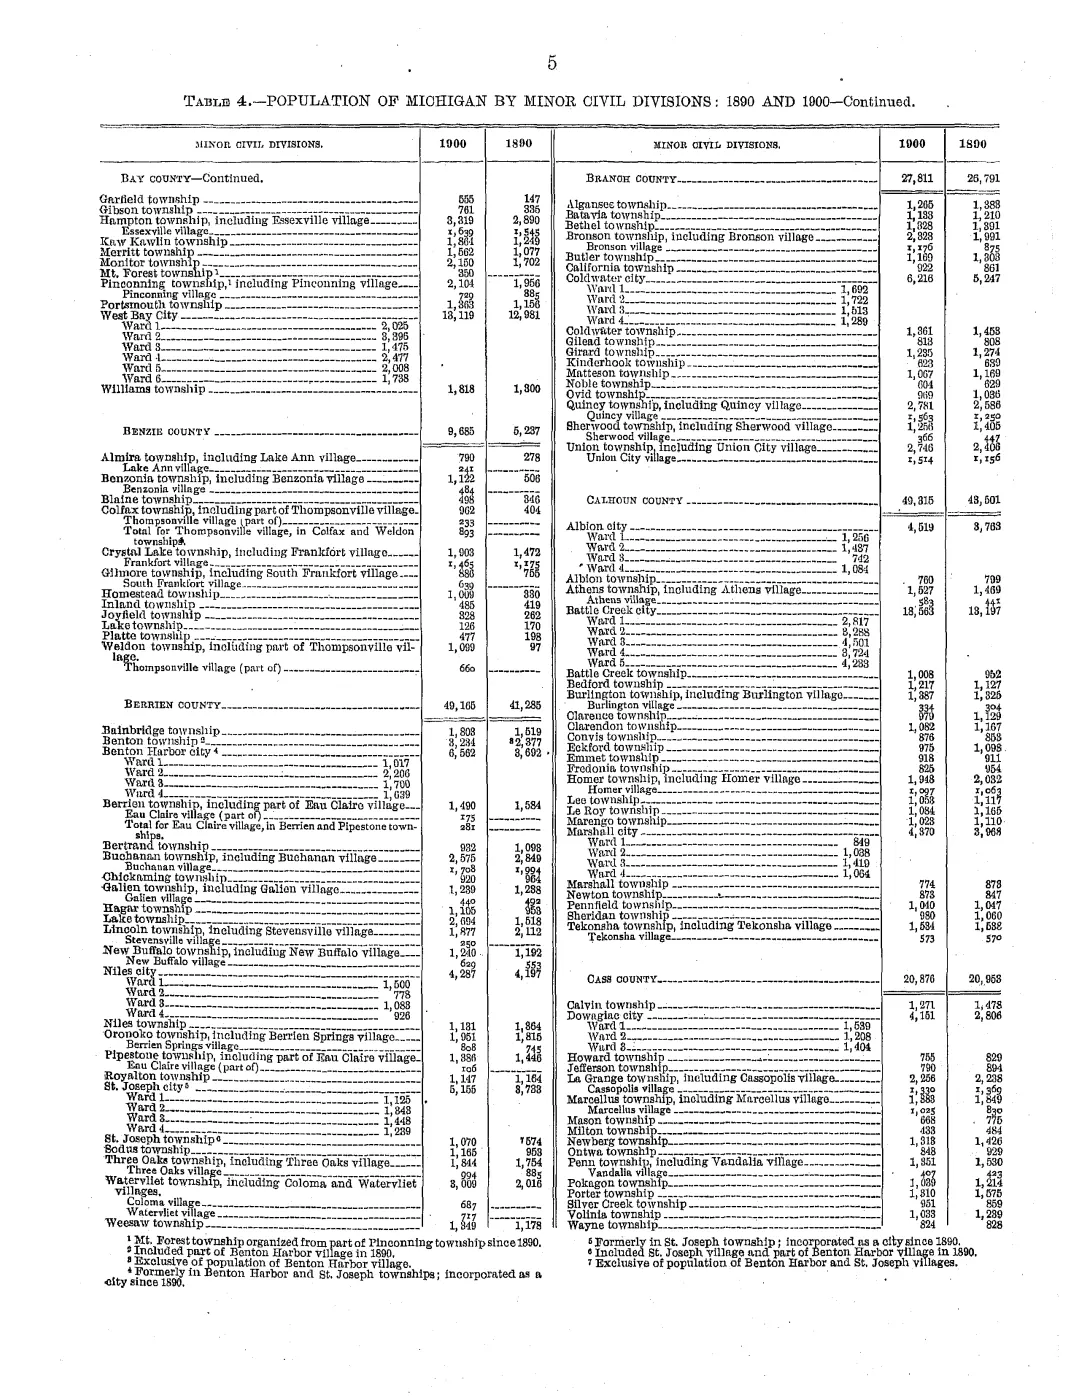
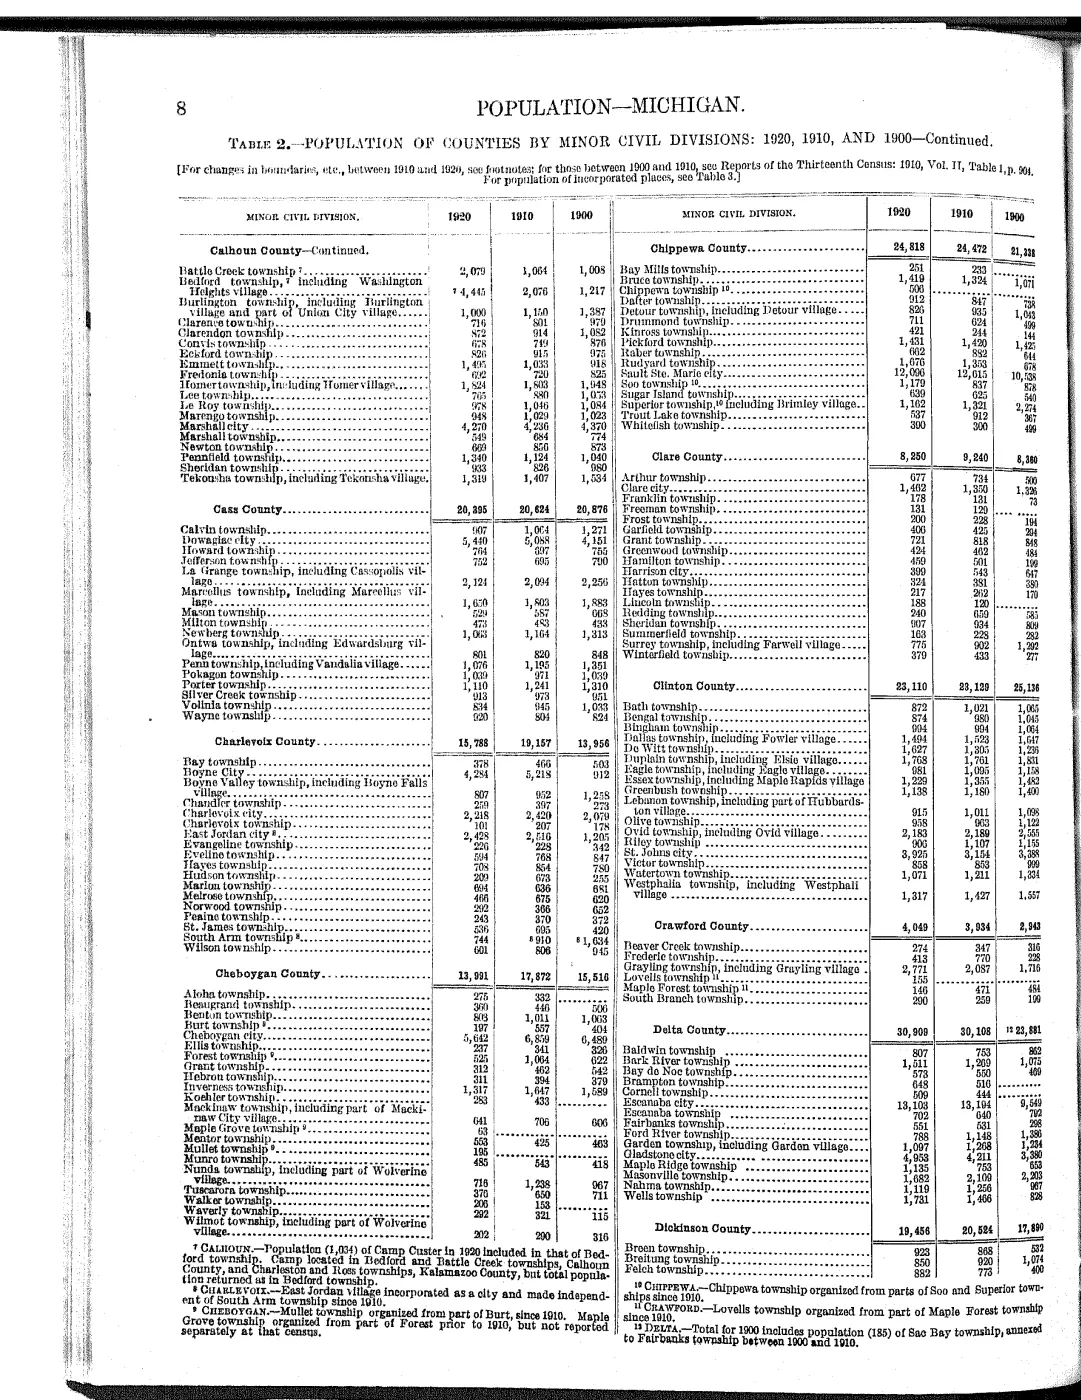
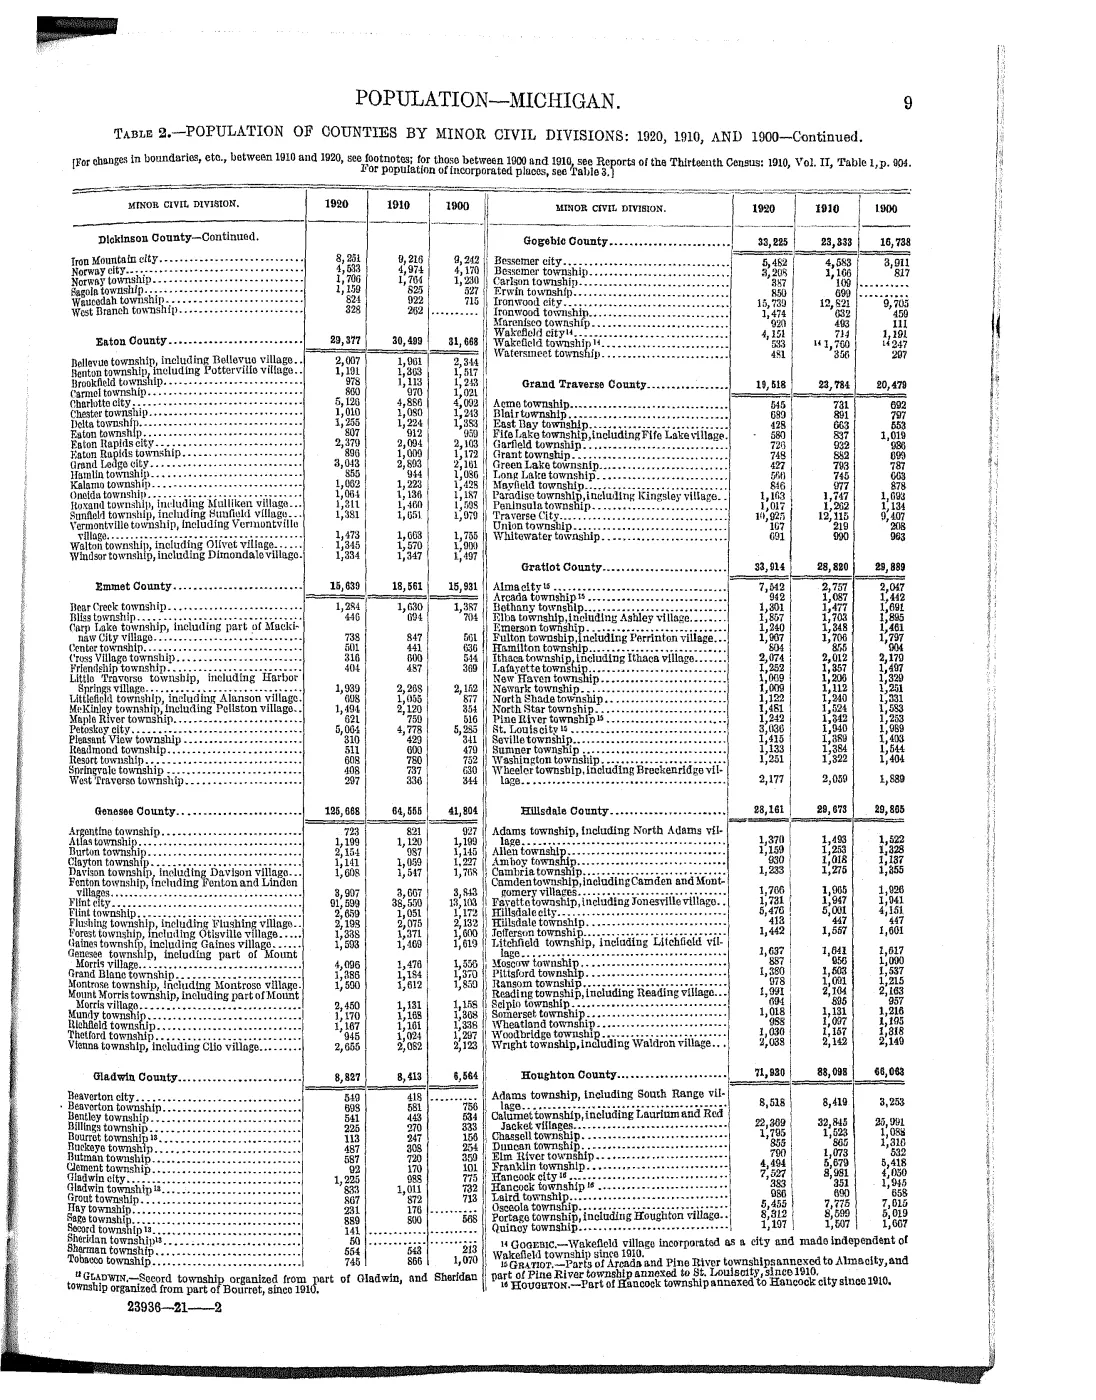
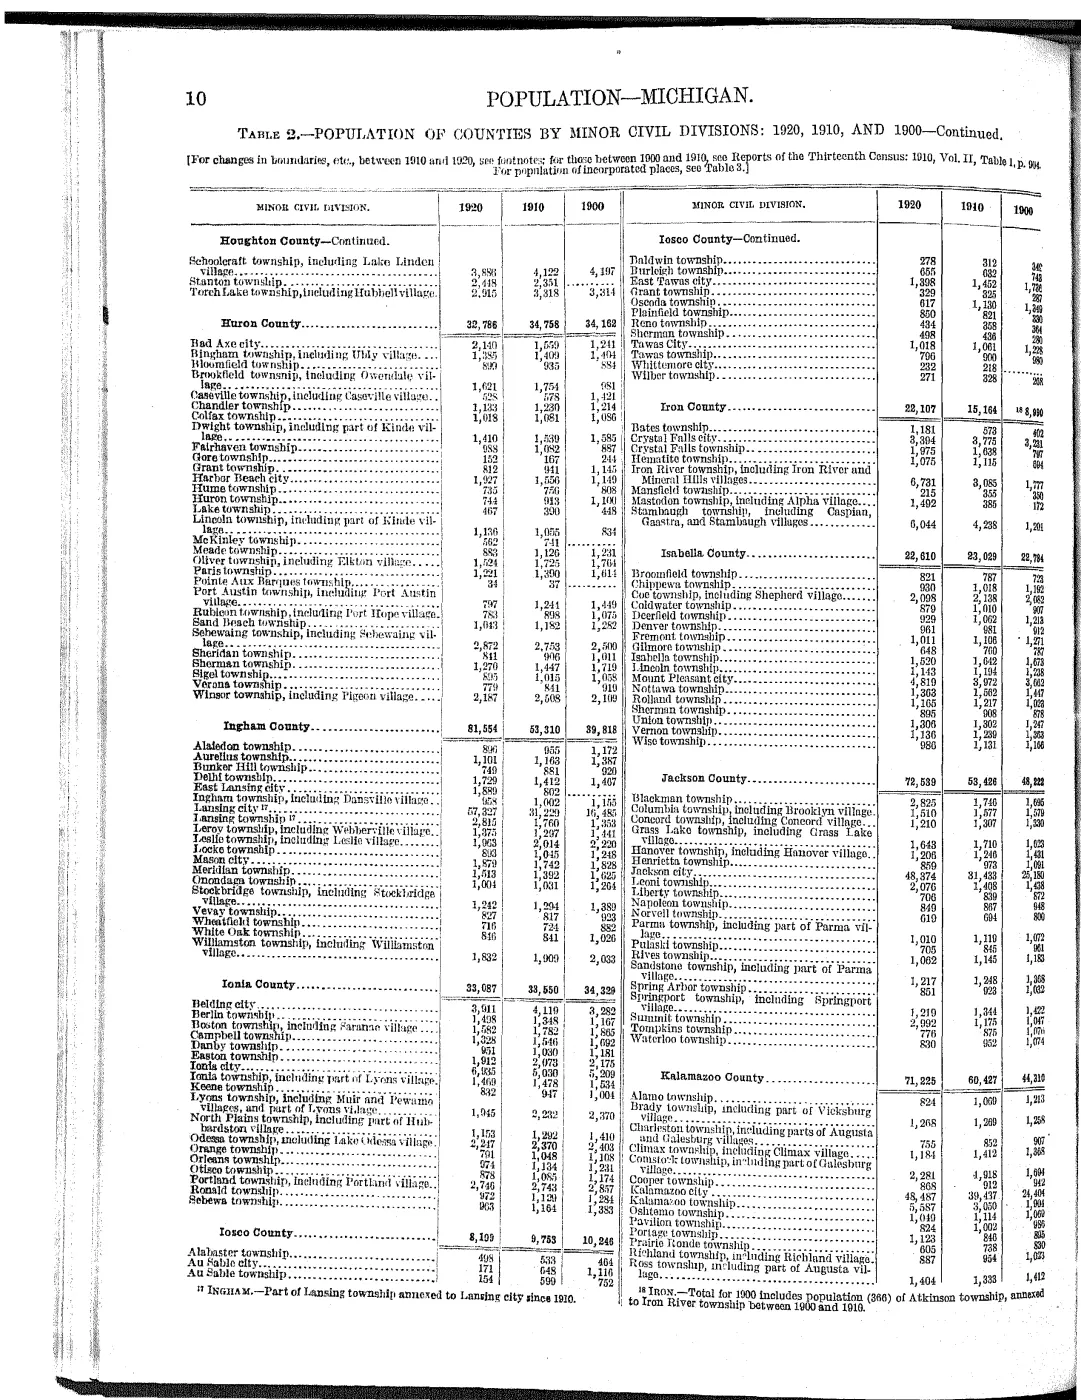
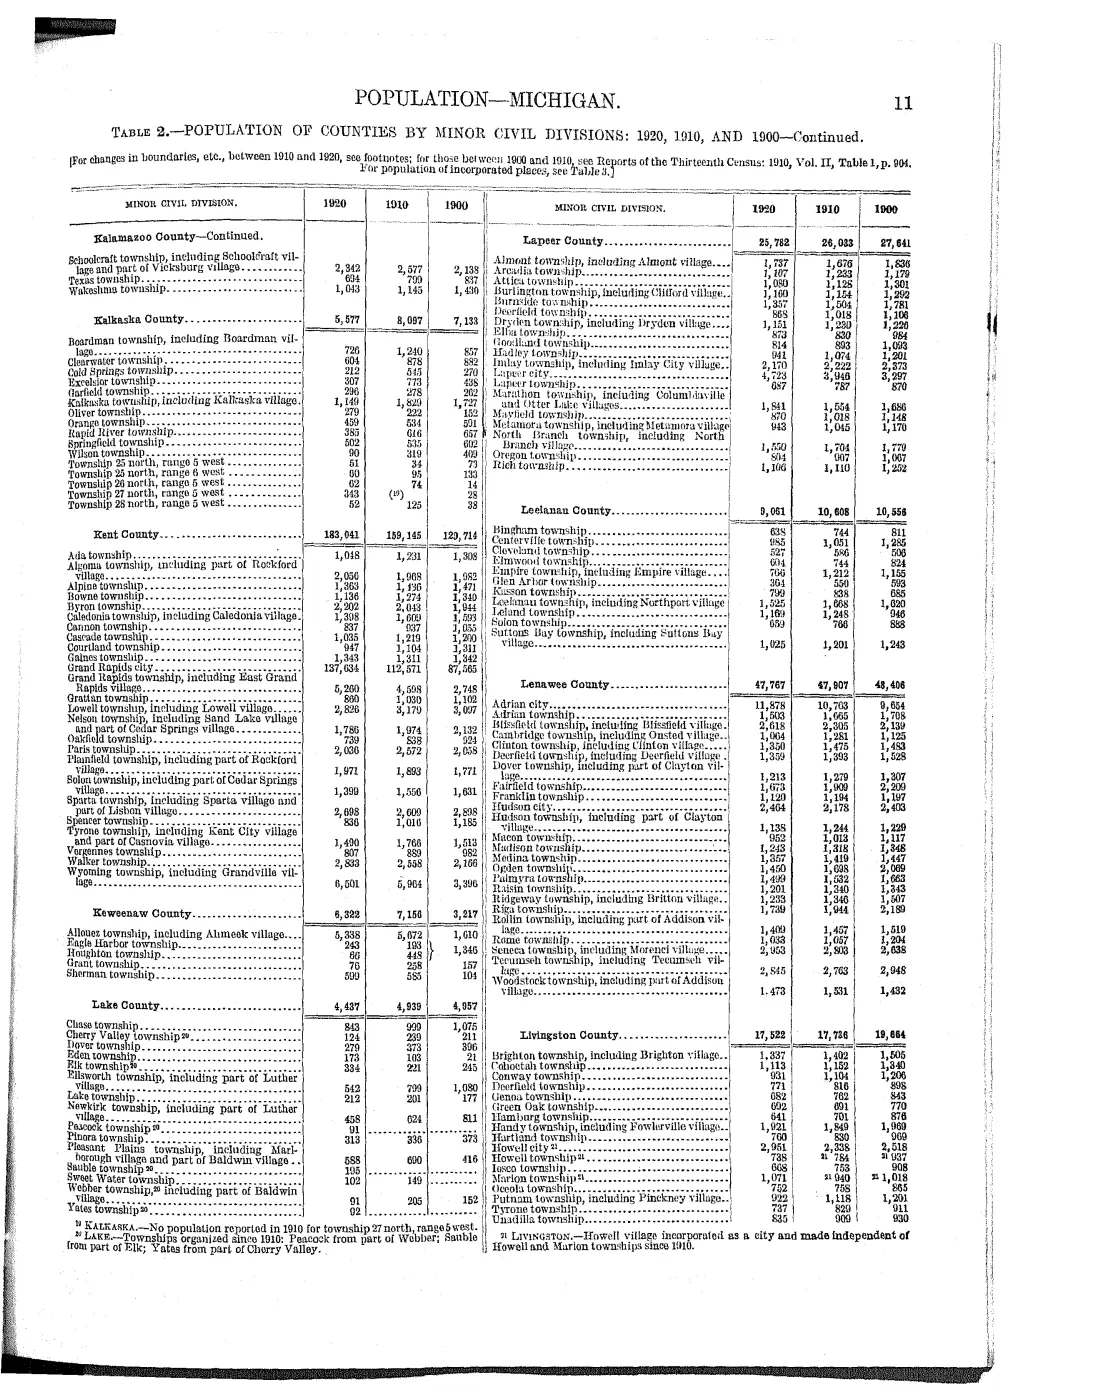
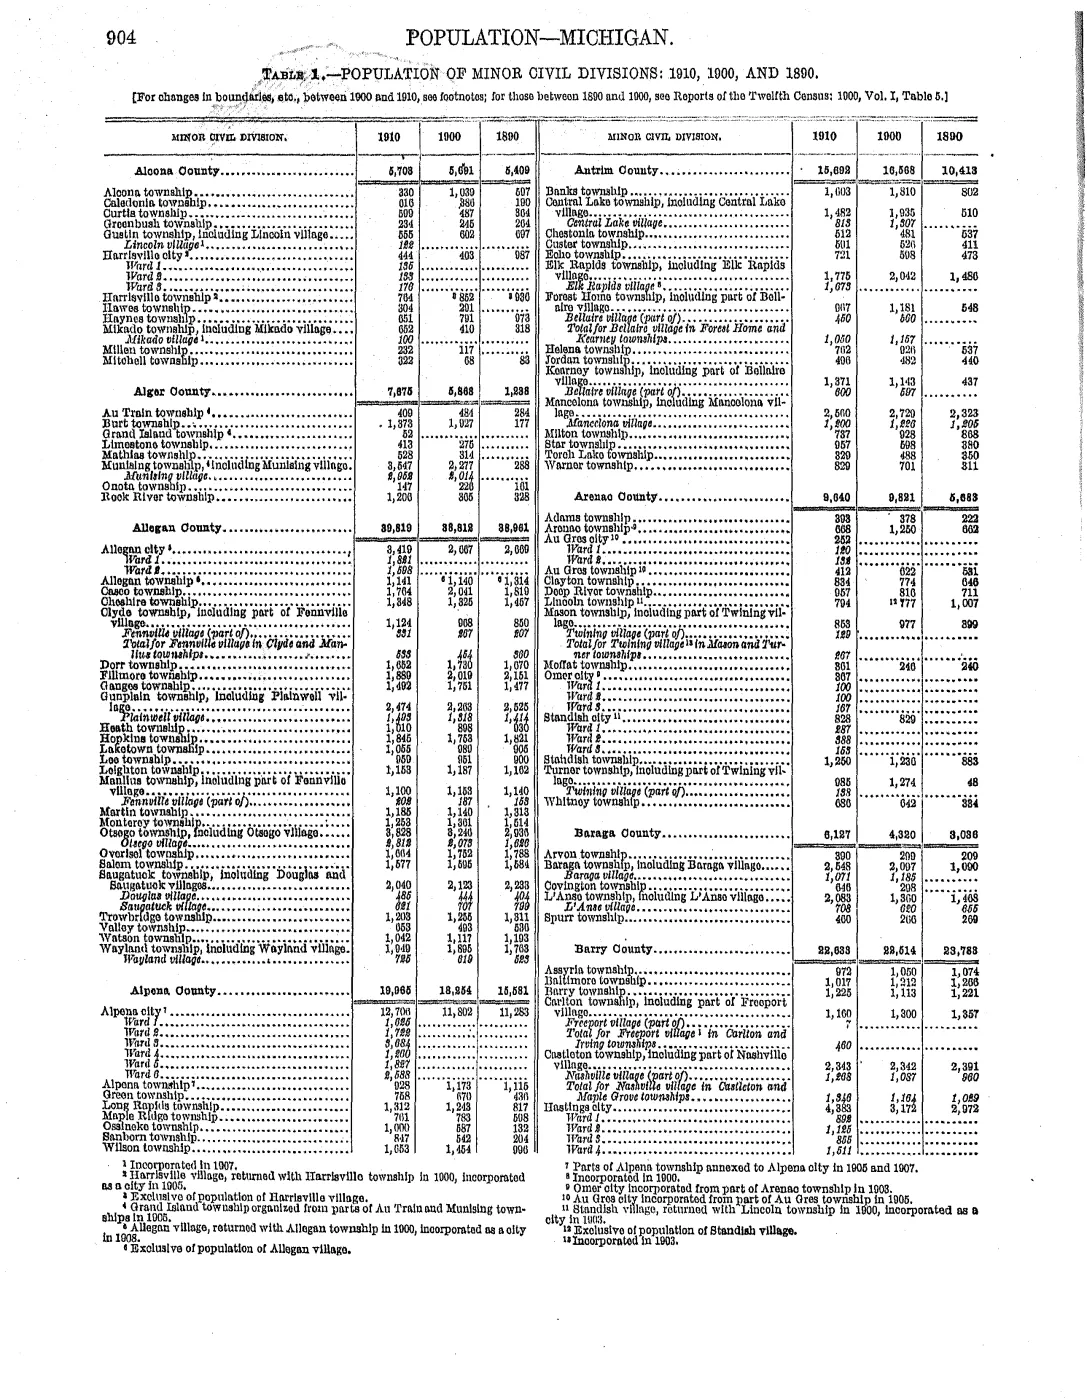
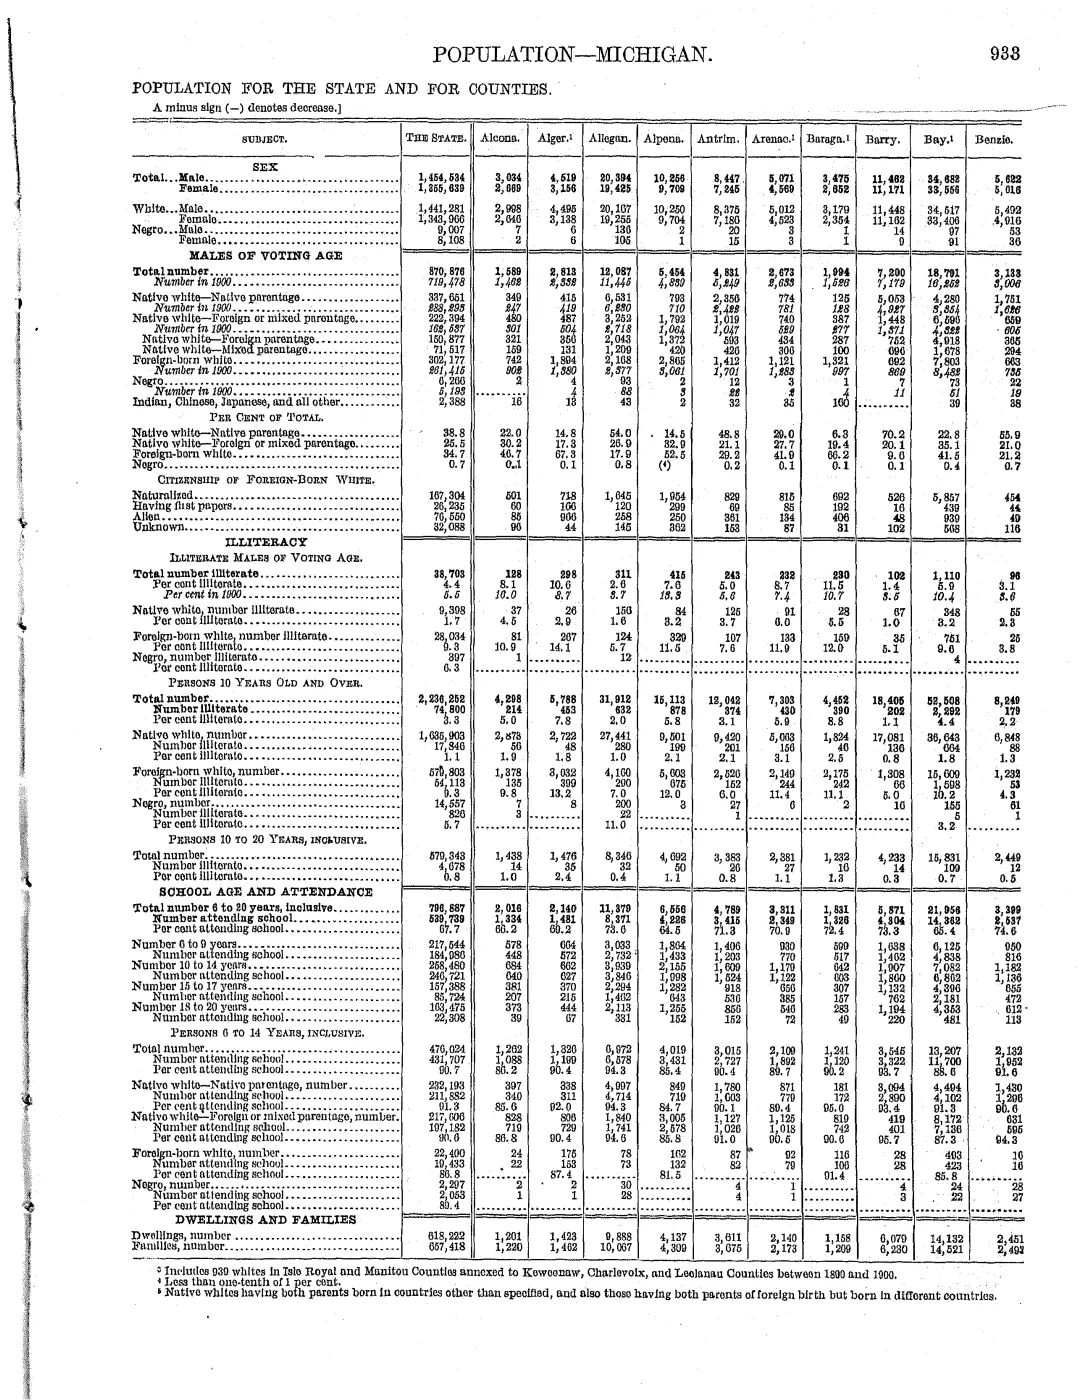
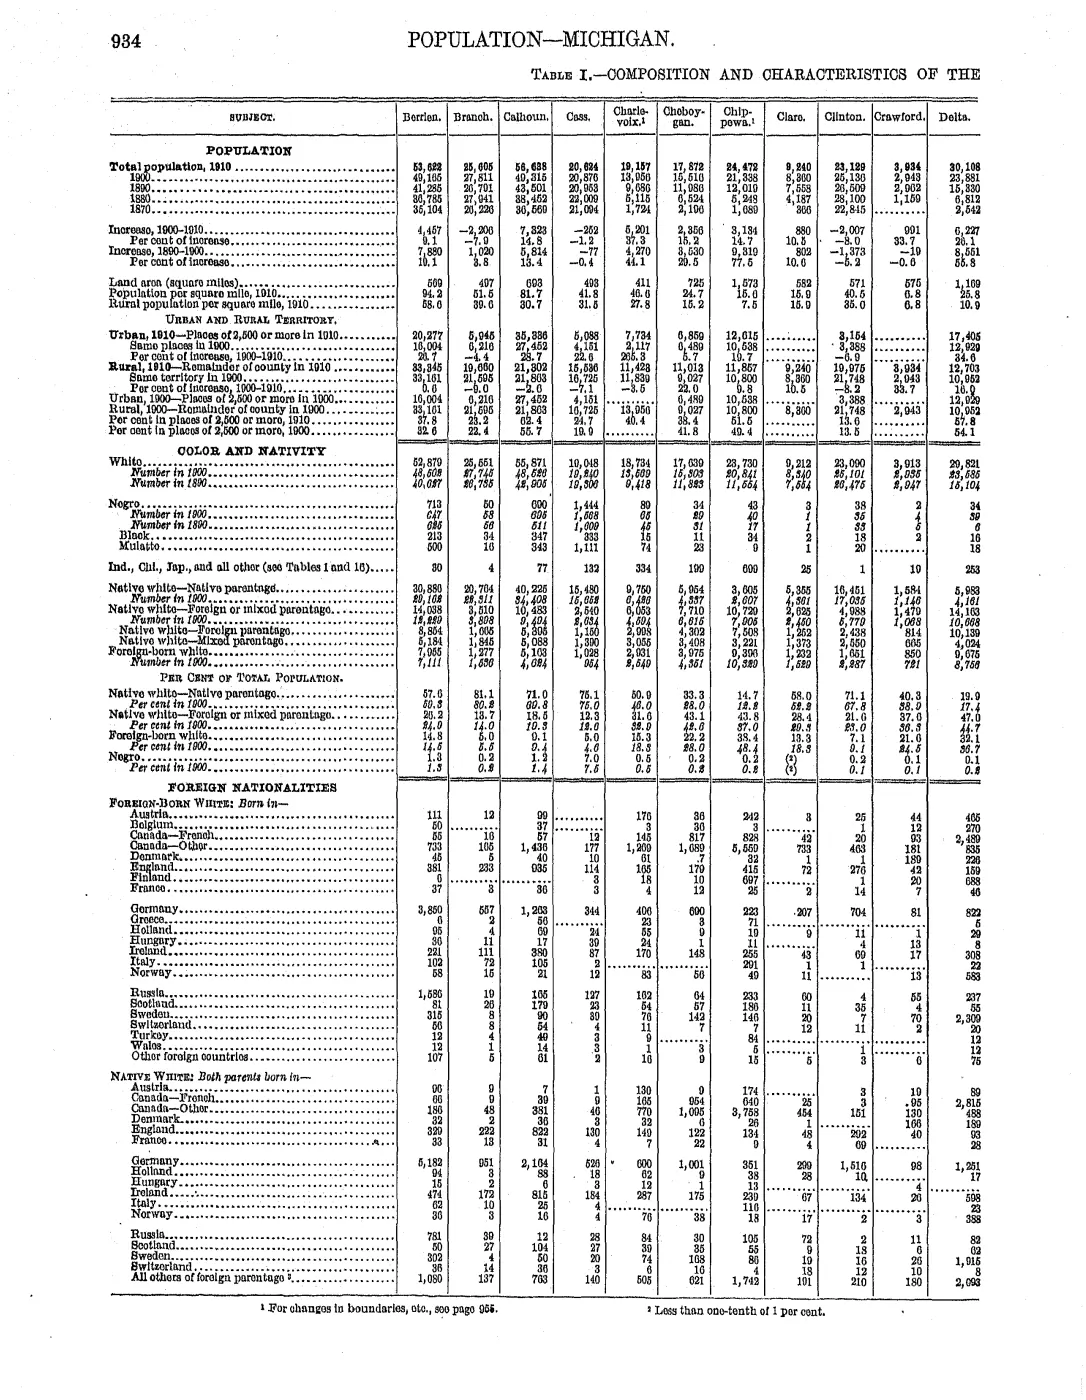
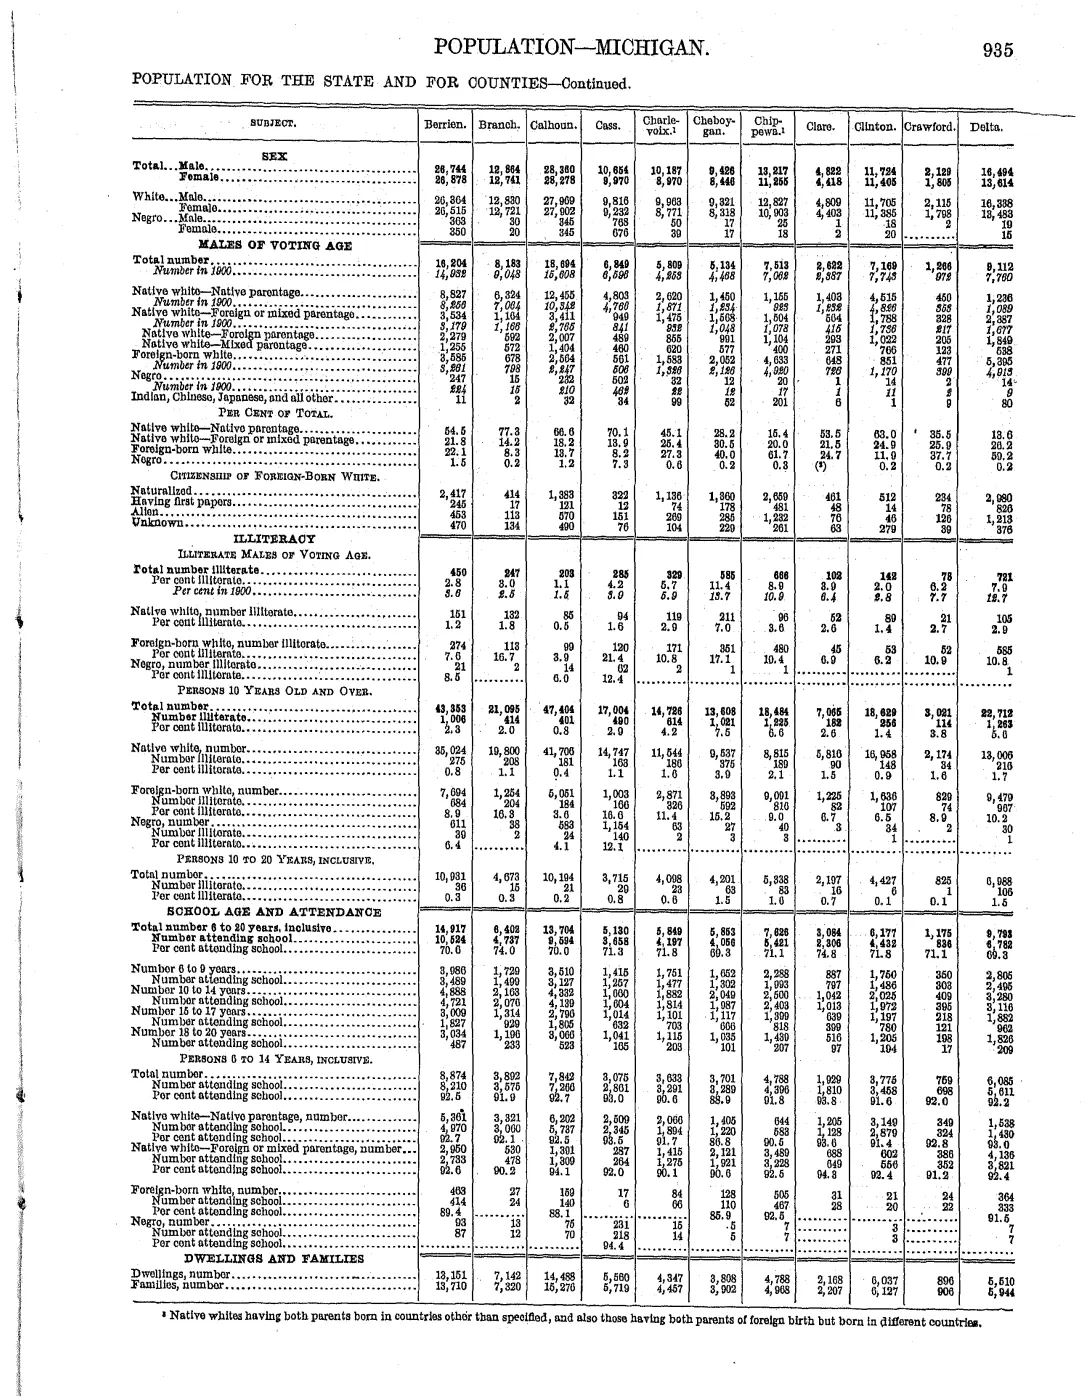
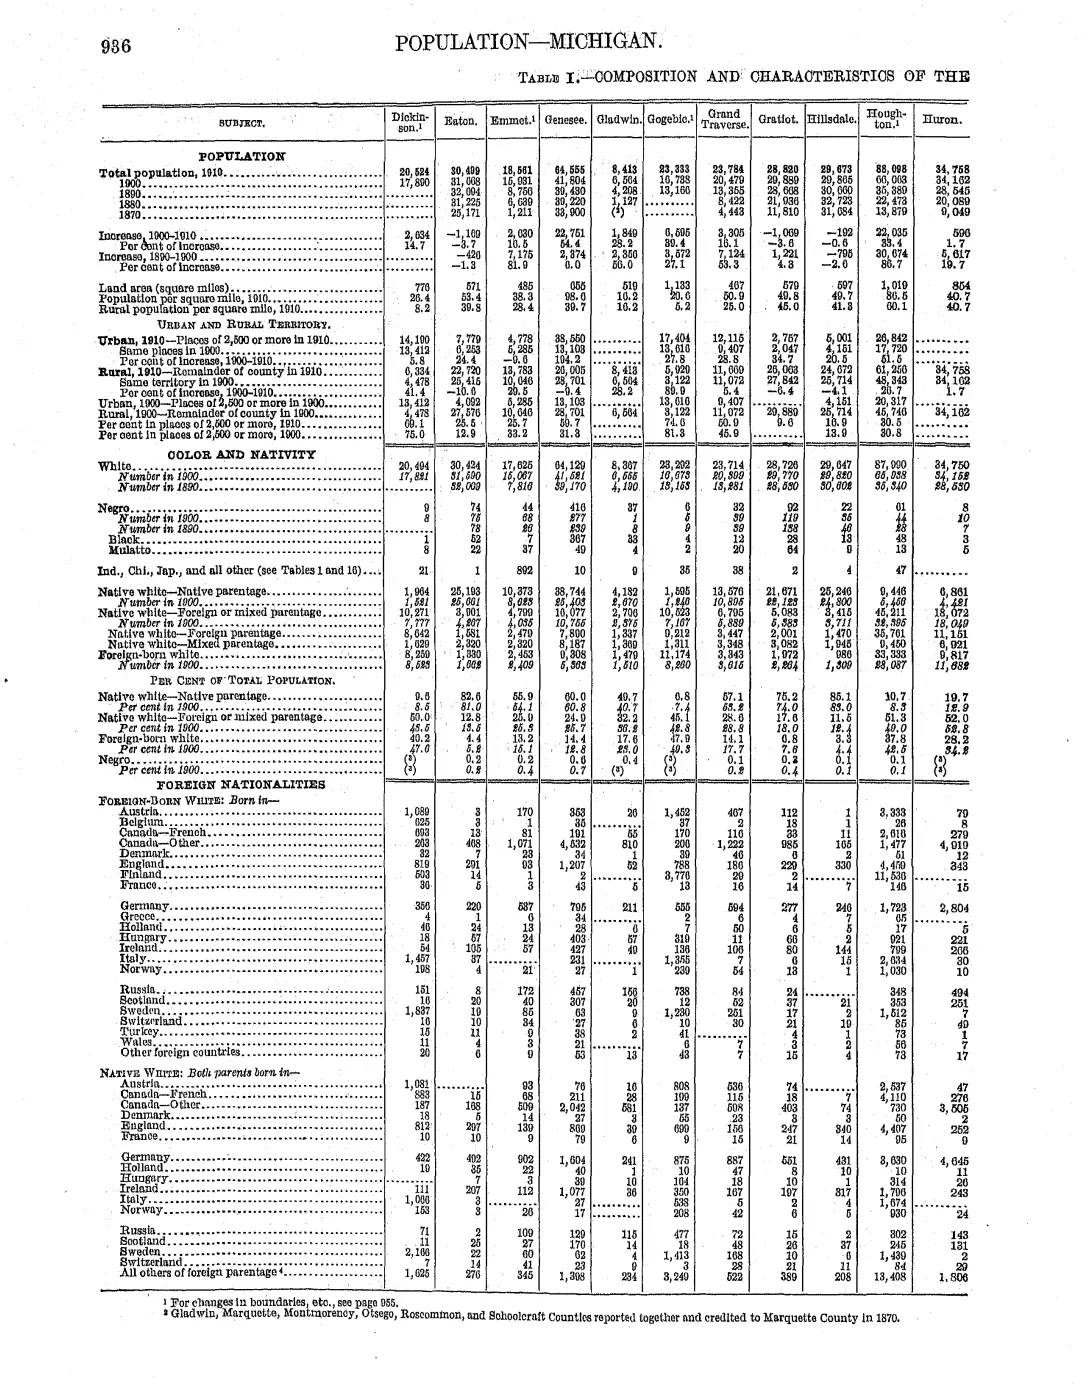
- Table gives Peaine 372 and St. James 420 in 1900. It also gives Peaine 426 in 1890, with a footnote that St. James was organized from part of Peaine since 1890; the 1890 Peaine row is therefore retained but not used as an island total.demographics · historical_census · 1900-population-michigan-minor-civil-divisions
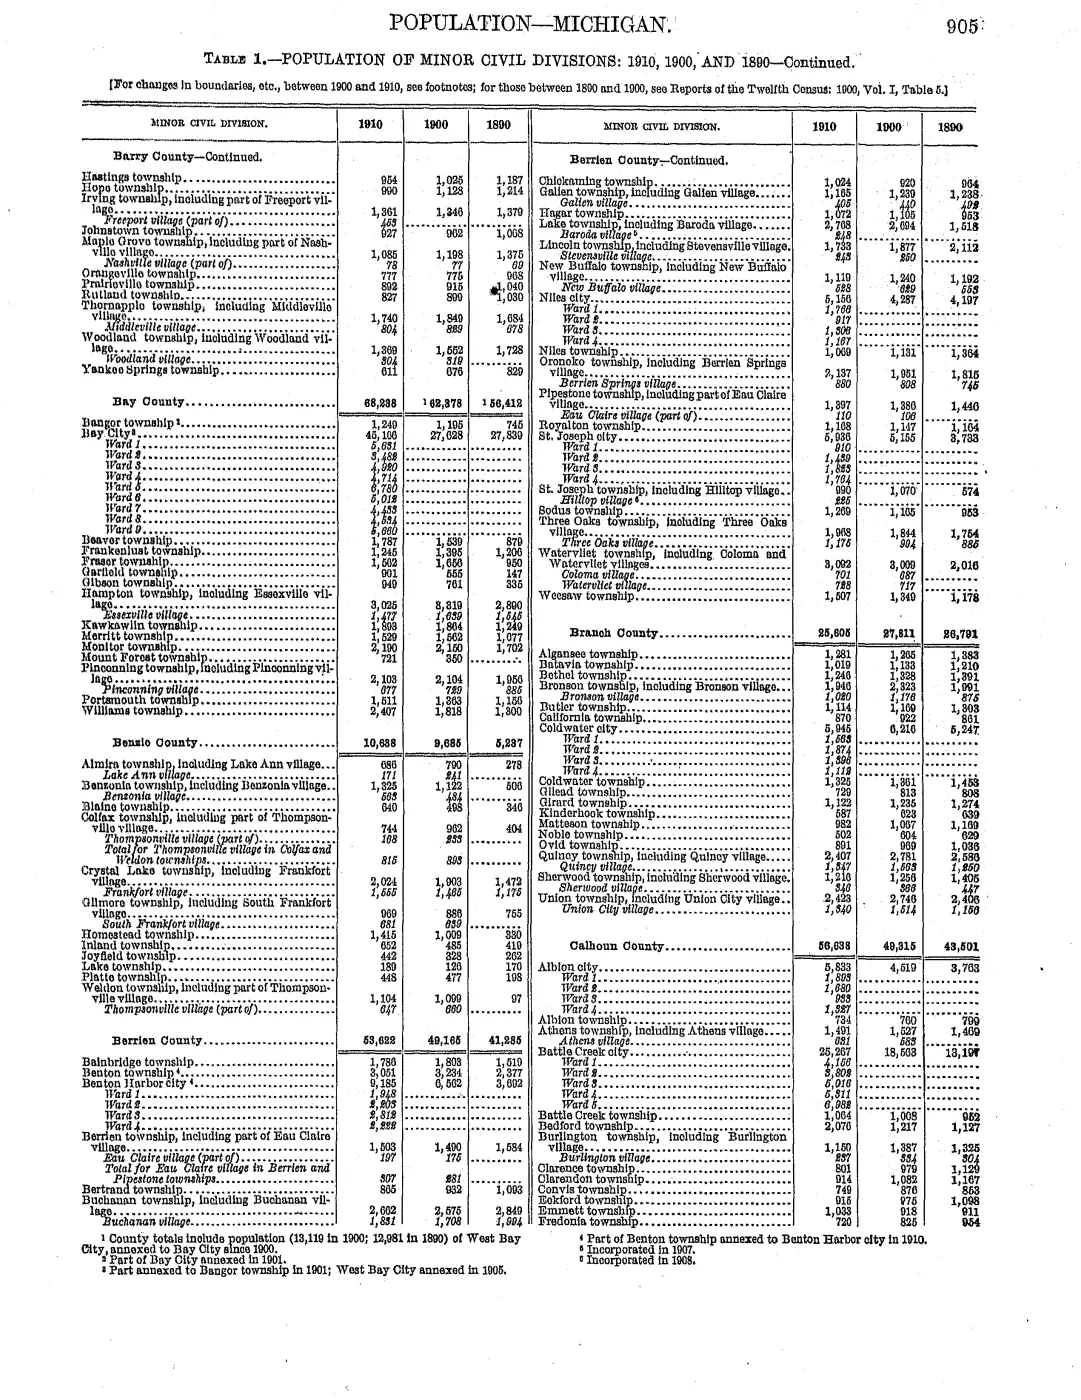
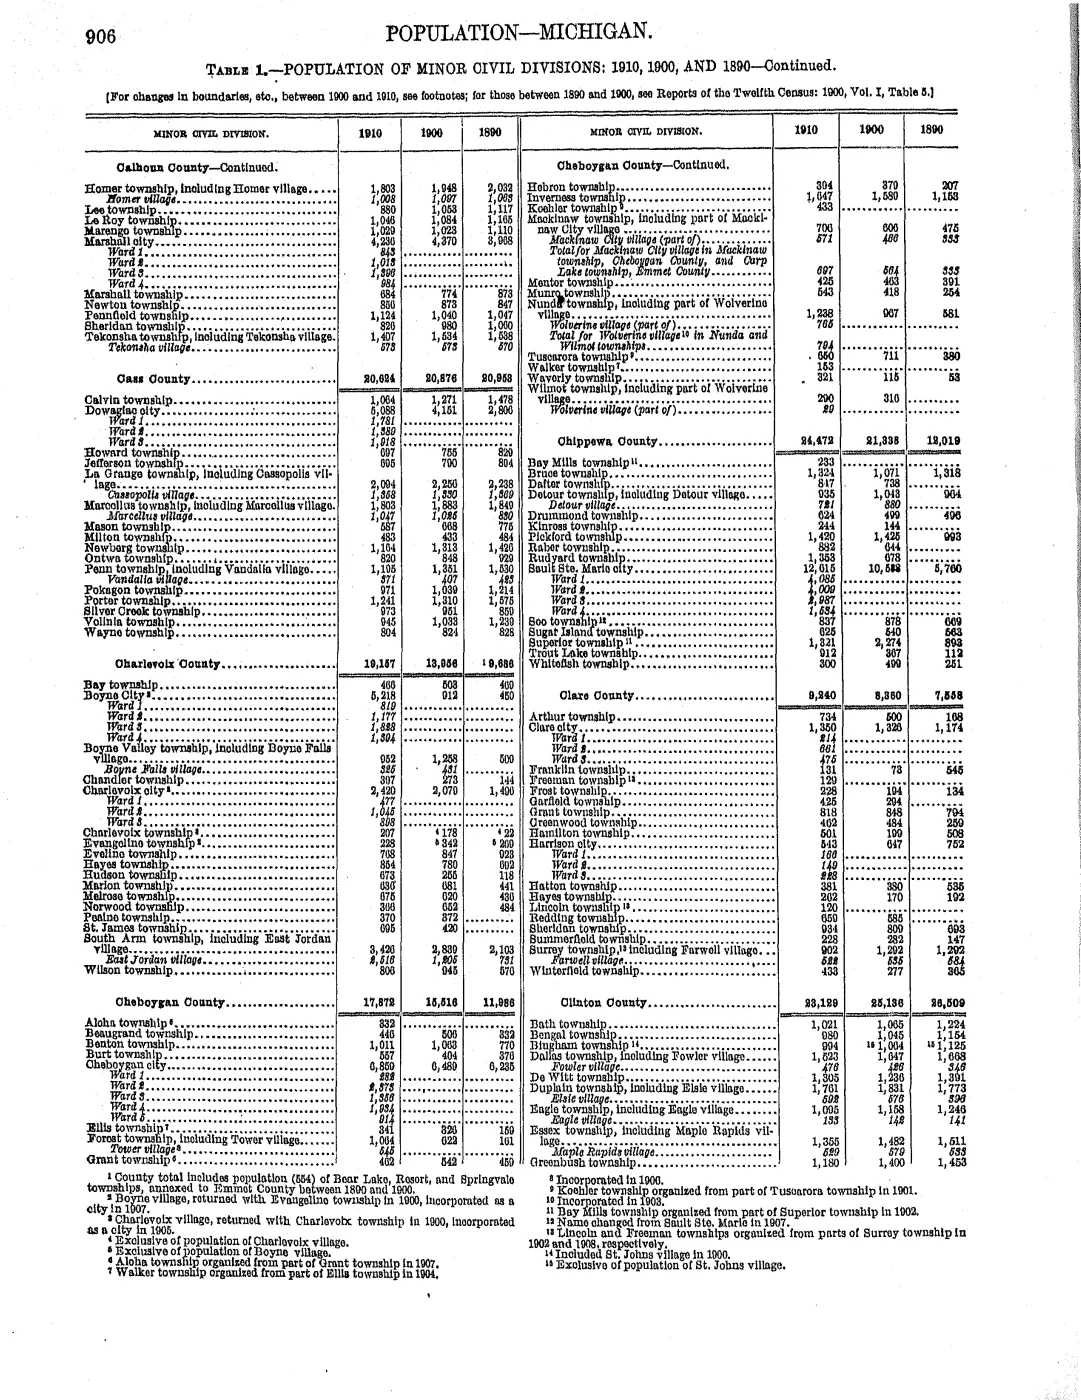
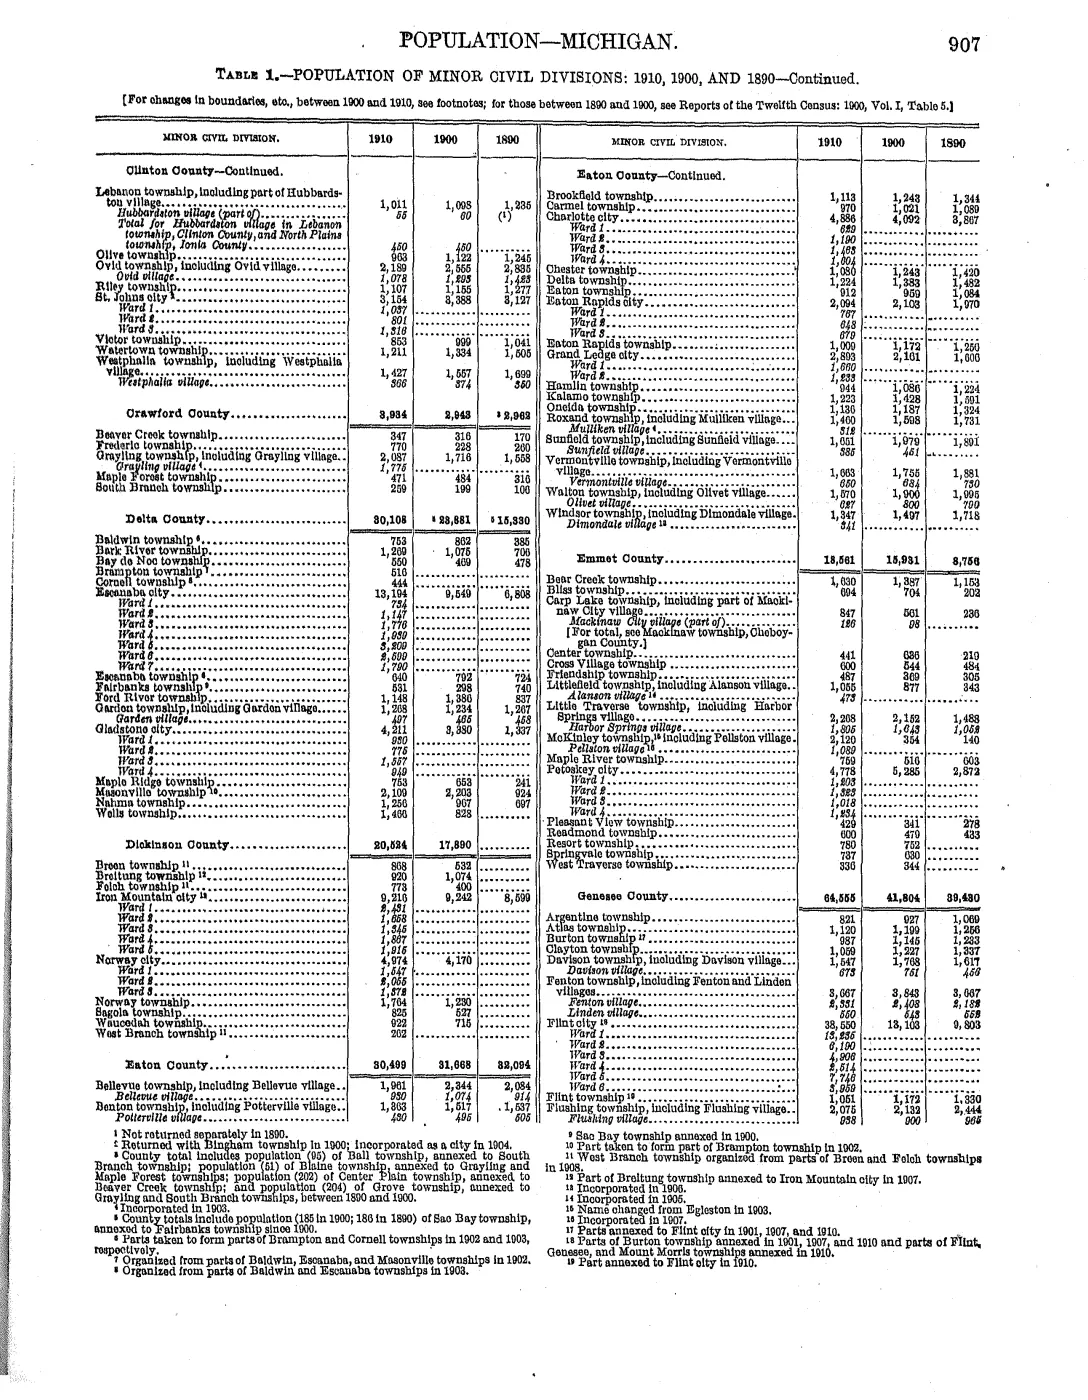
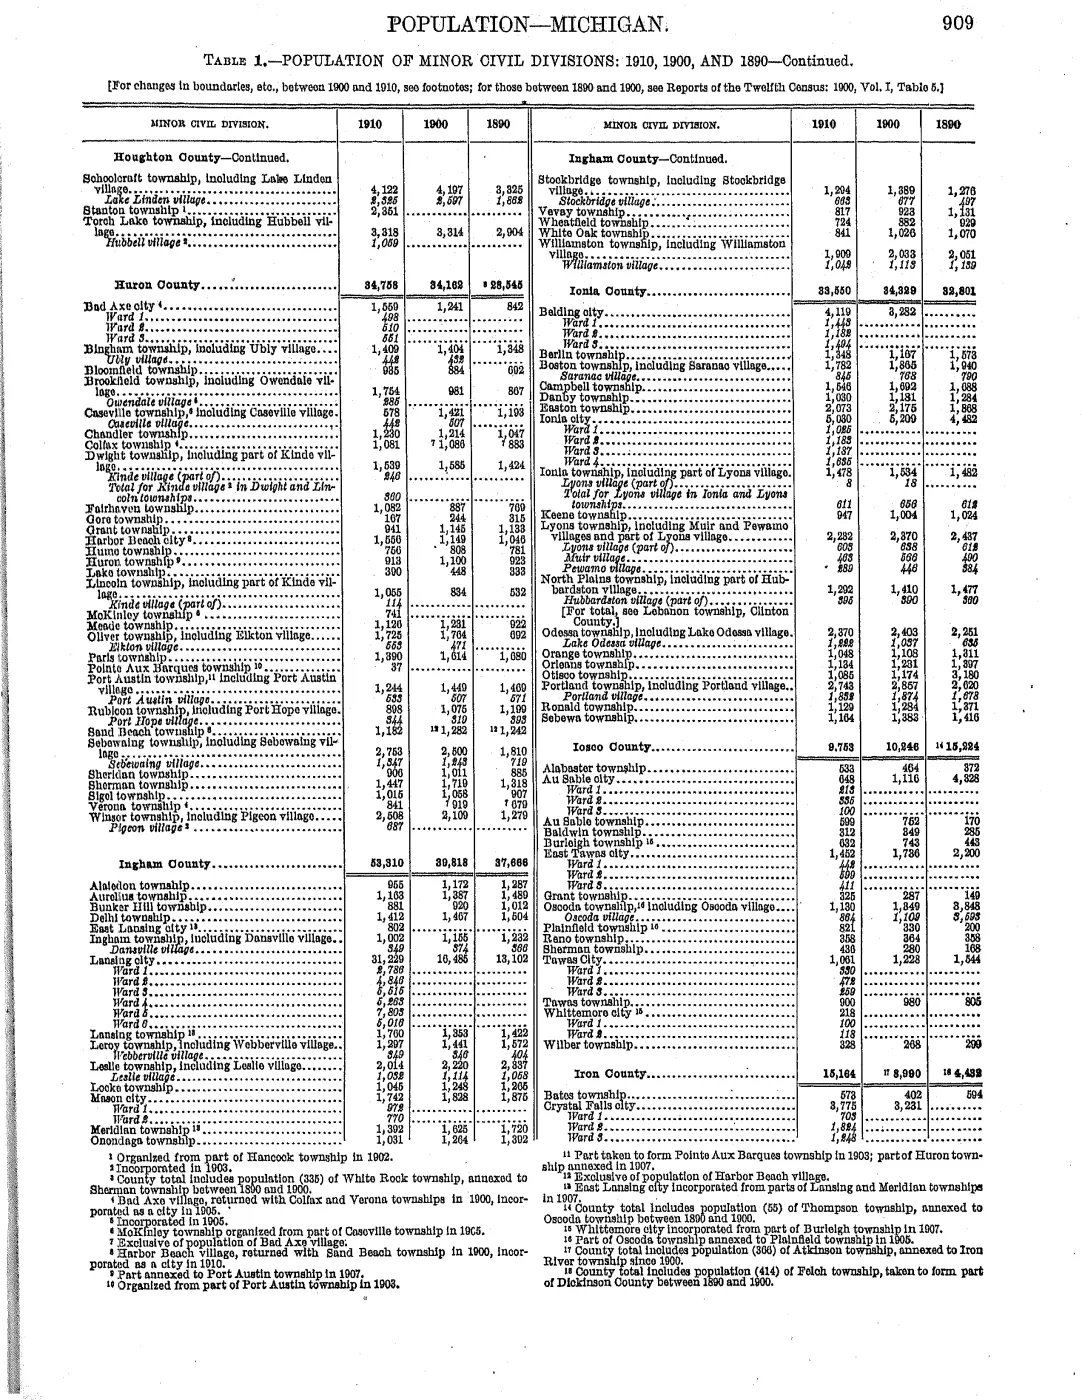
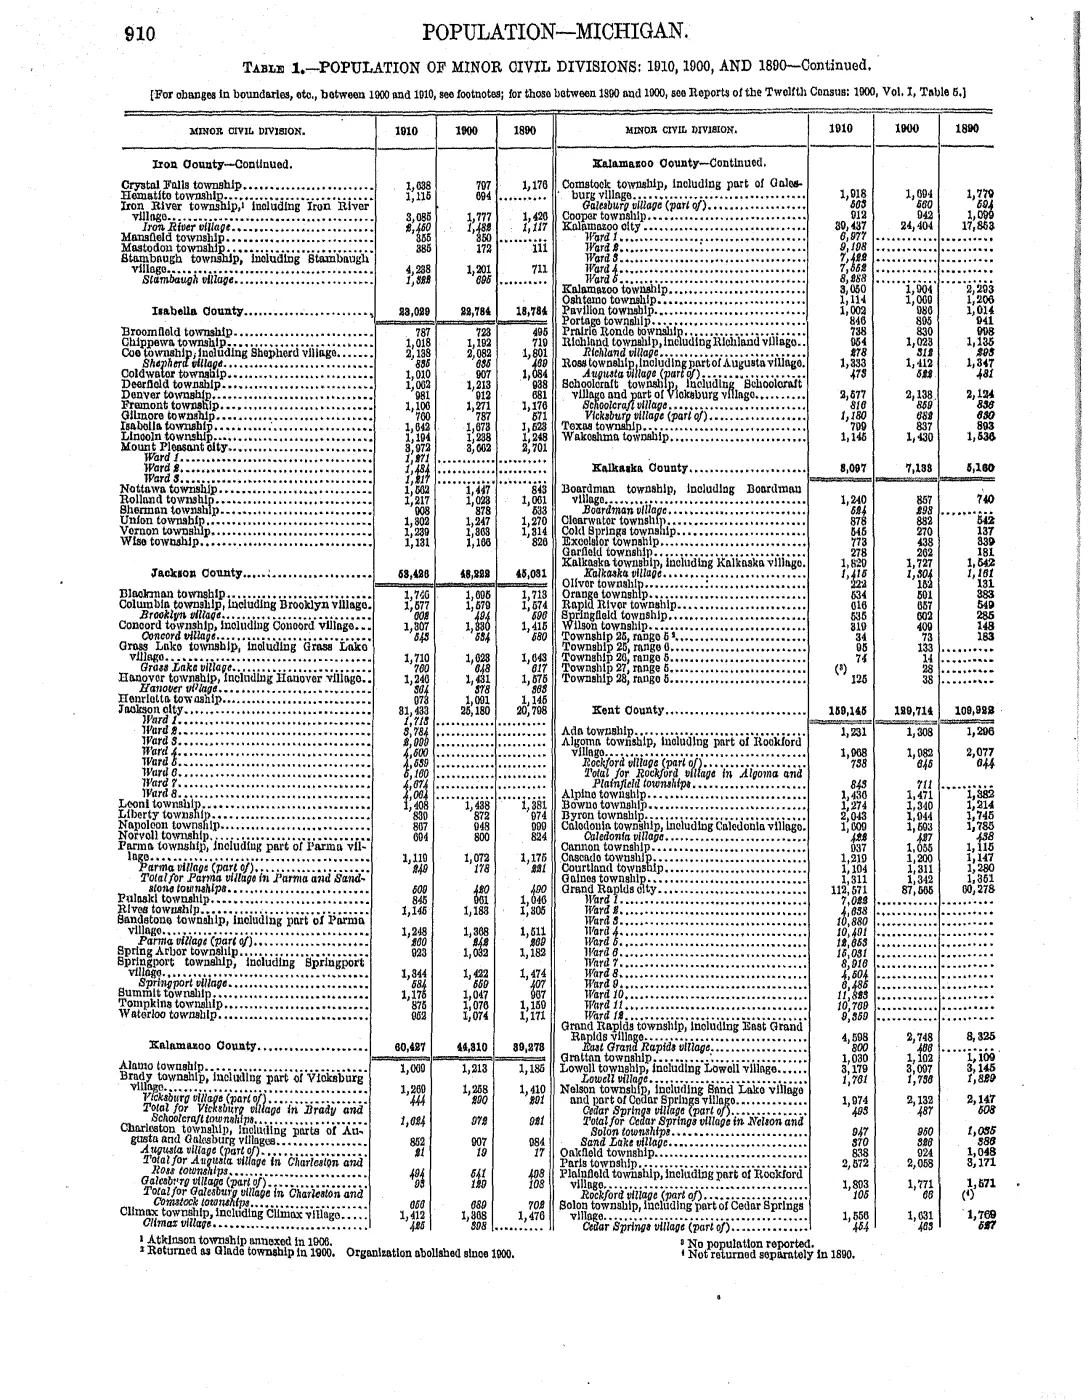
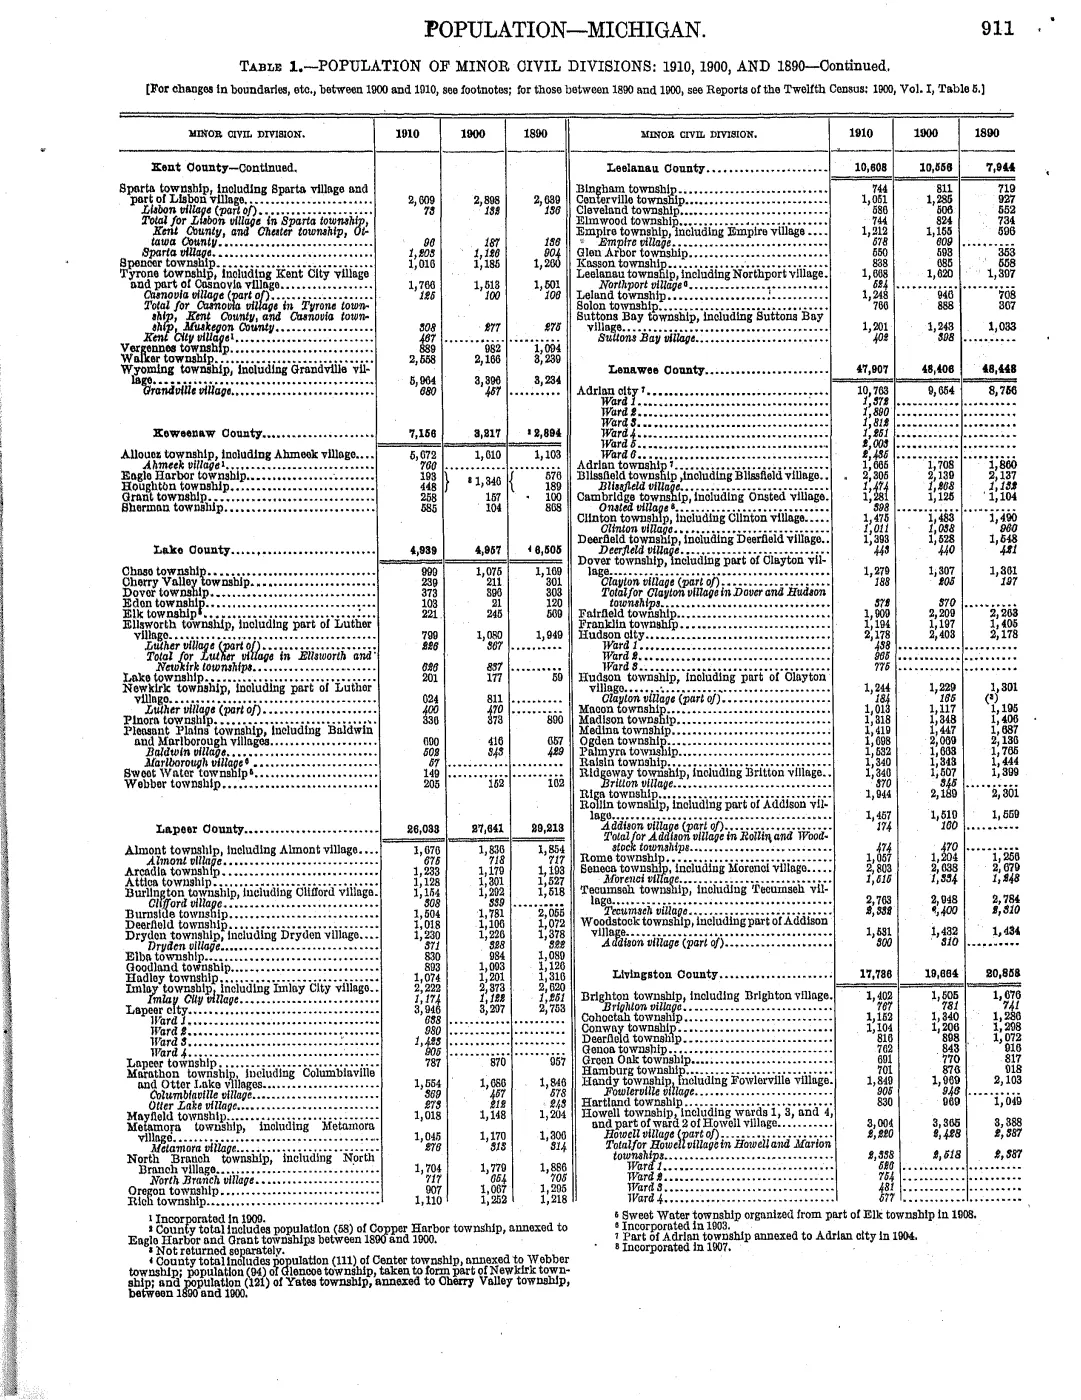
- Table gives Peaine 370 and St. James 695 in 1910. The St. James figure was rechecked on the printed table image after OCR dropped the leading 6; the 1920 volume's historical columns independently reproduce 695.demographics · historical_census · 1910-population-michigan-minor-civil-divisions
- Table gives Peaine 243 and St. James 536 in 1920.demographics · historical_census · 1920-population-michigan-minor-civil-divisions
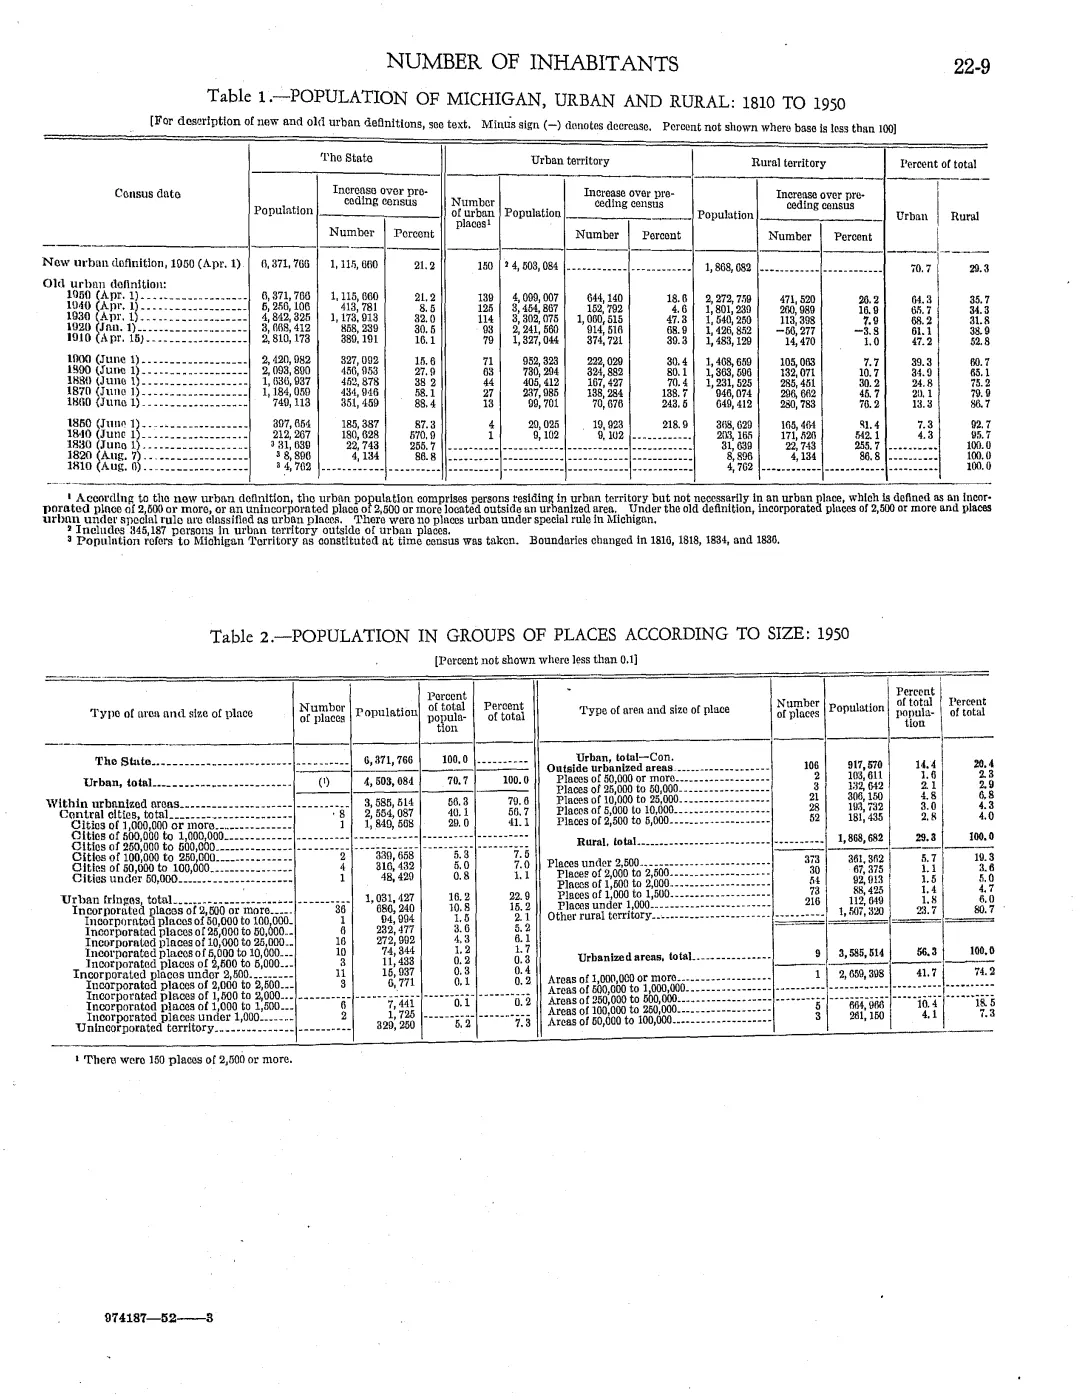
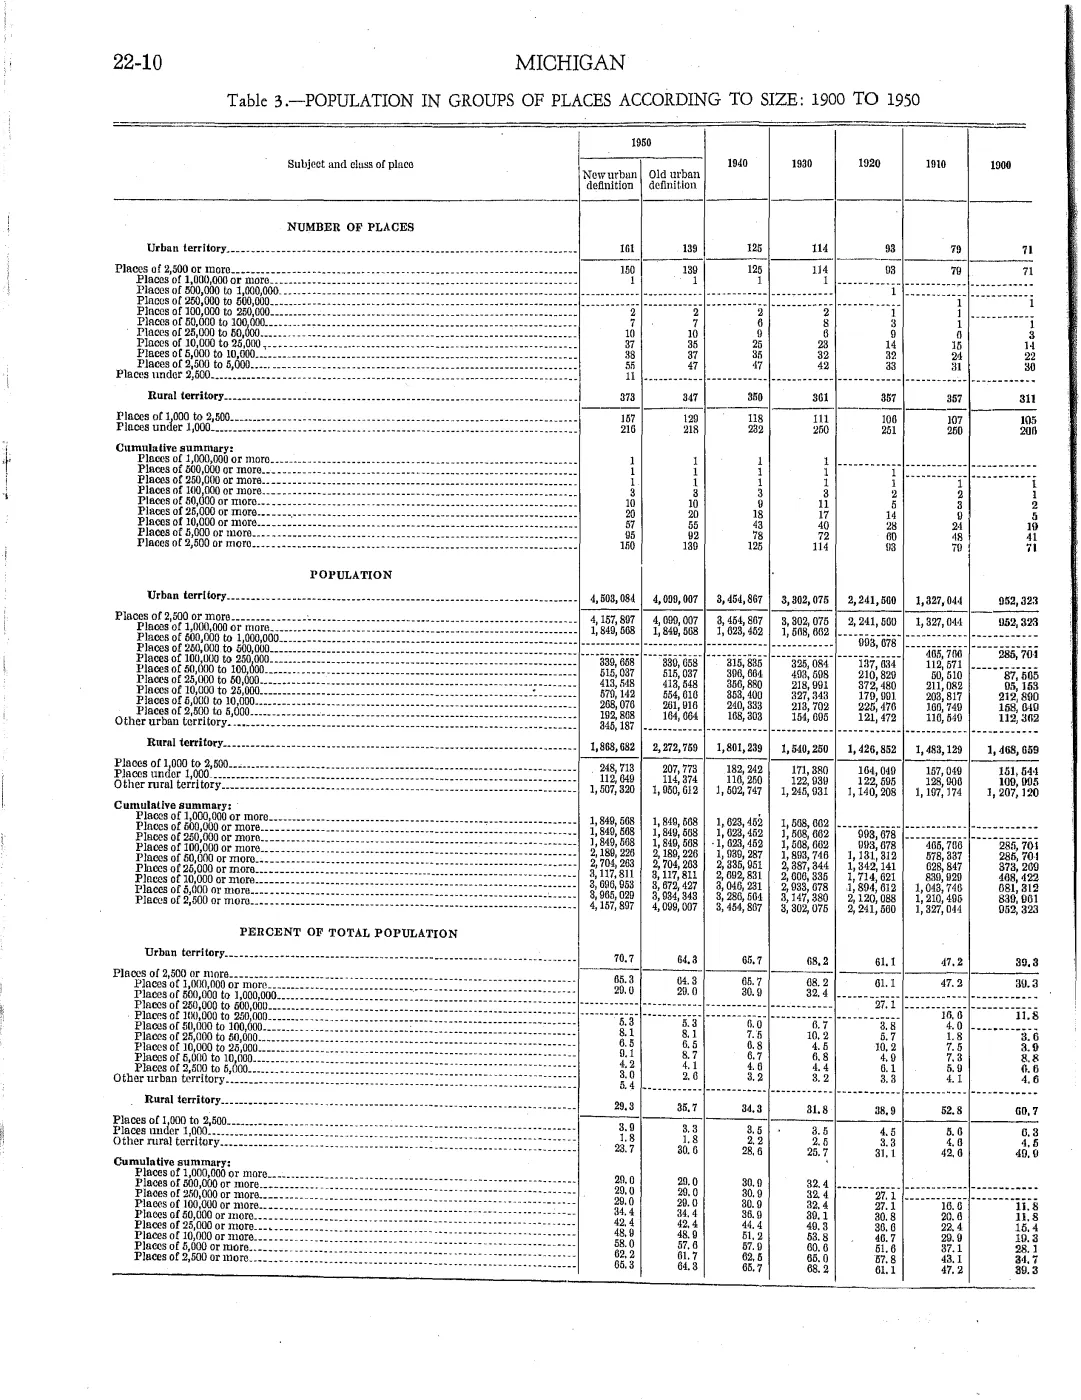
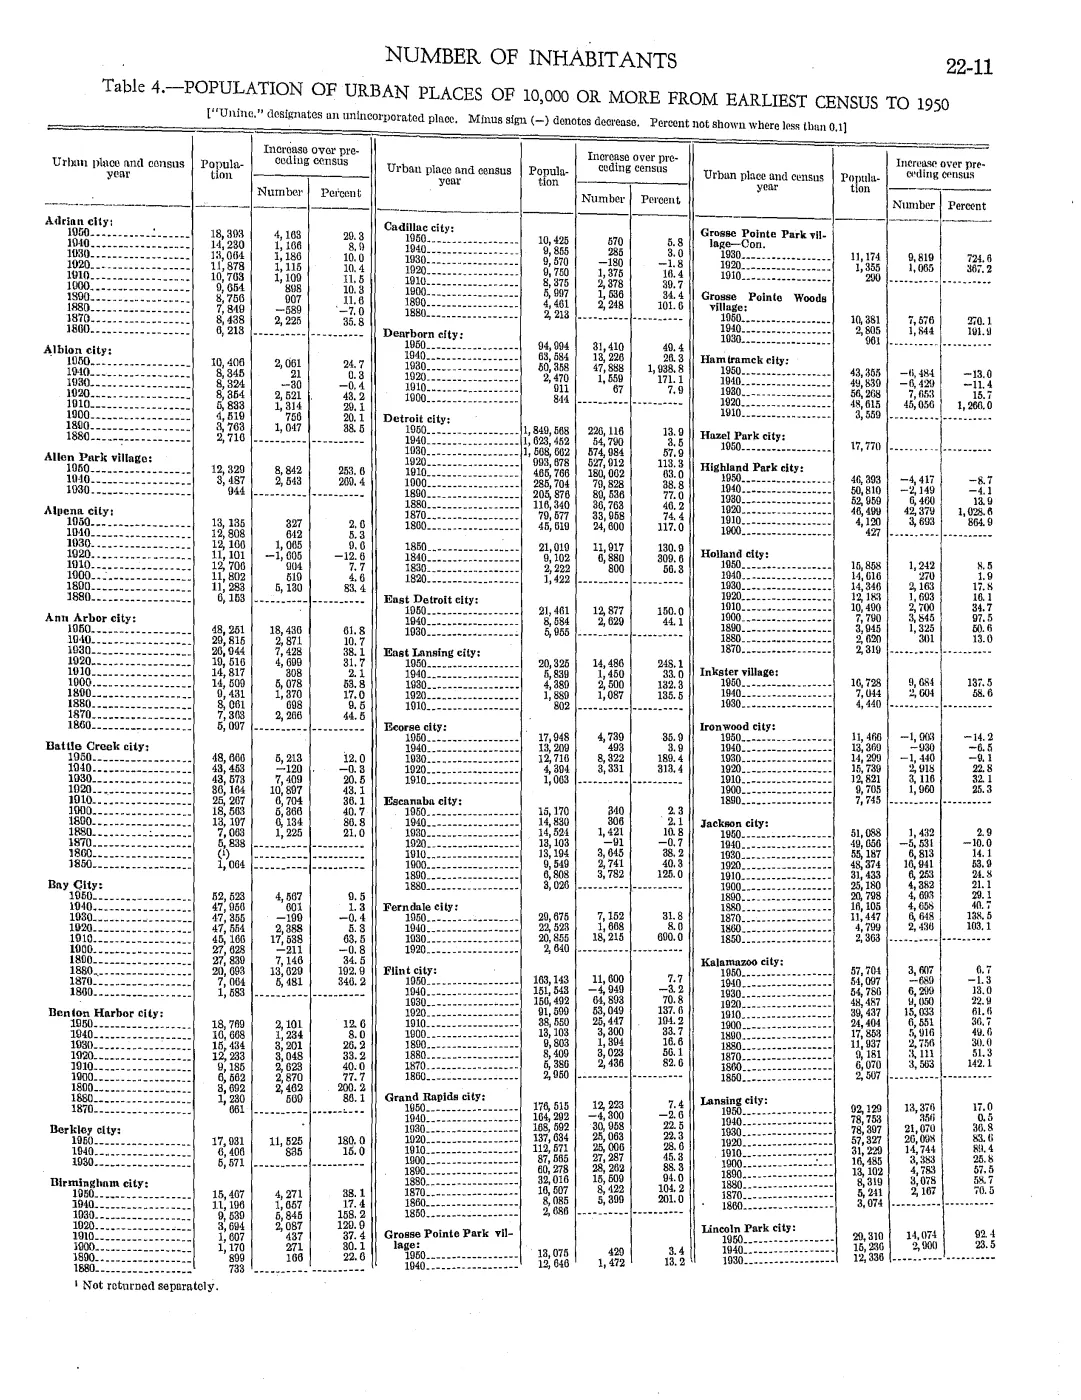
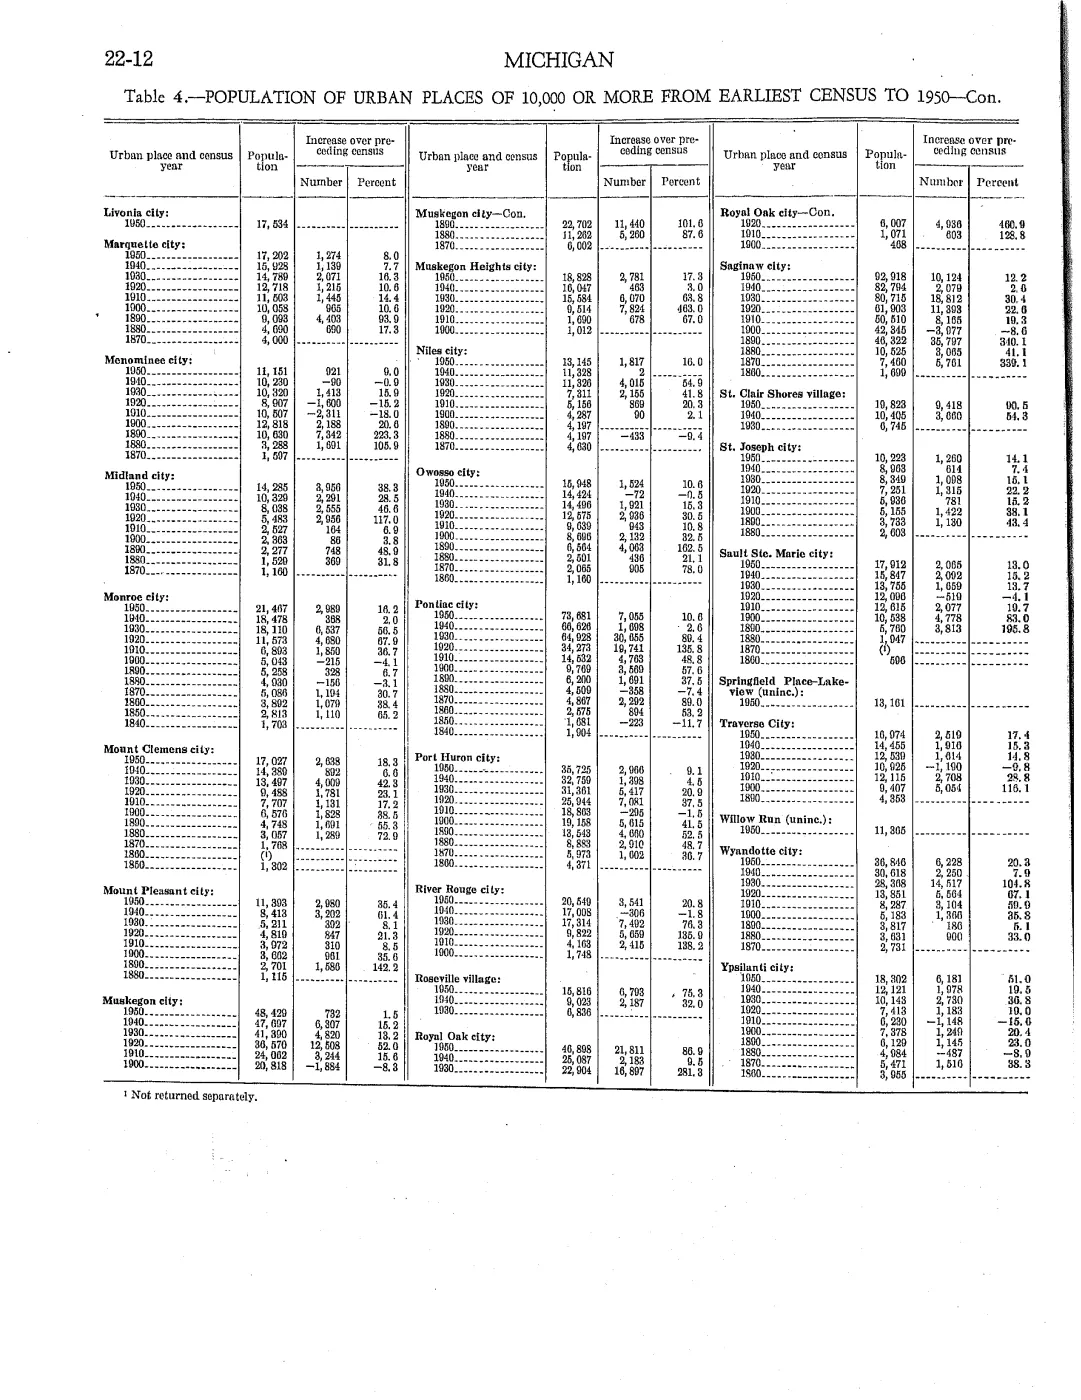
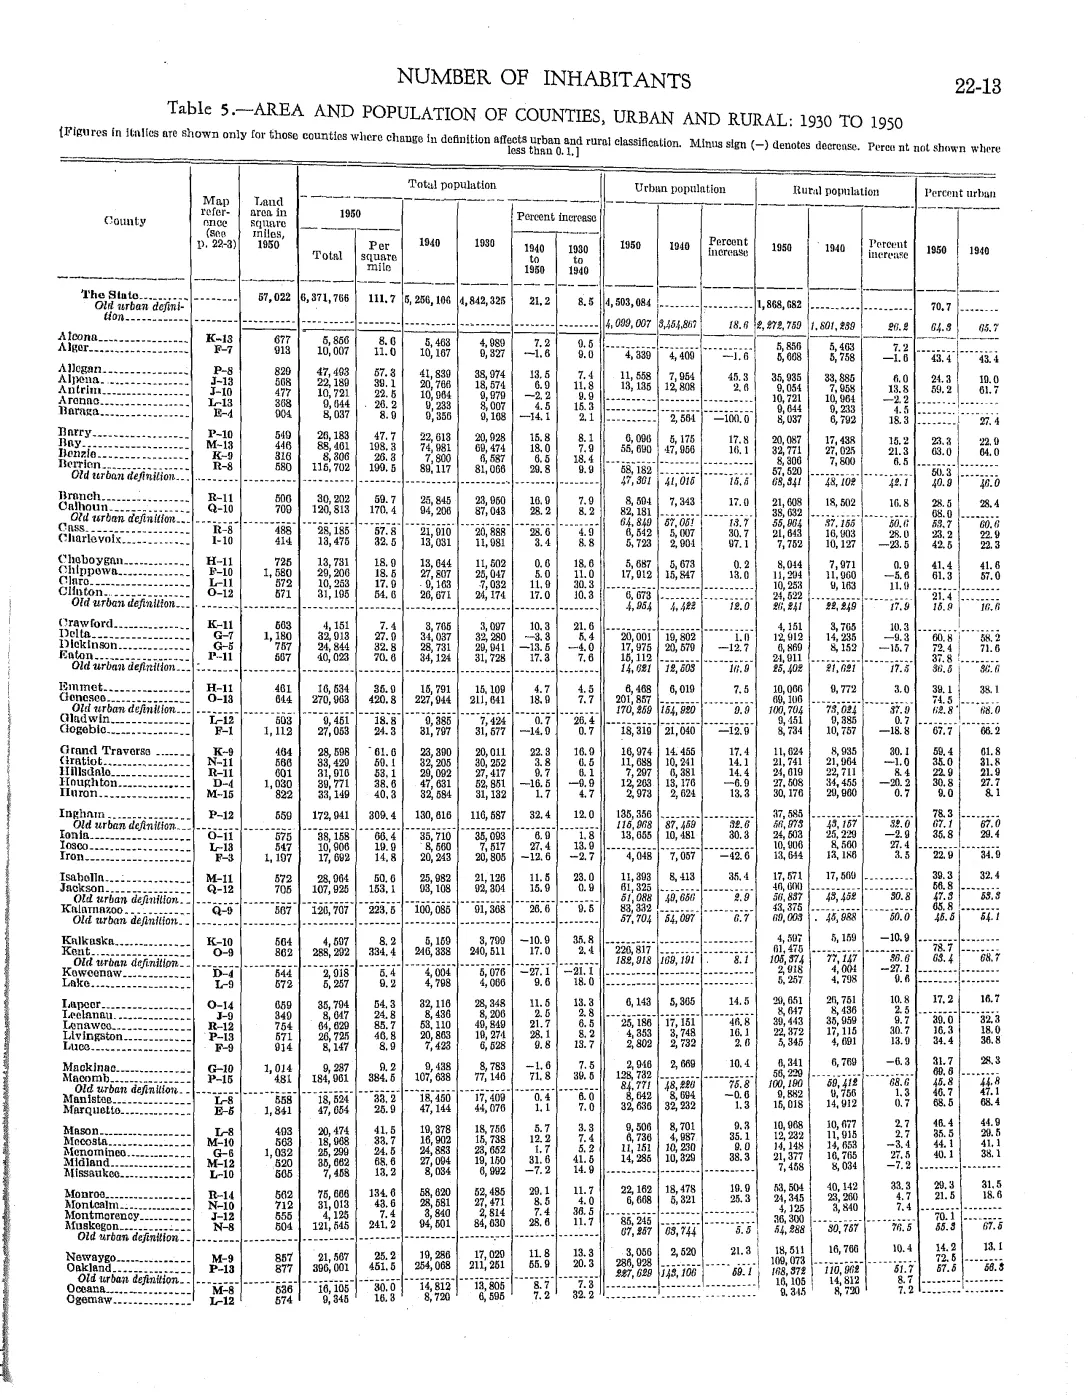
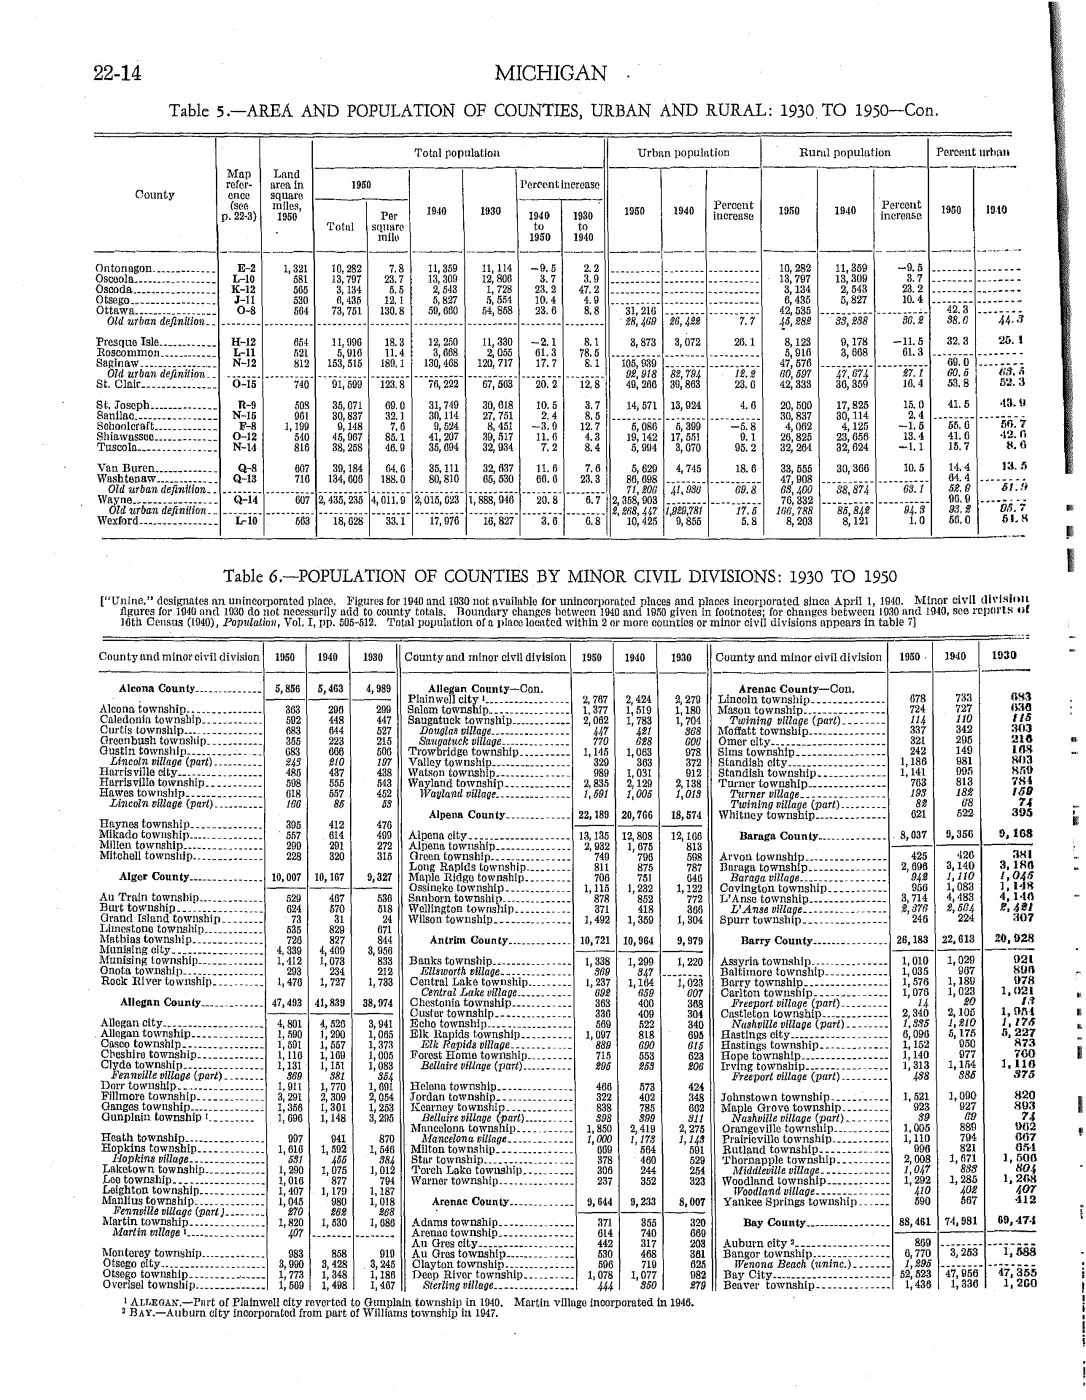
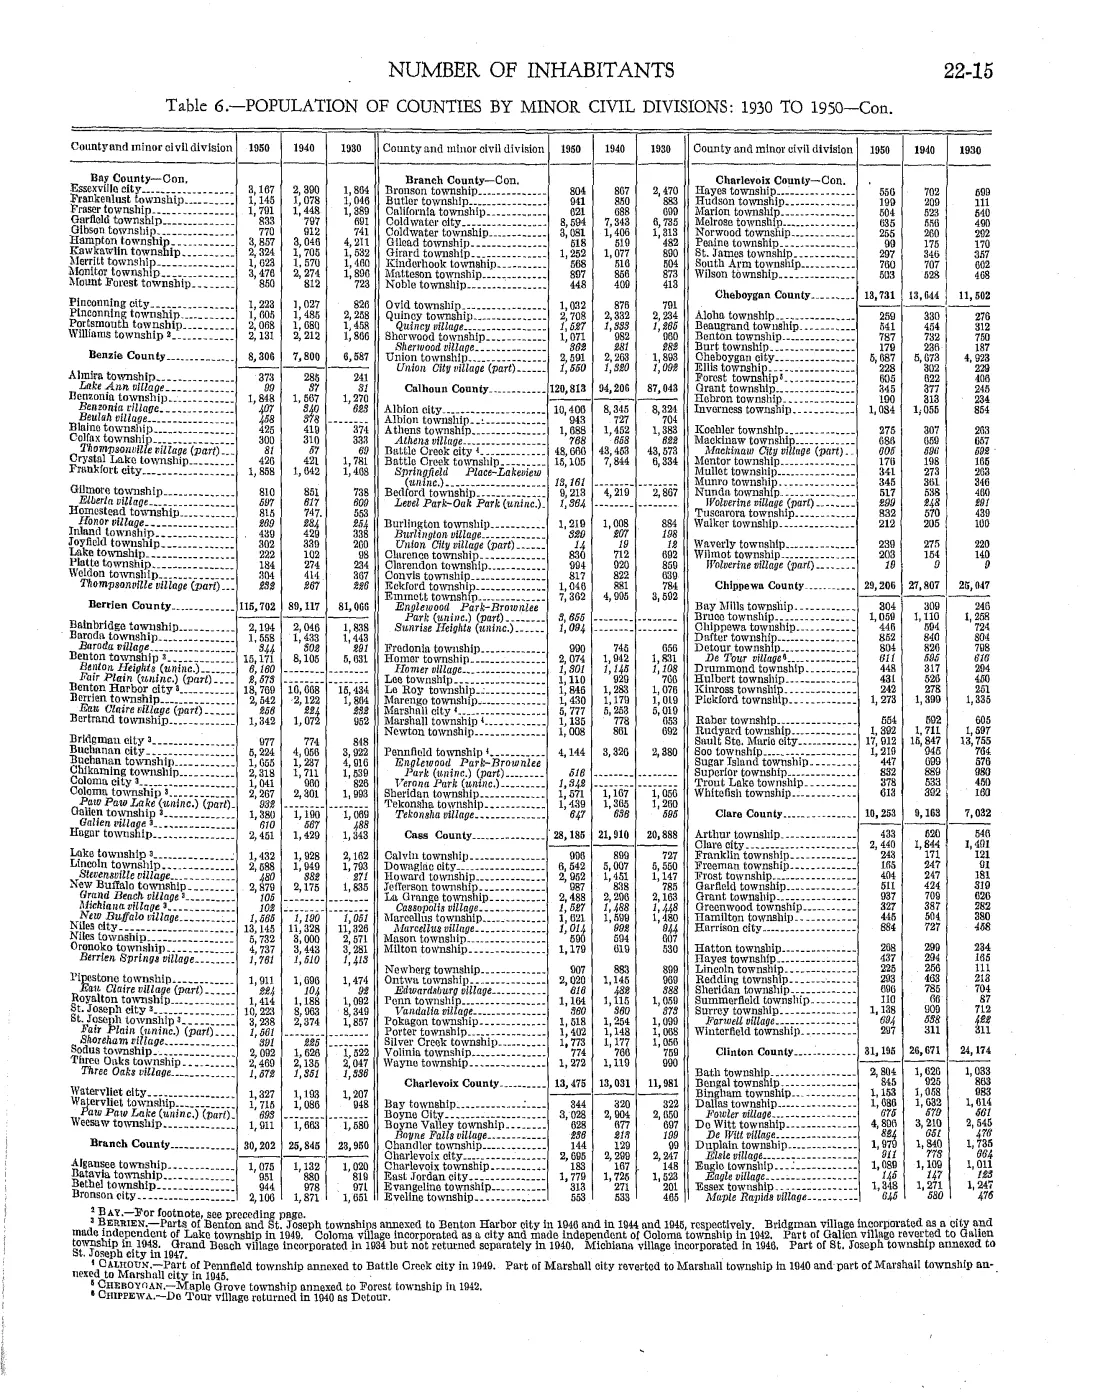
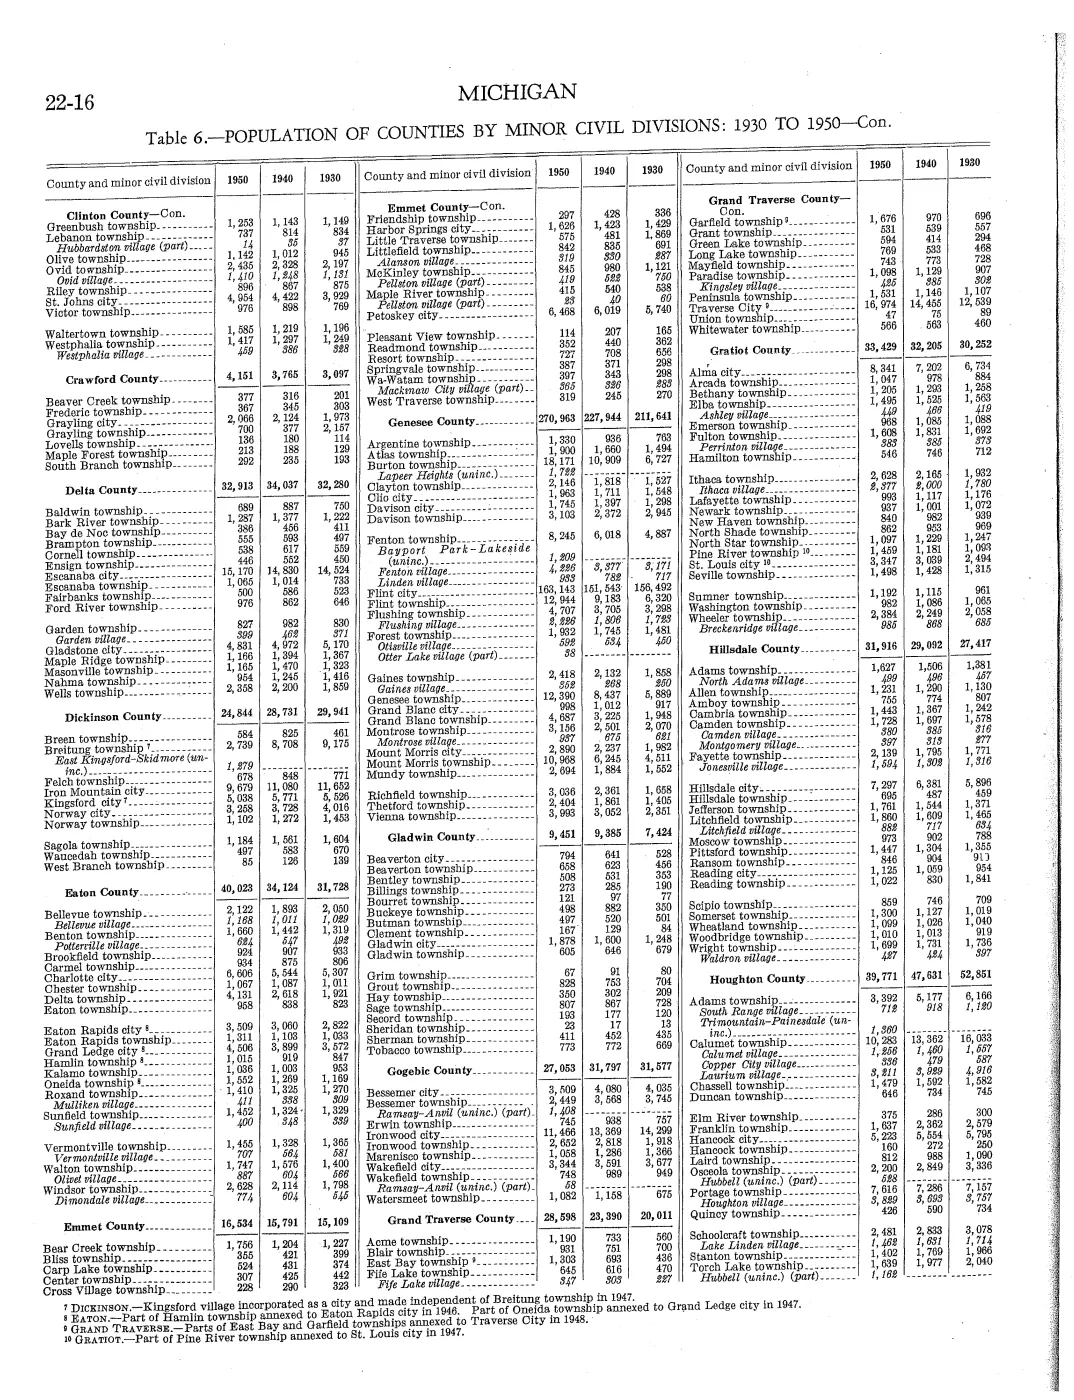
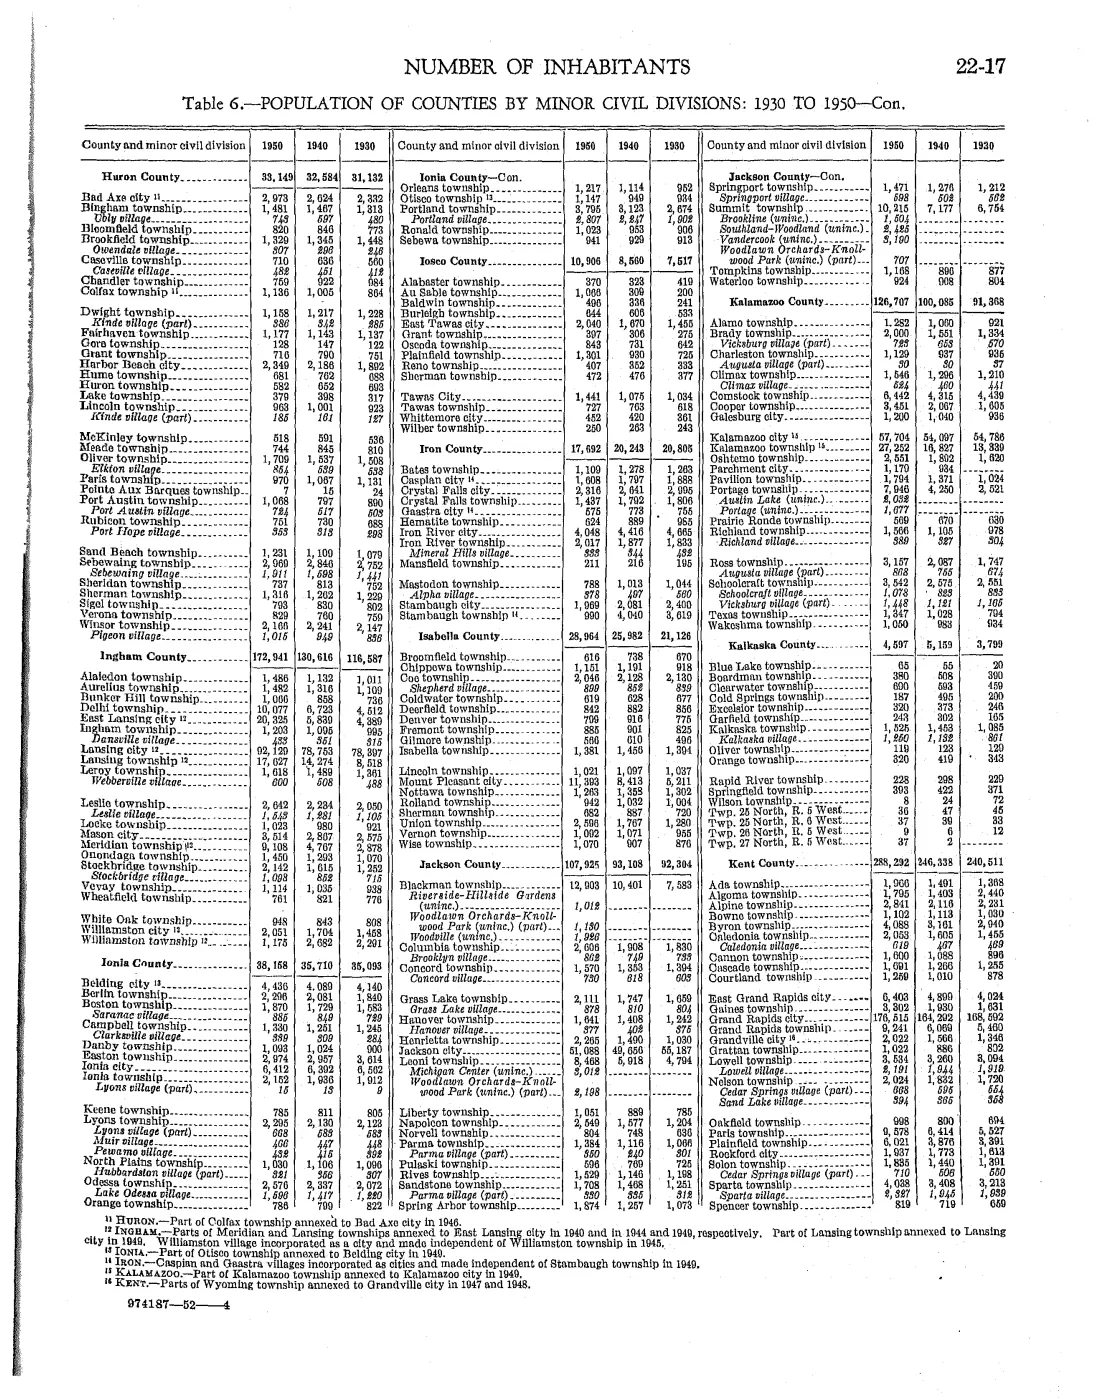
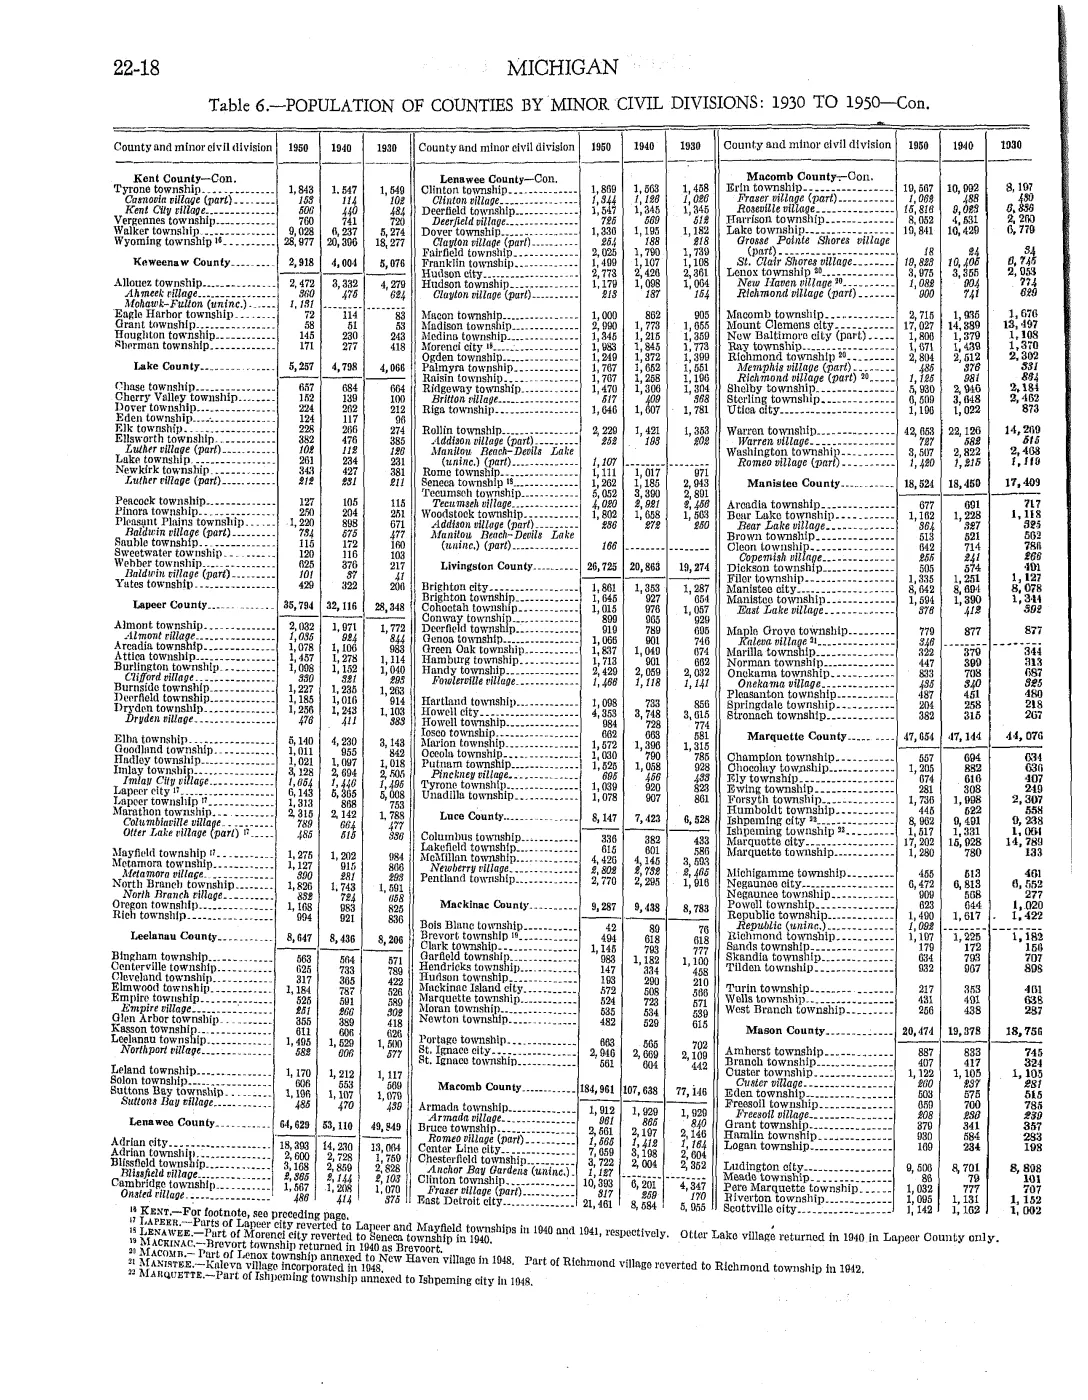
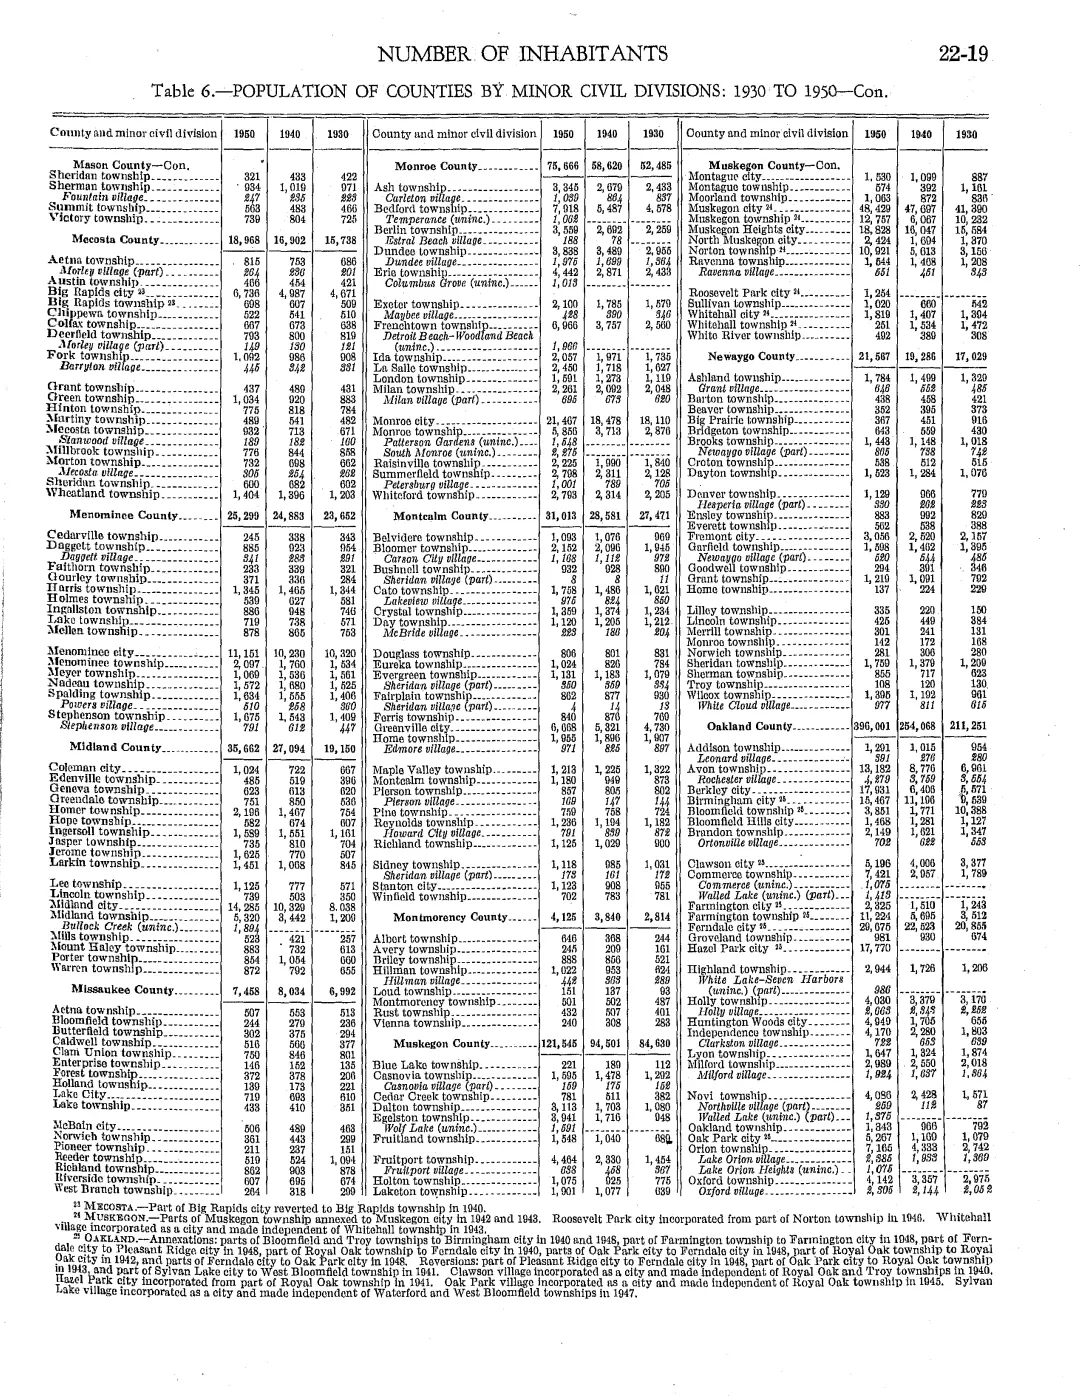
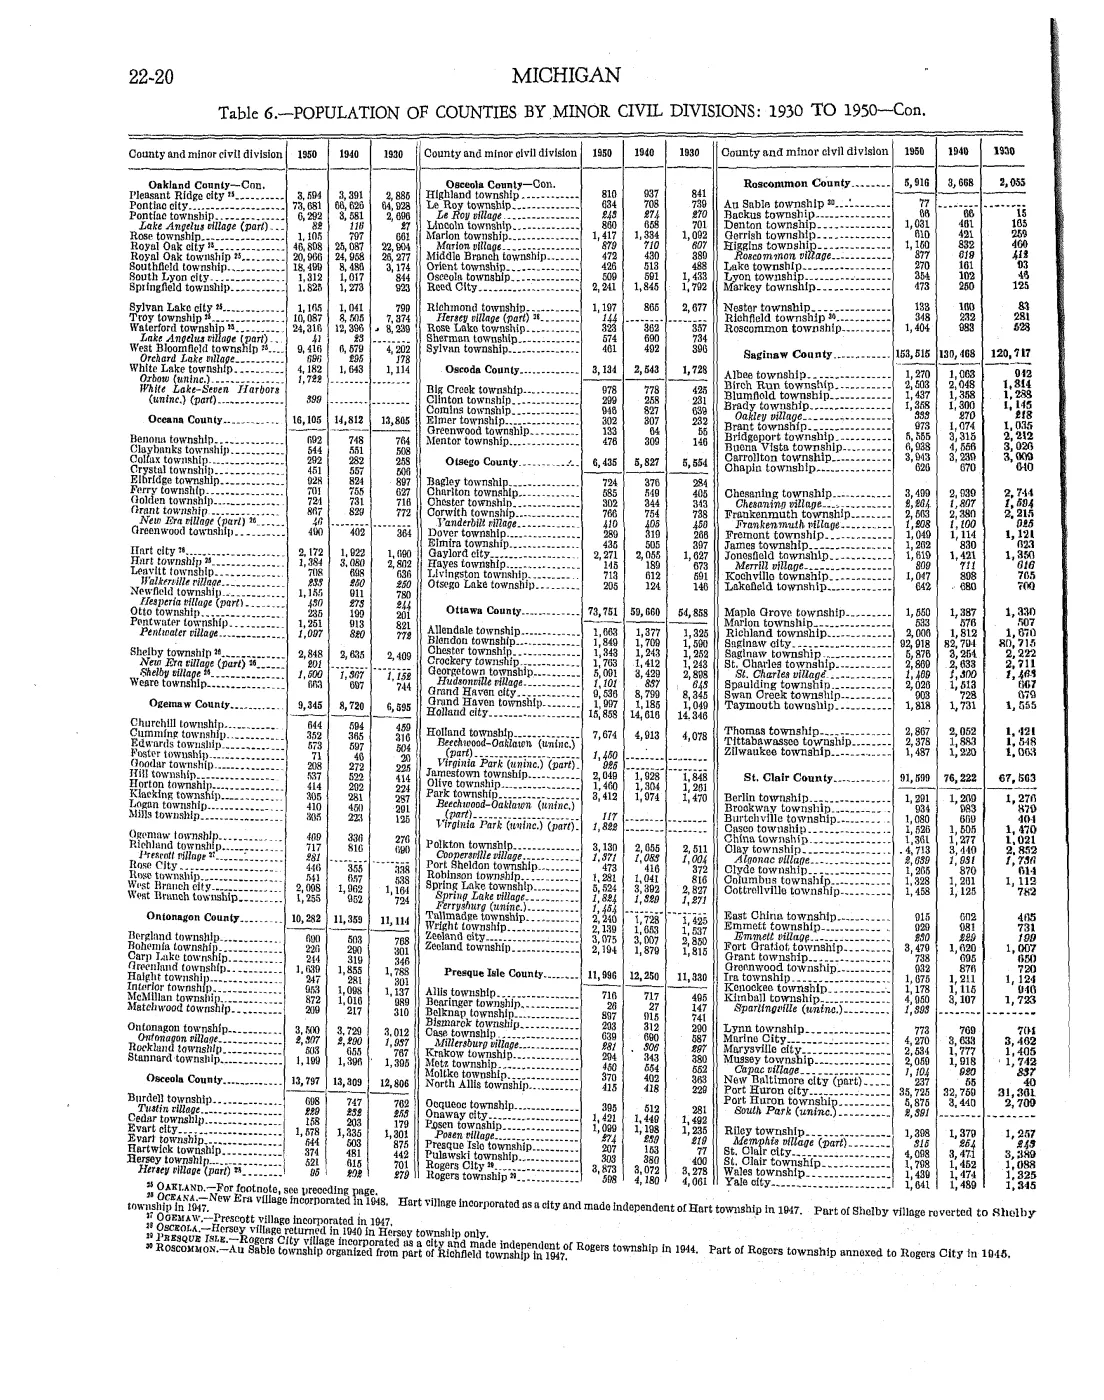
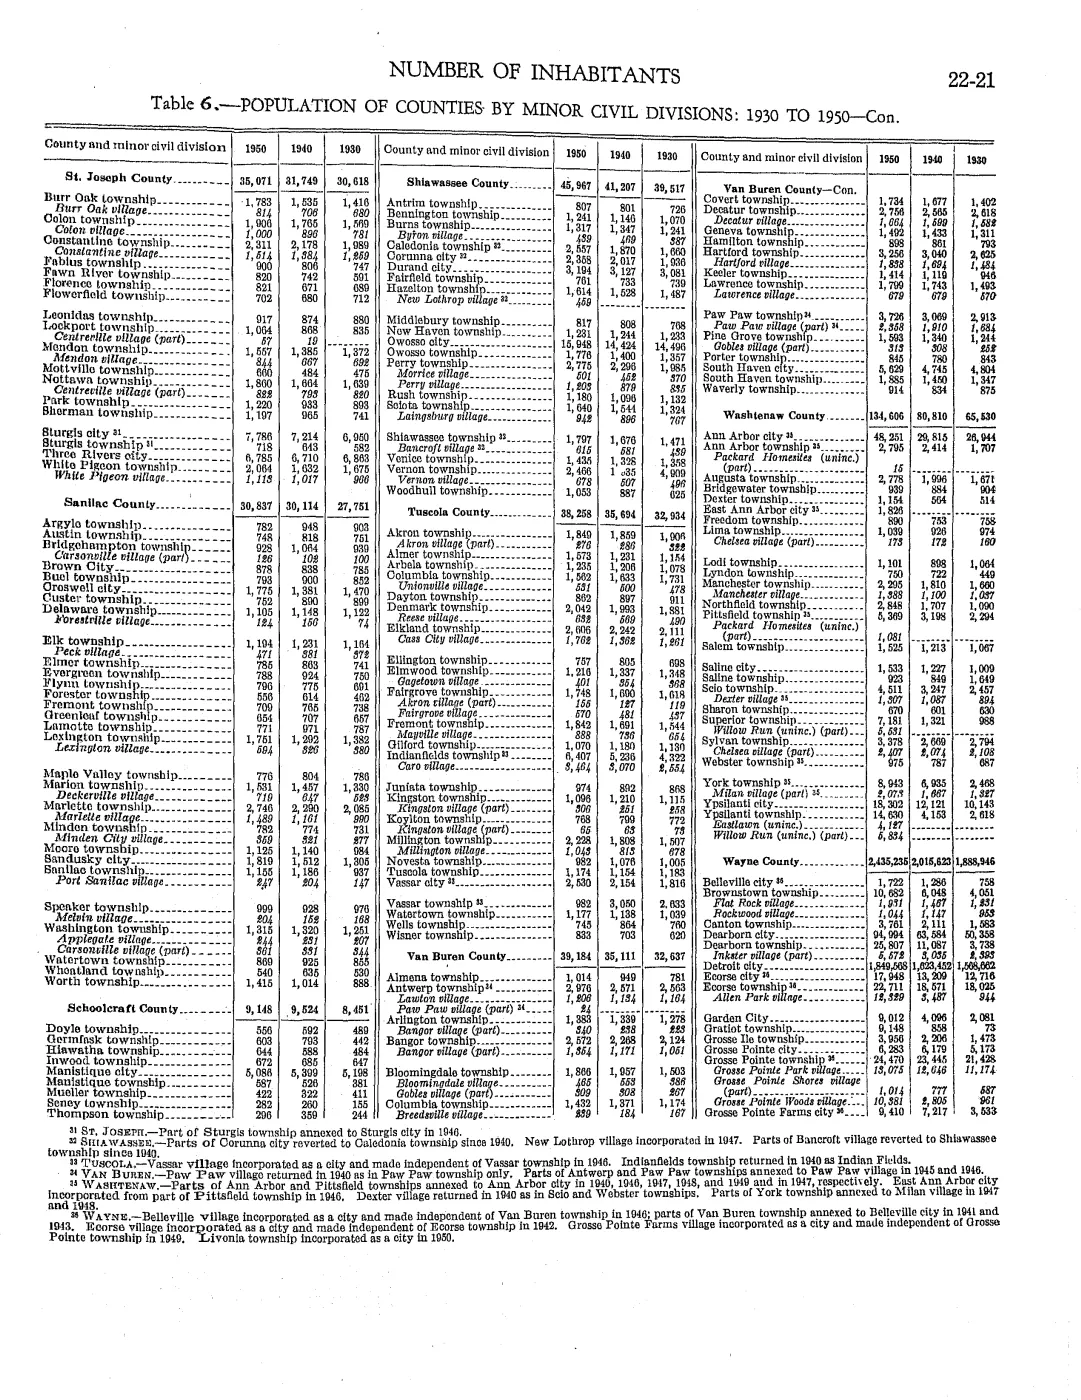
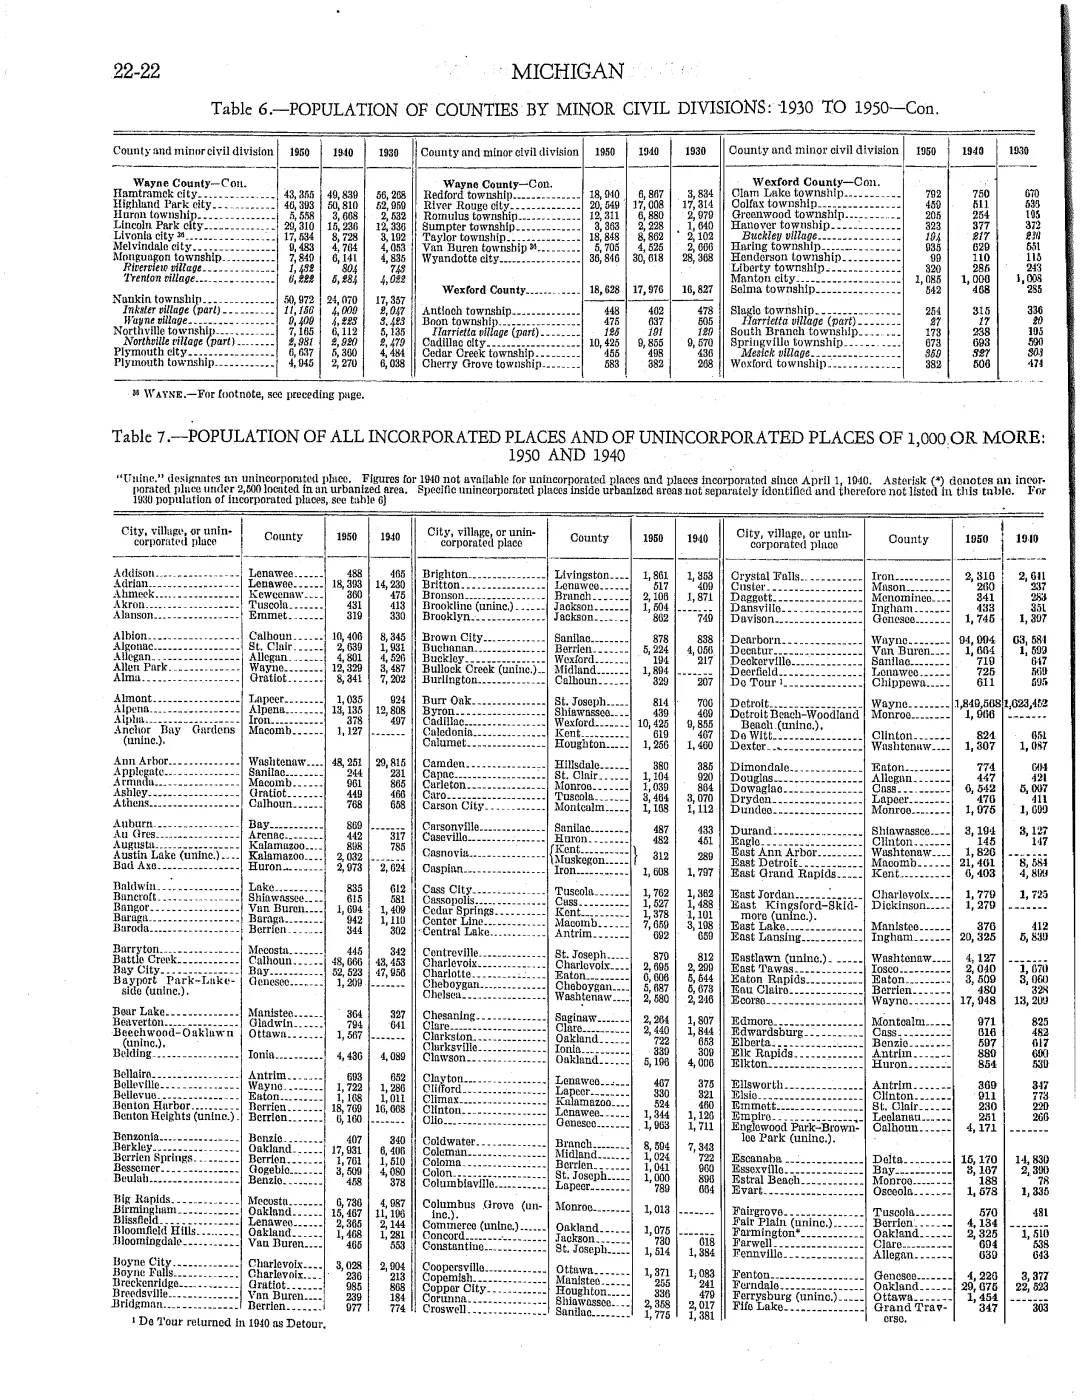
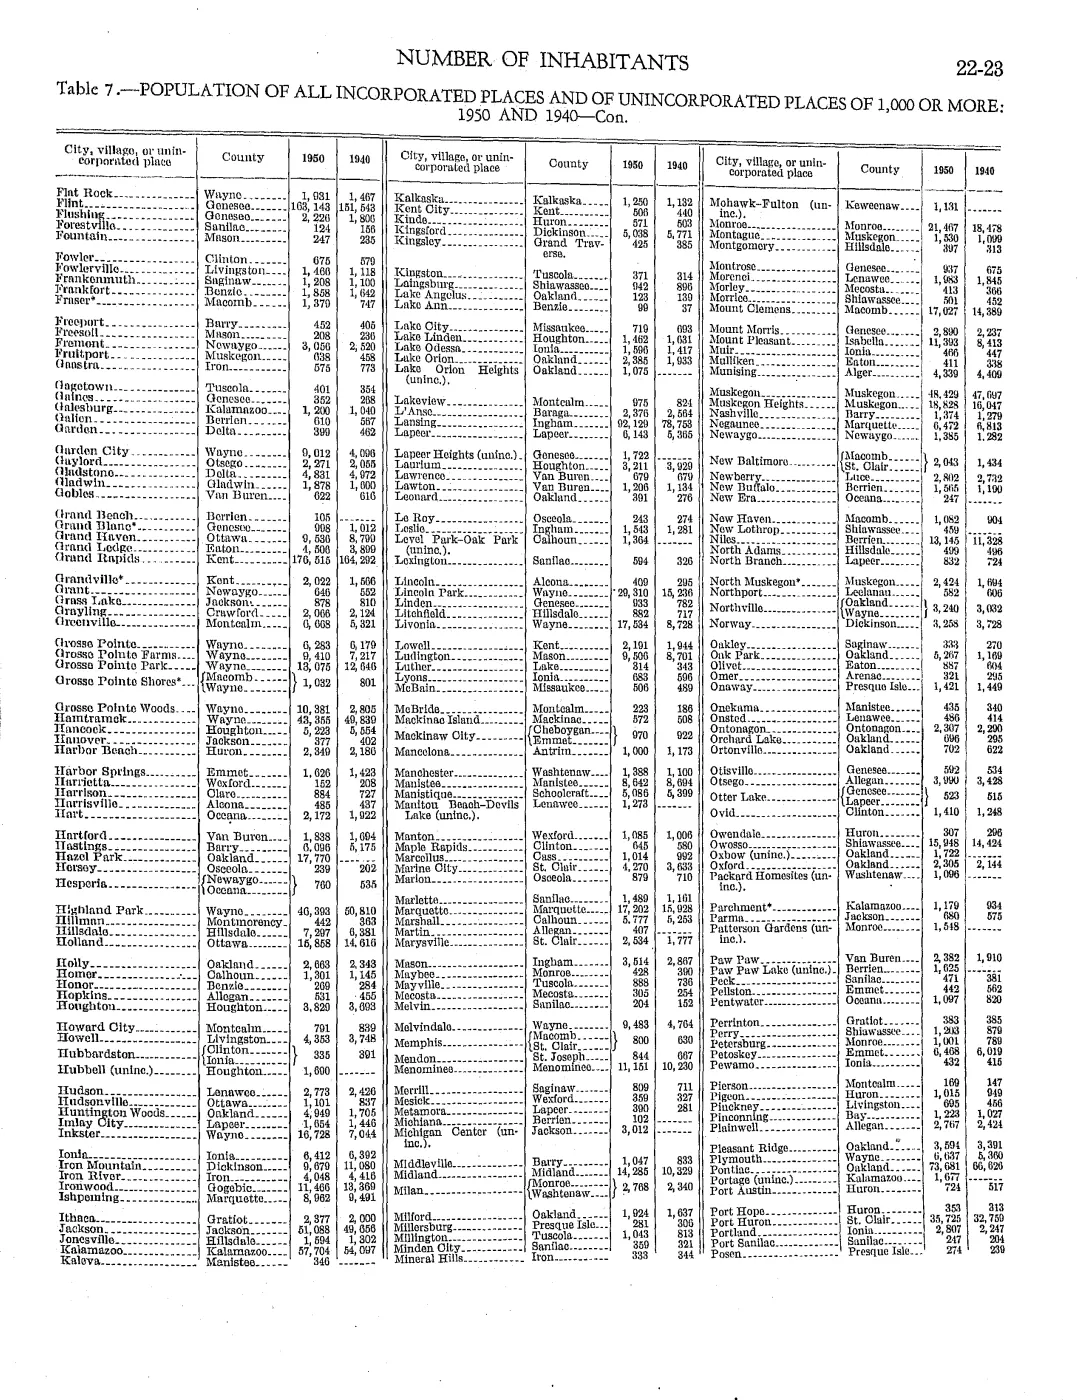
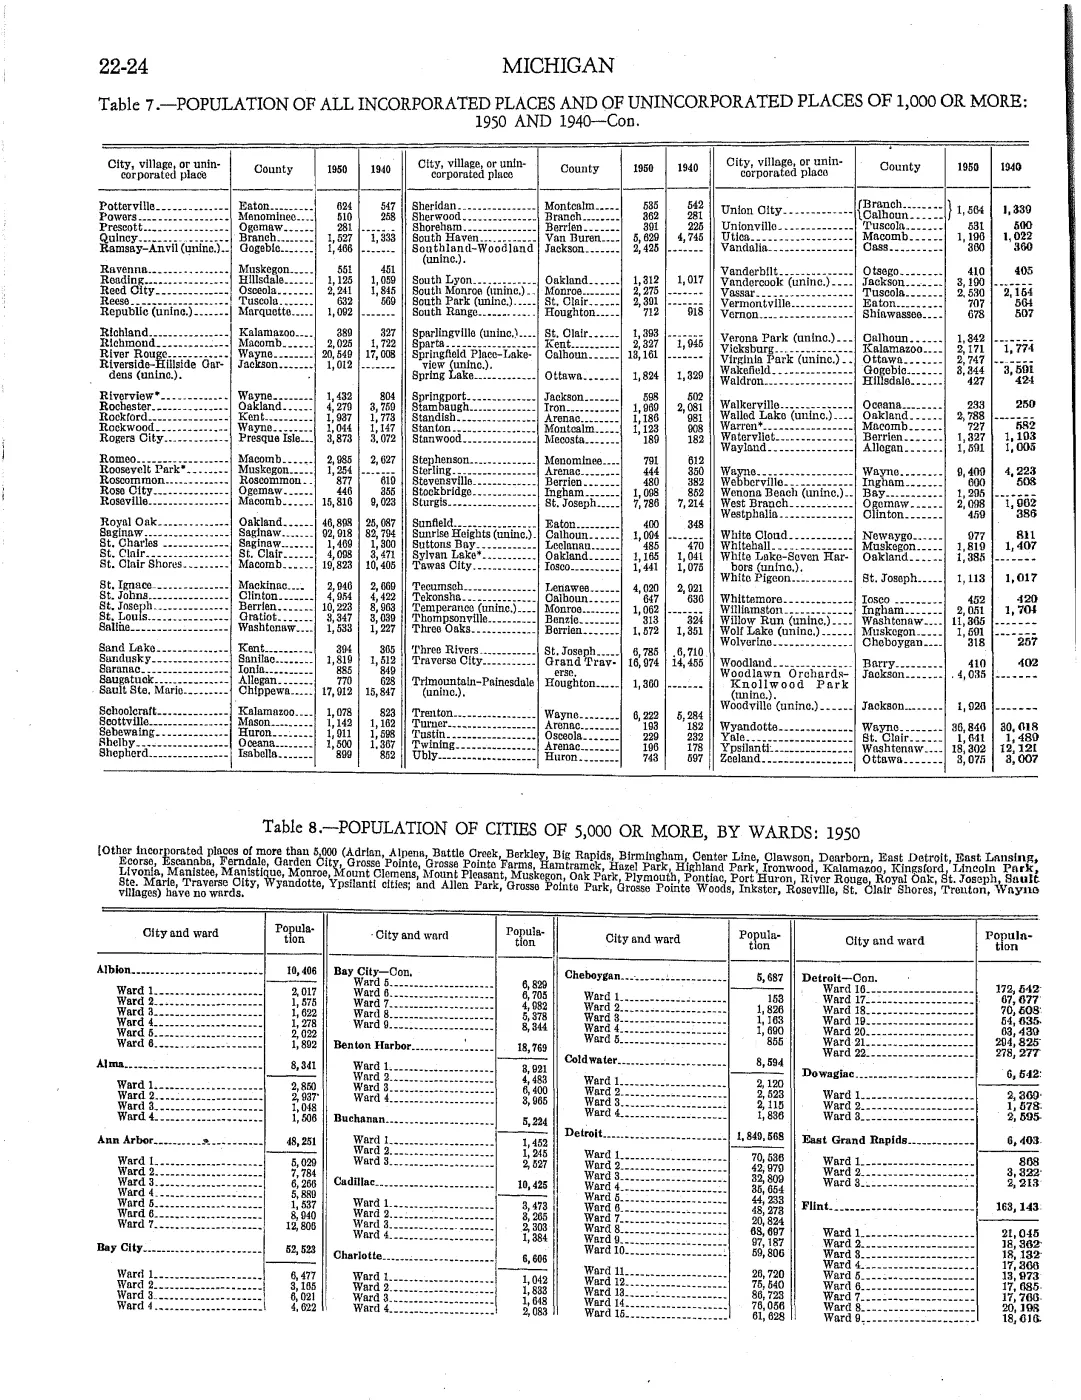
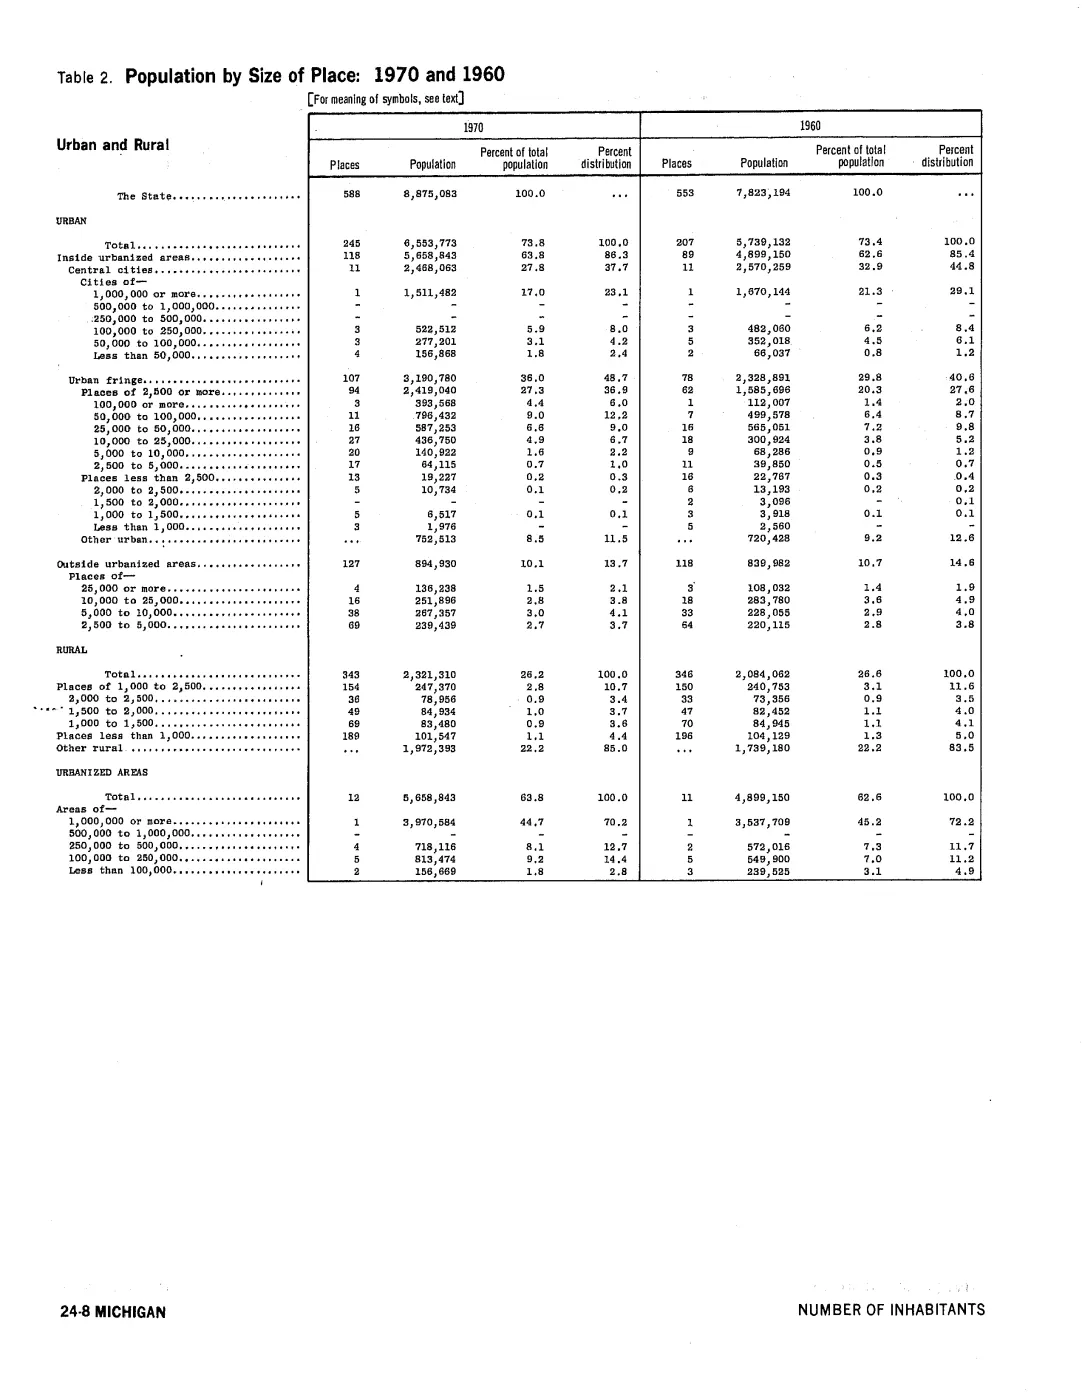
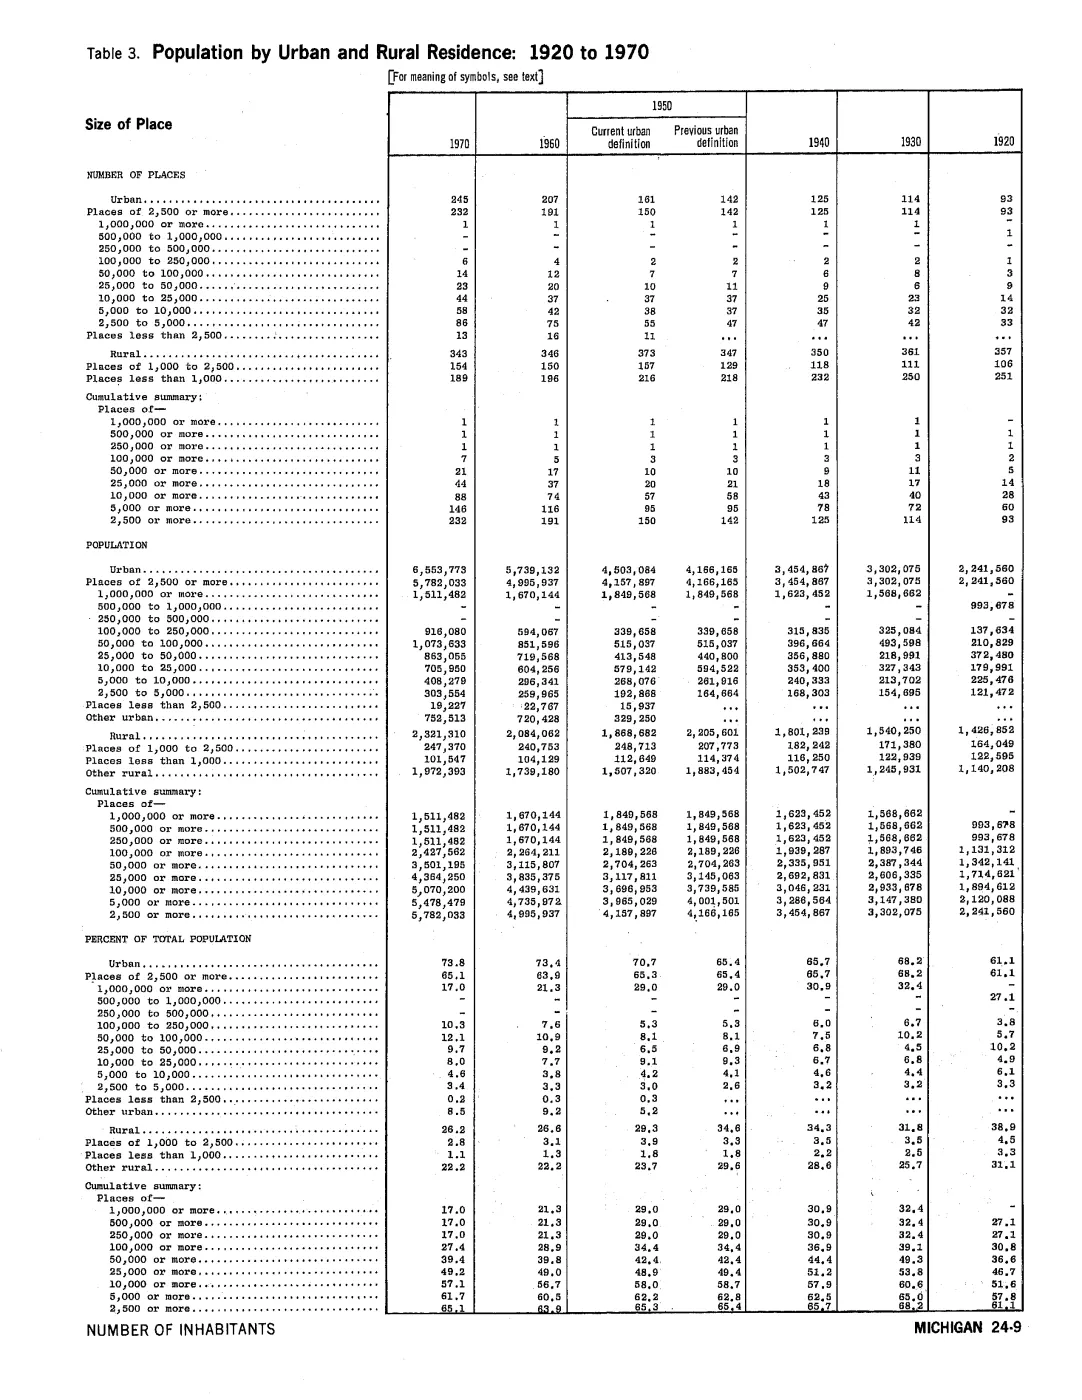
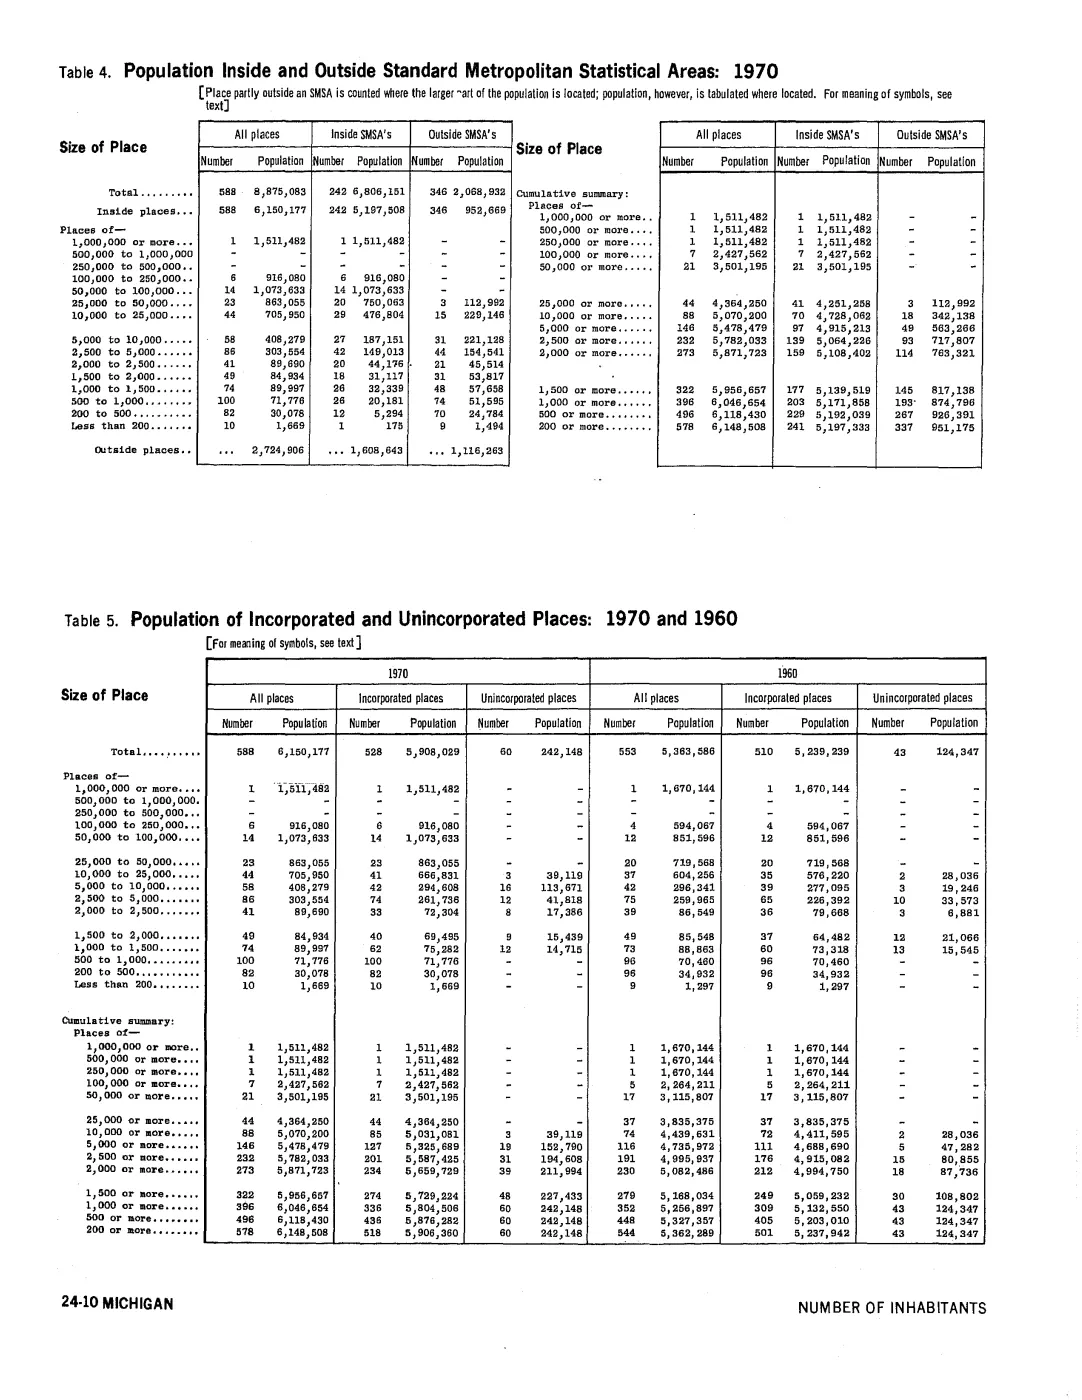
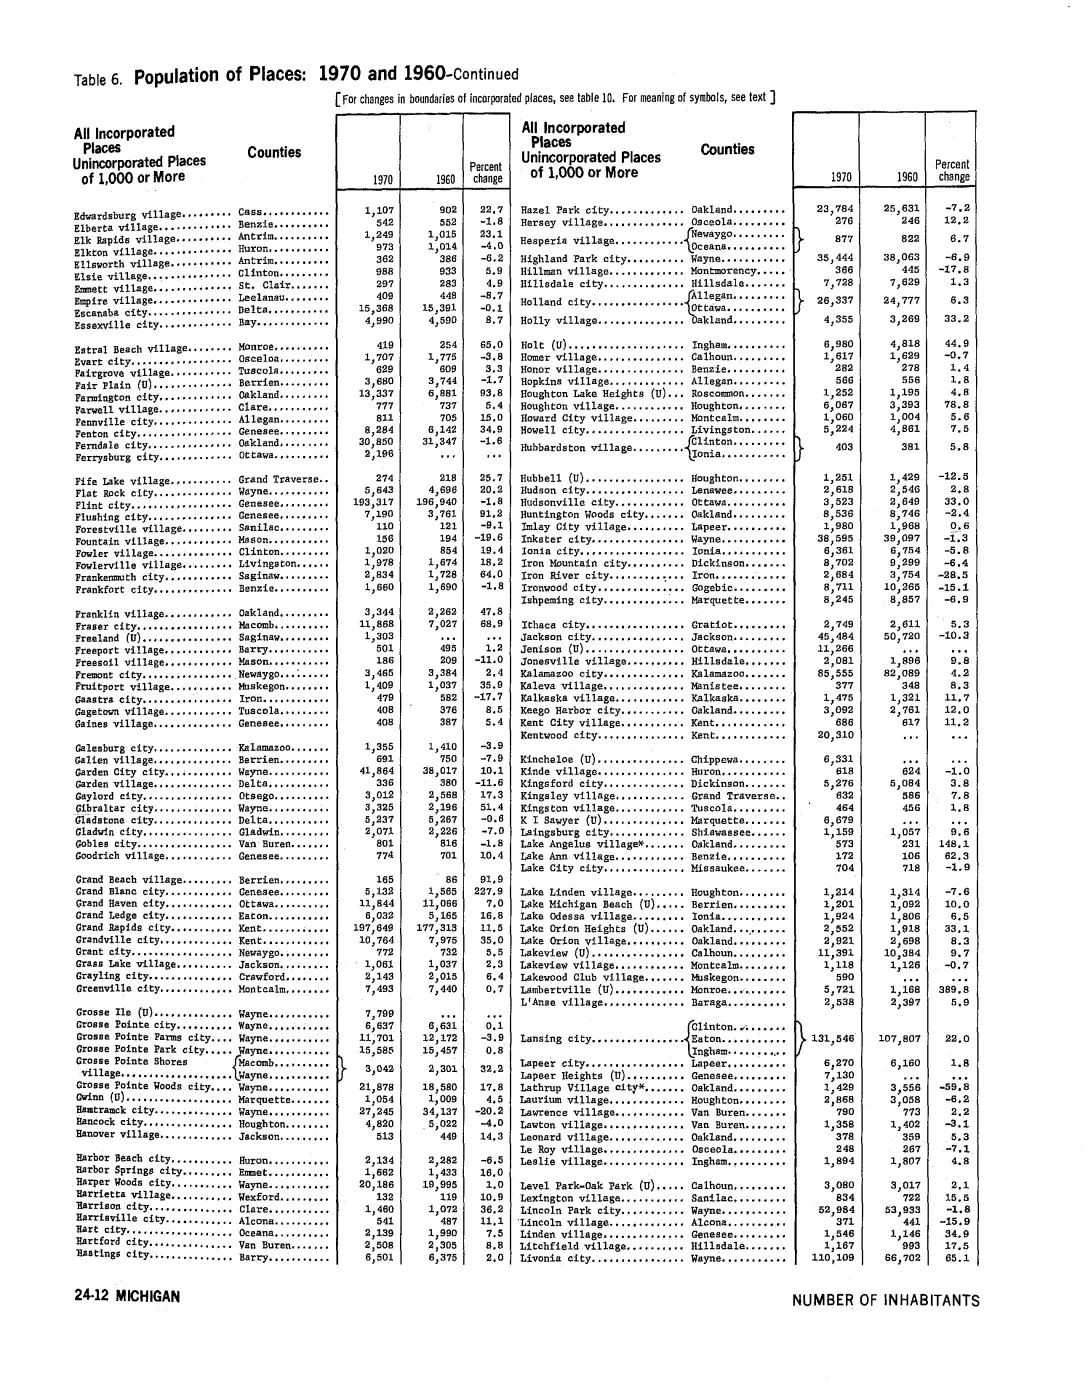
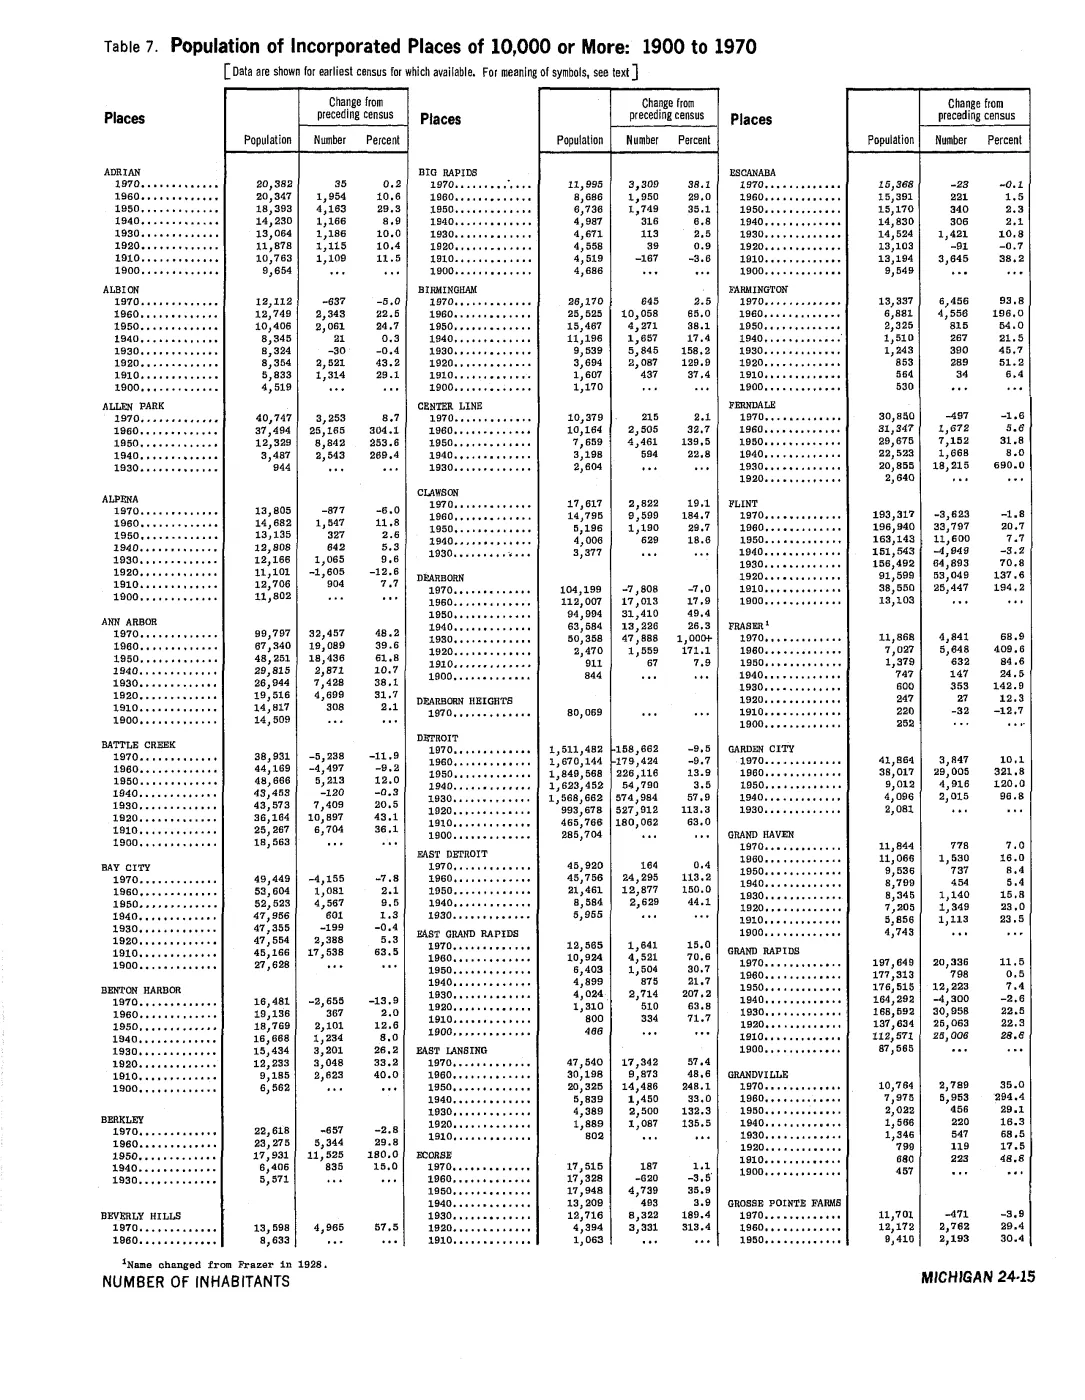
- Table gives Peaine/St. James counts of 170/357 in 1930, 175/346 in 1940, and 99/297 in 1950.demographics · historical_census · 1950-michigan-number-inhabitants
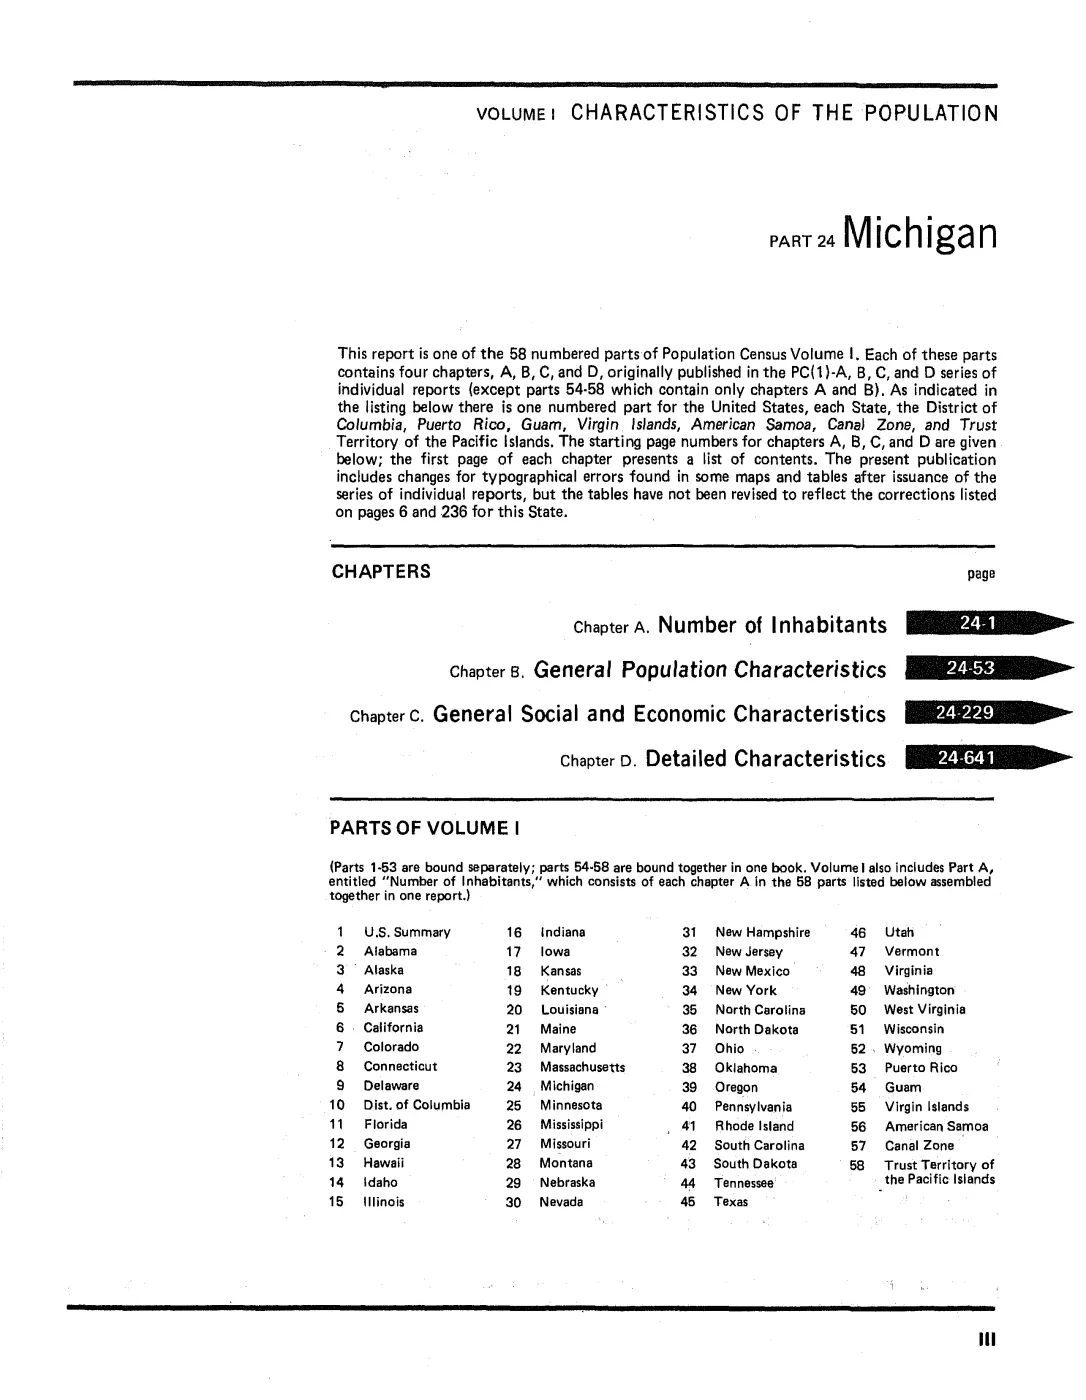
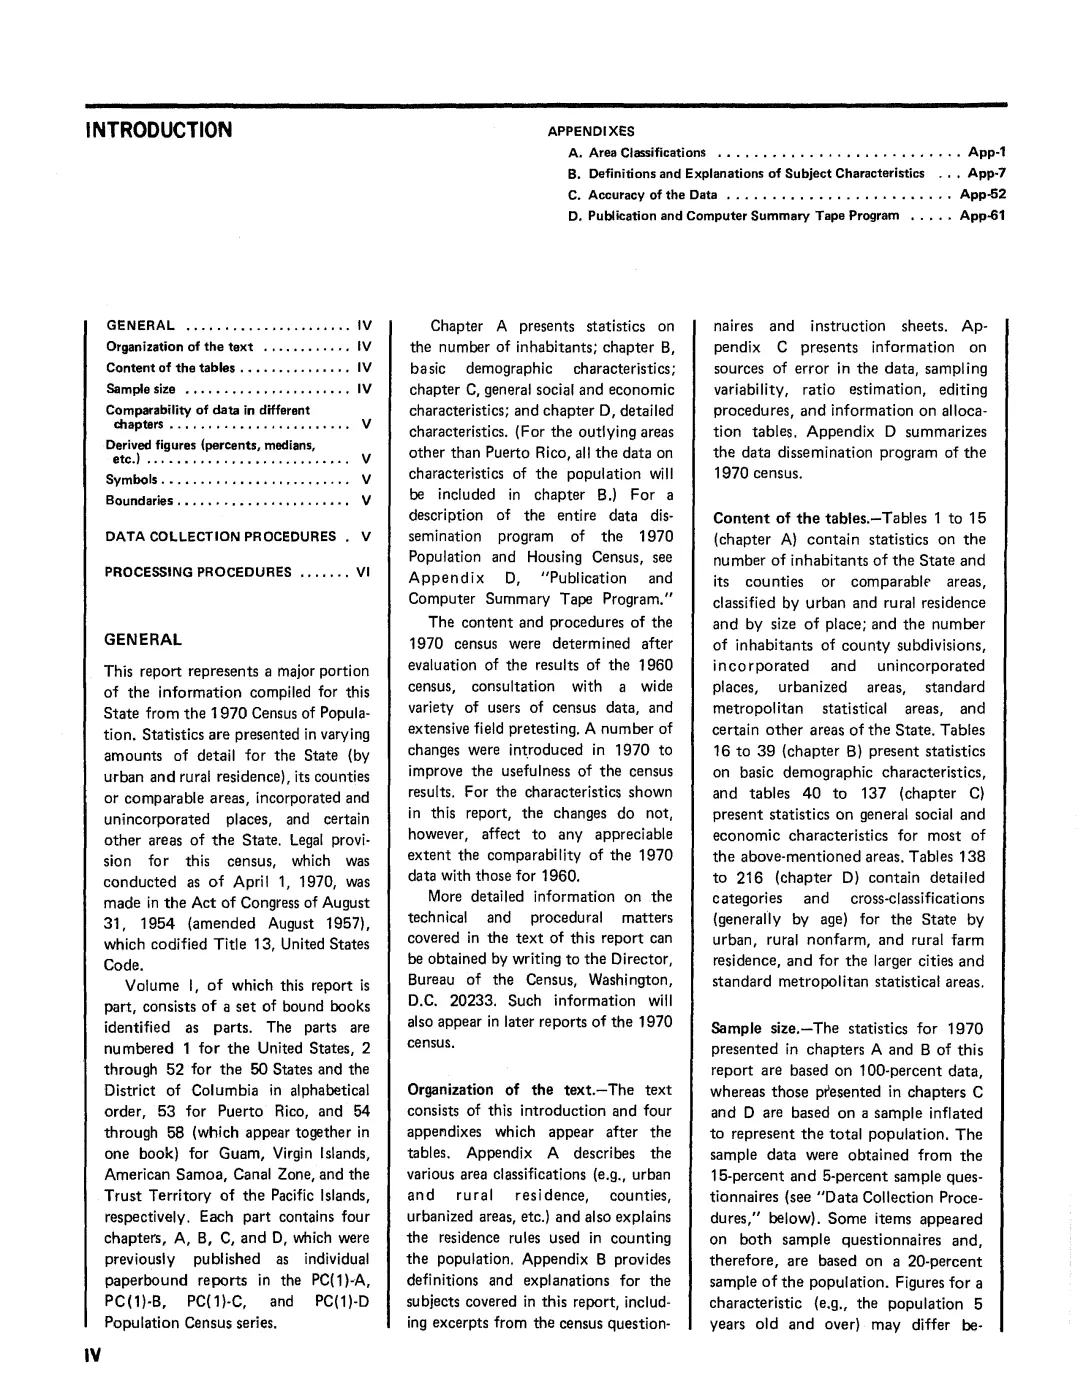
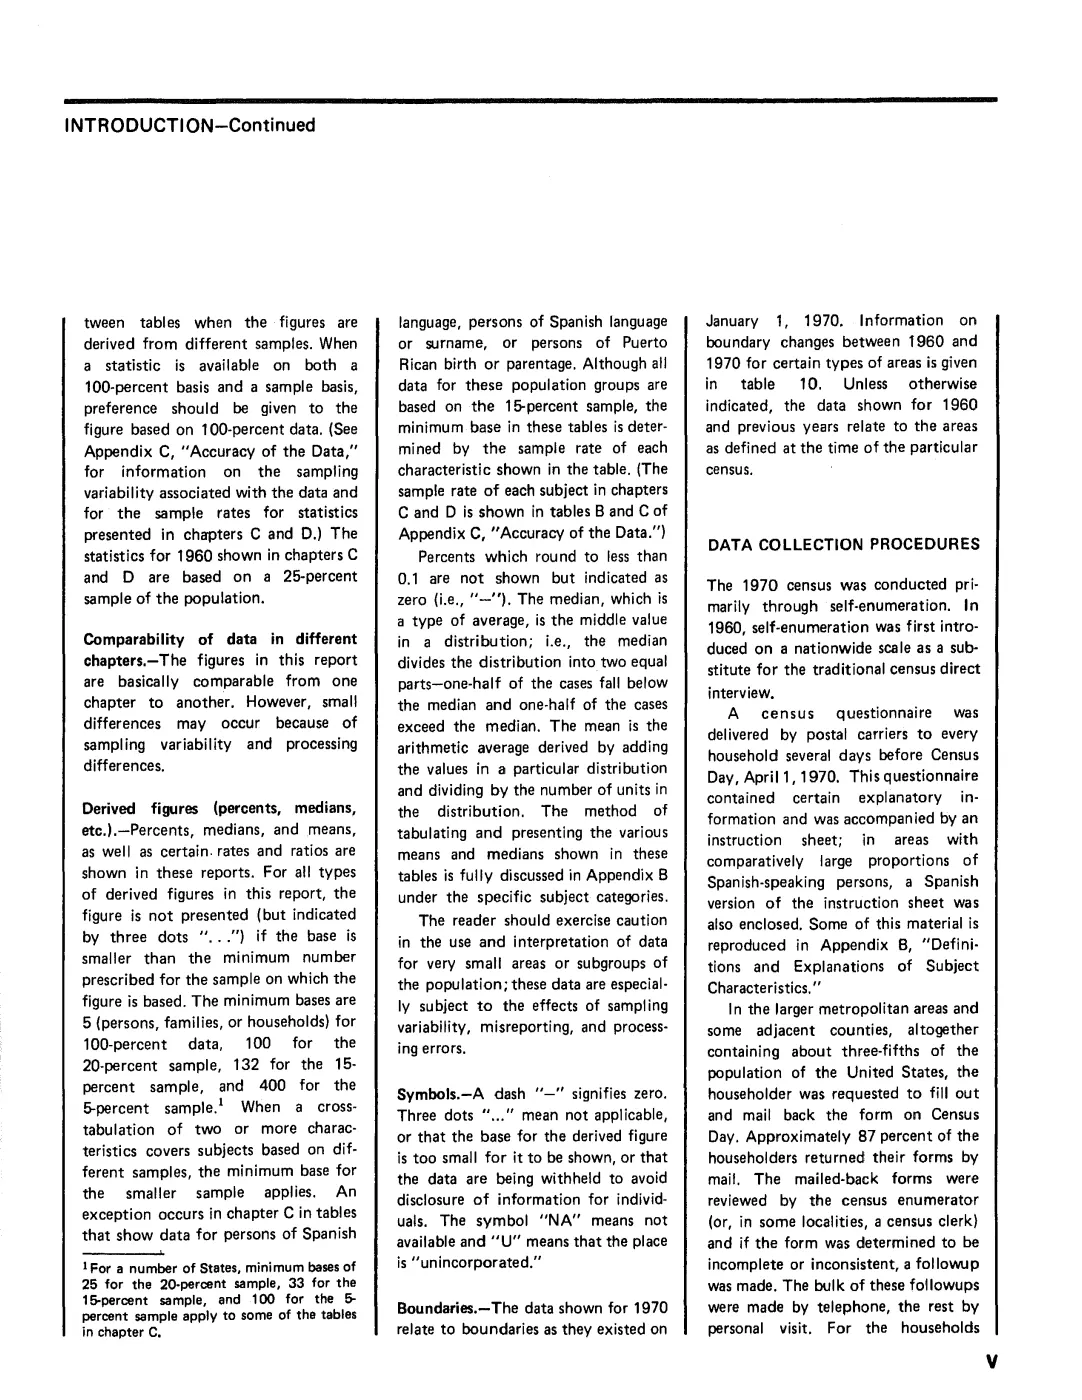
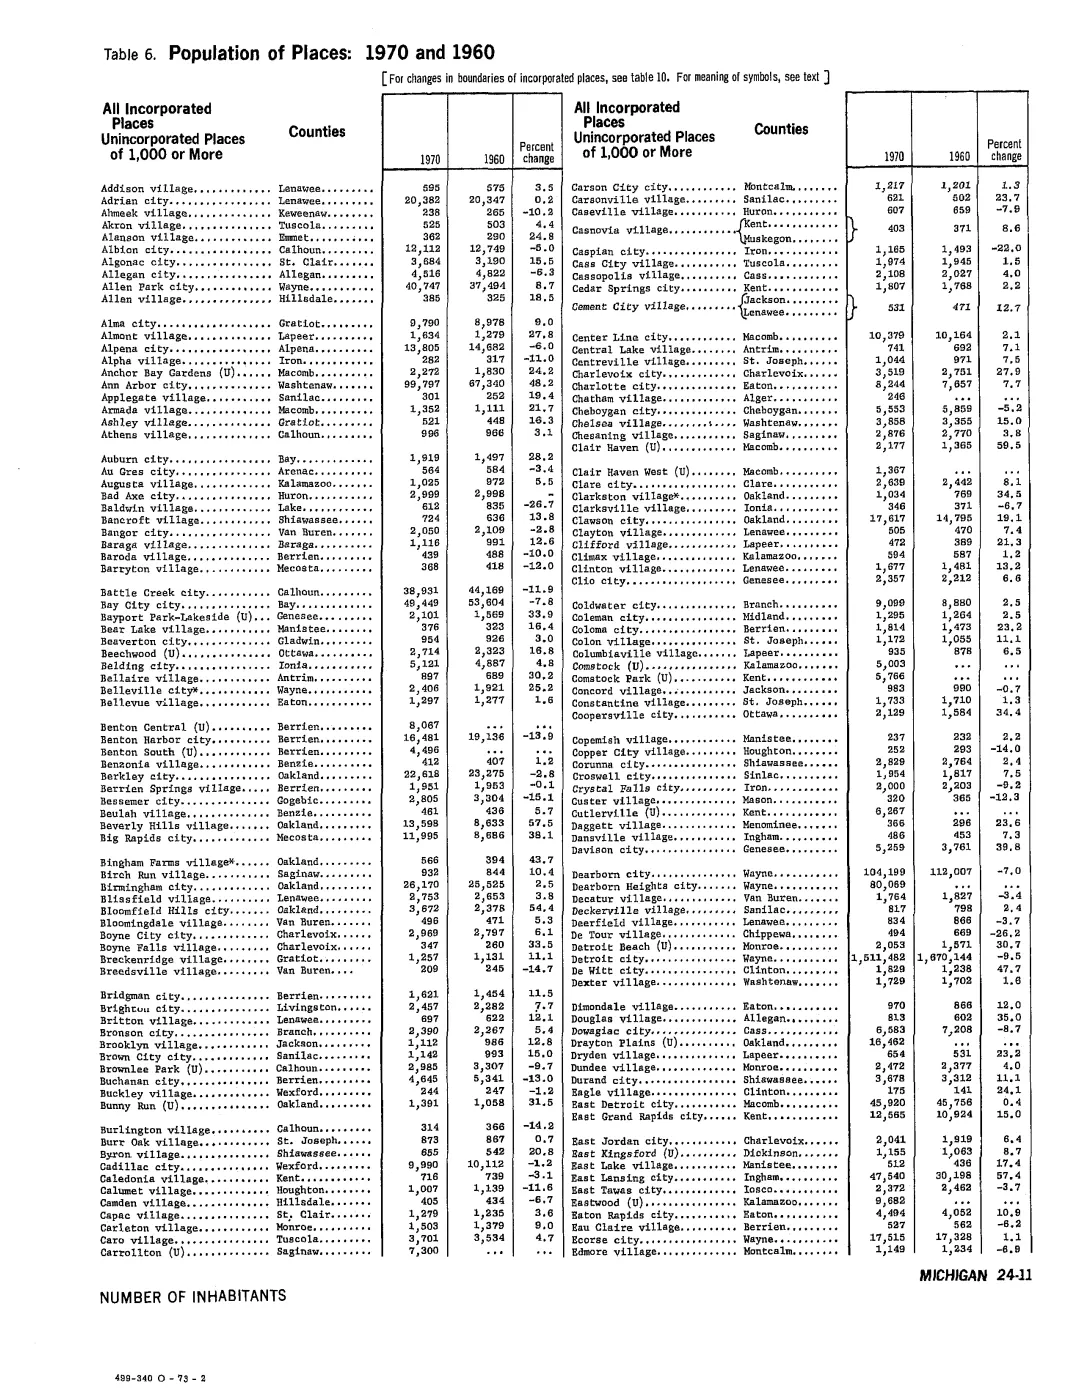
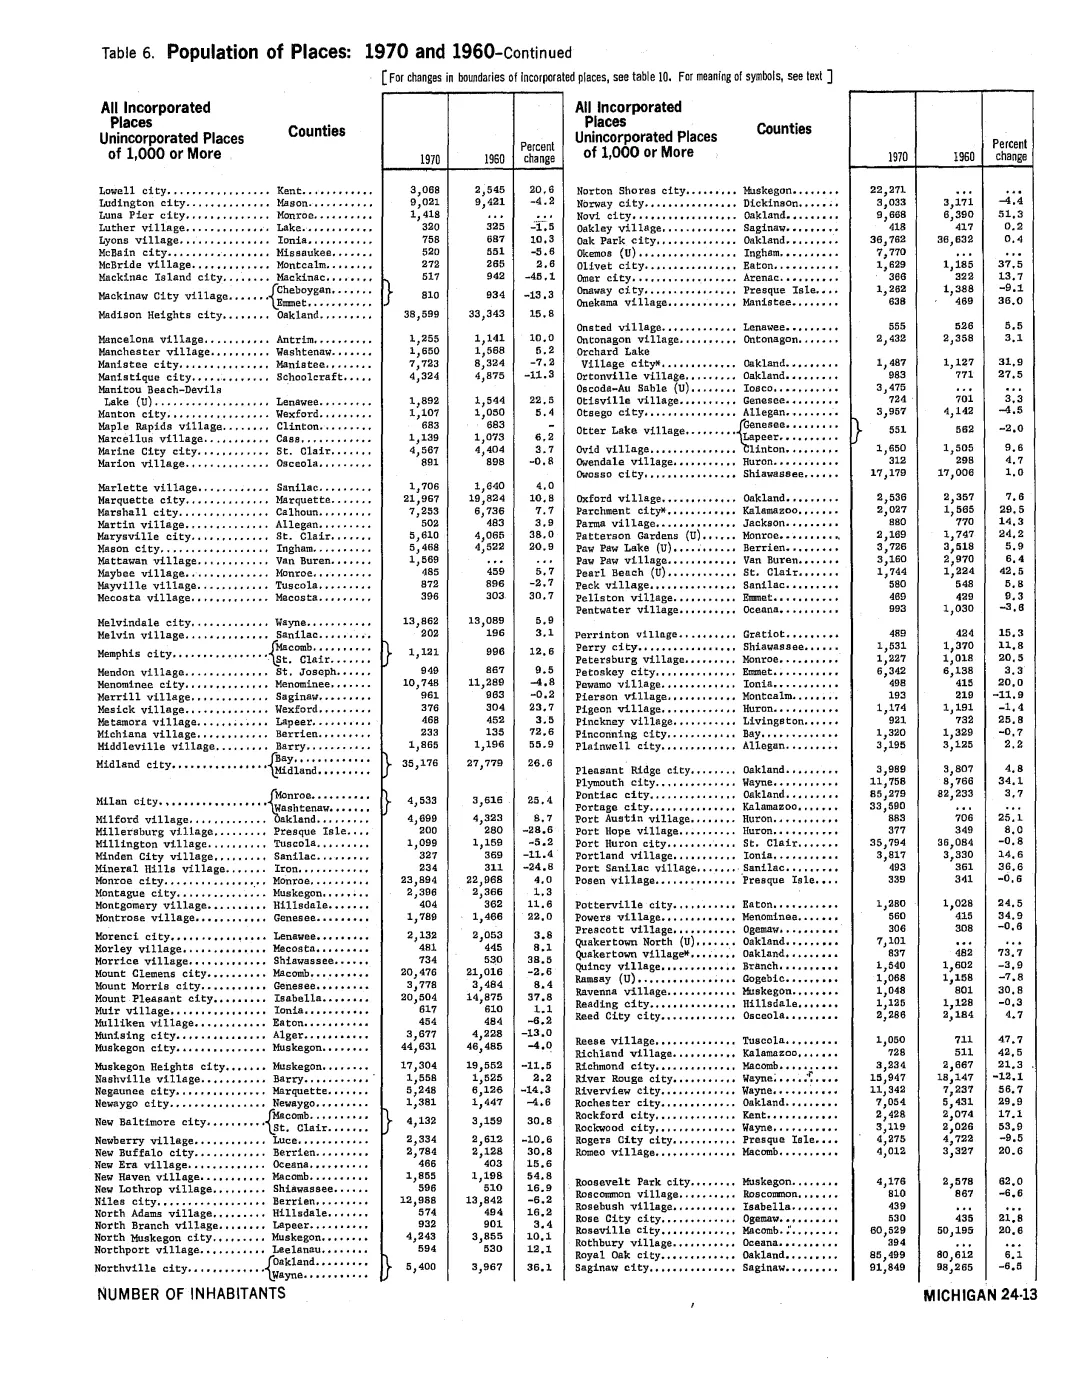
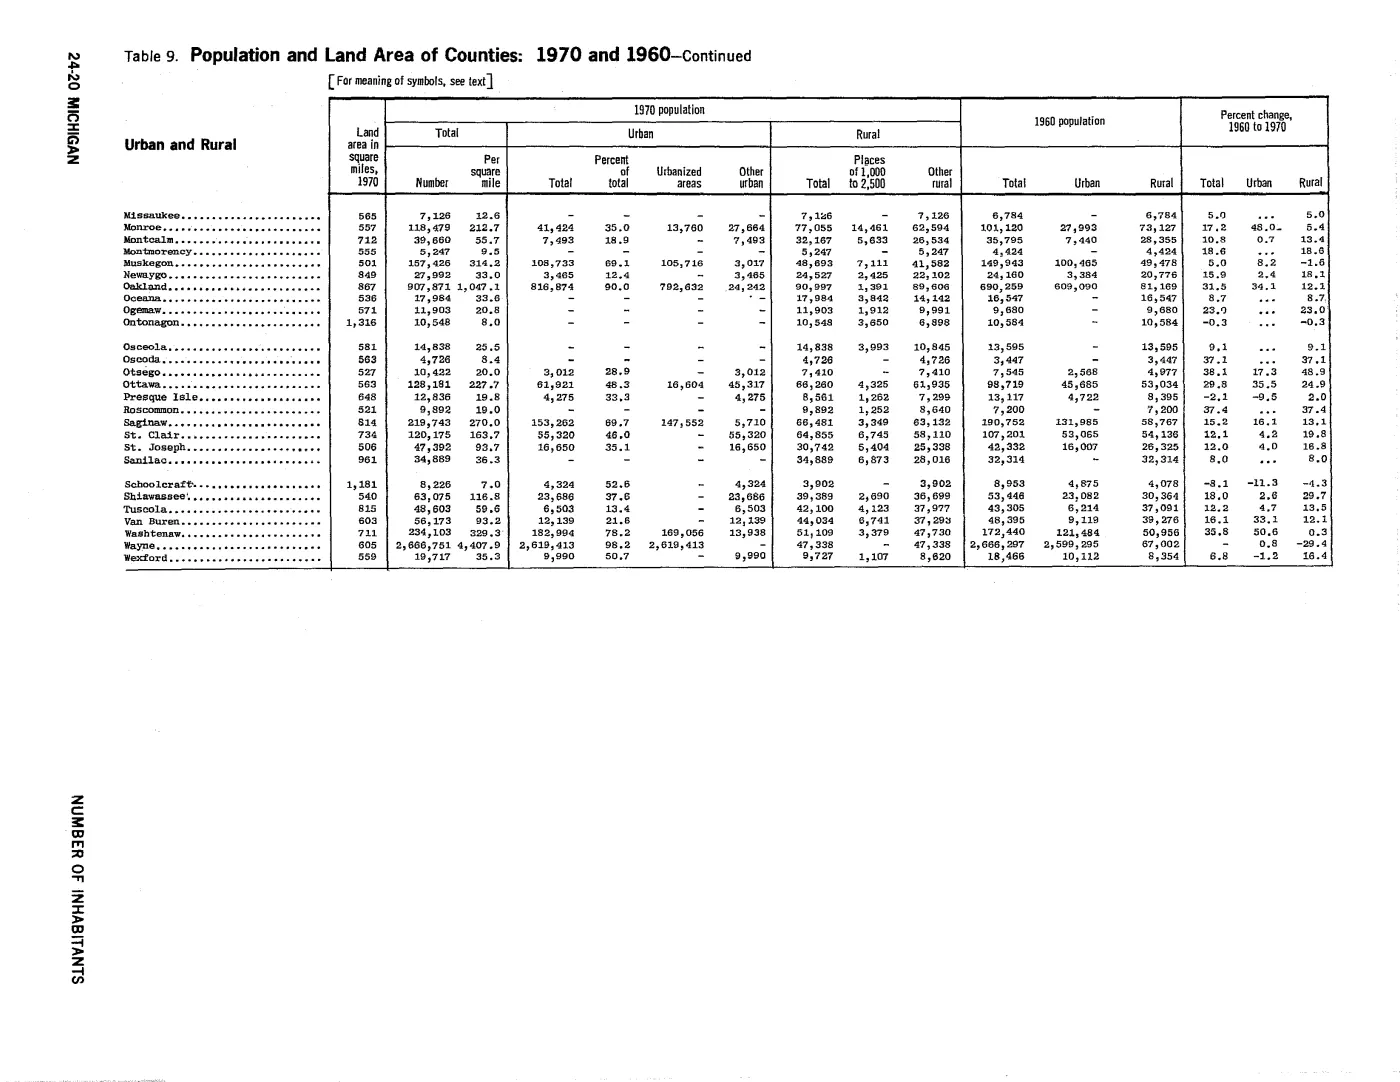
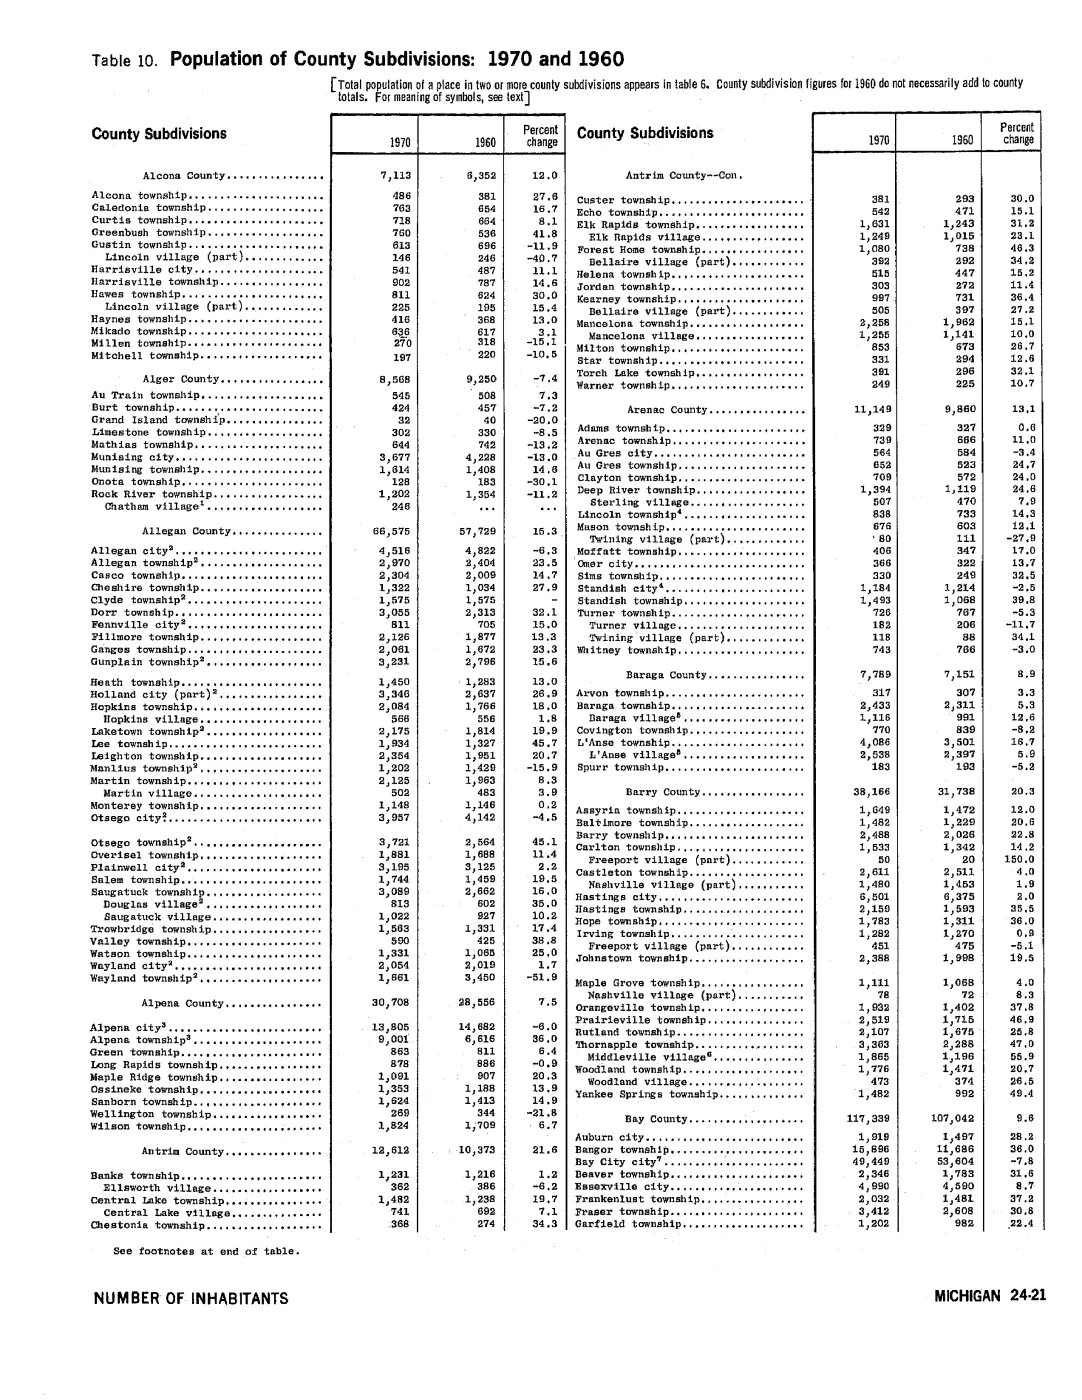
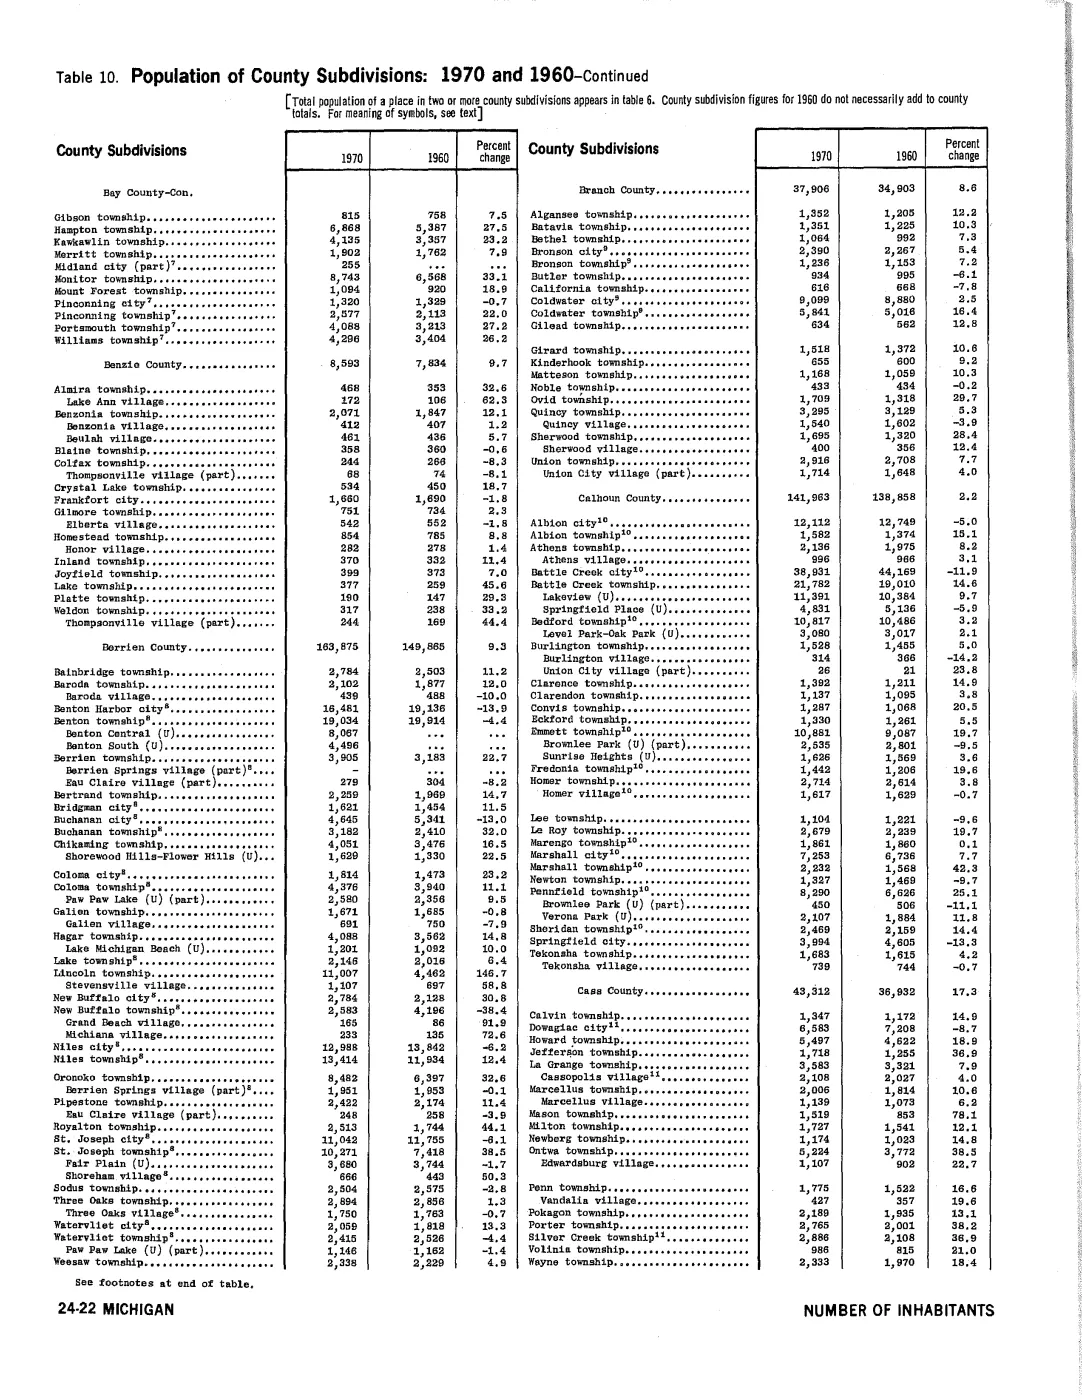
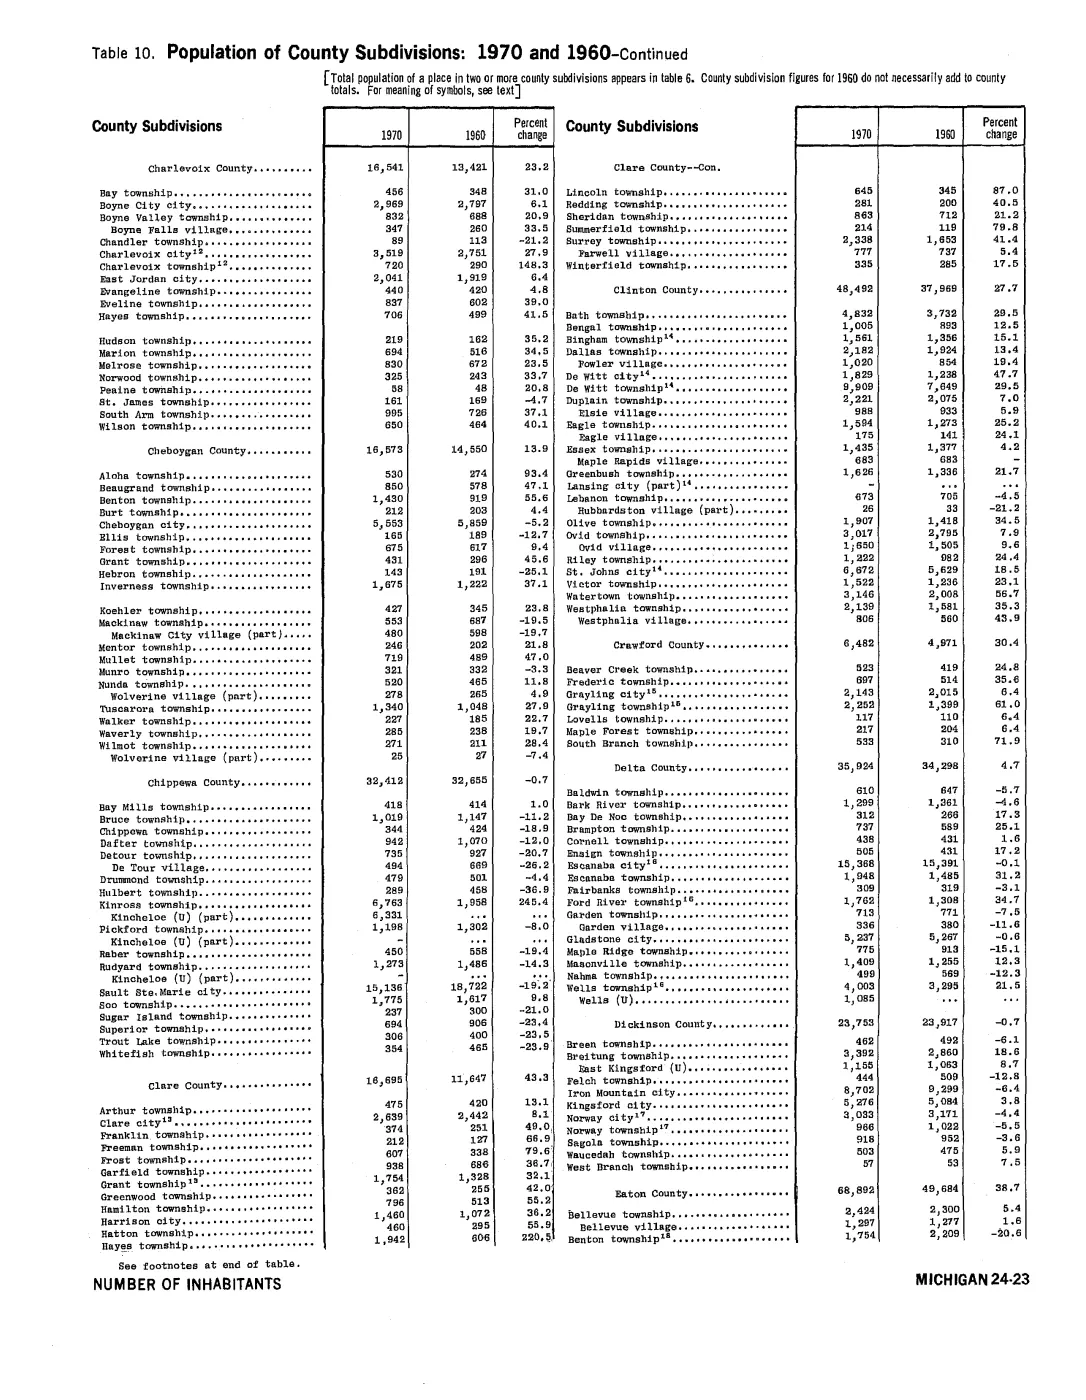
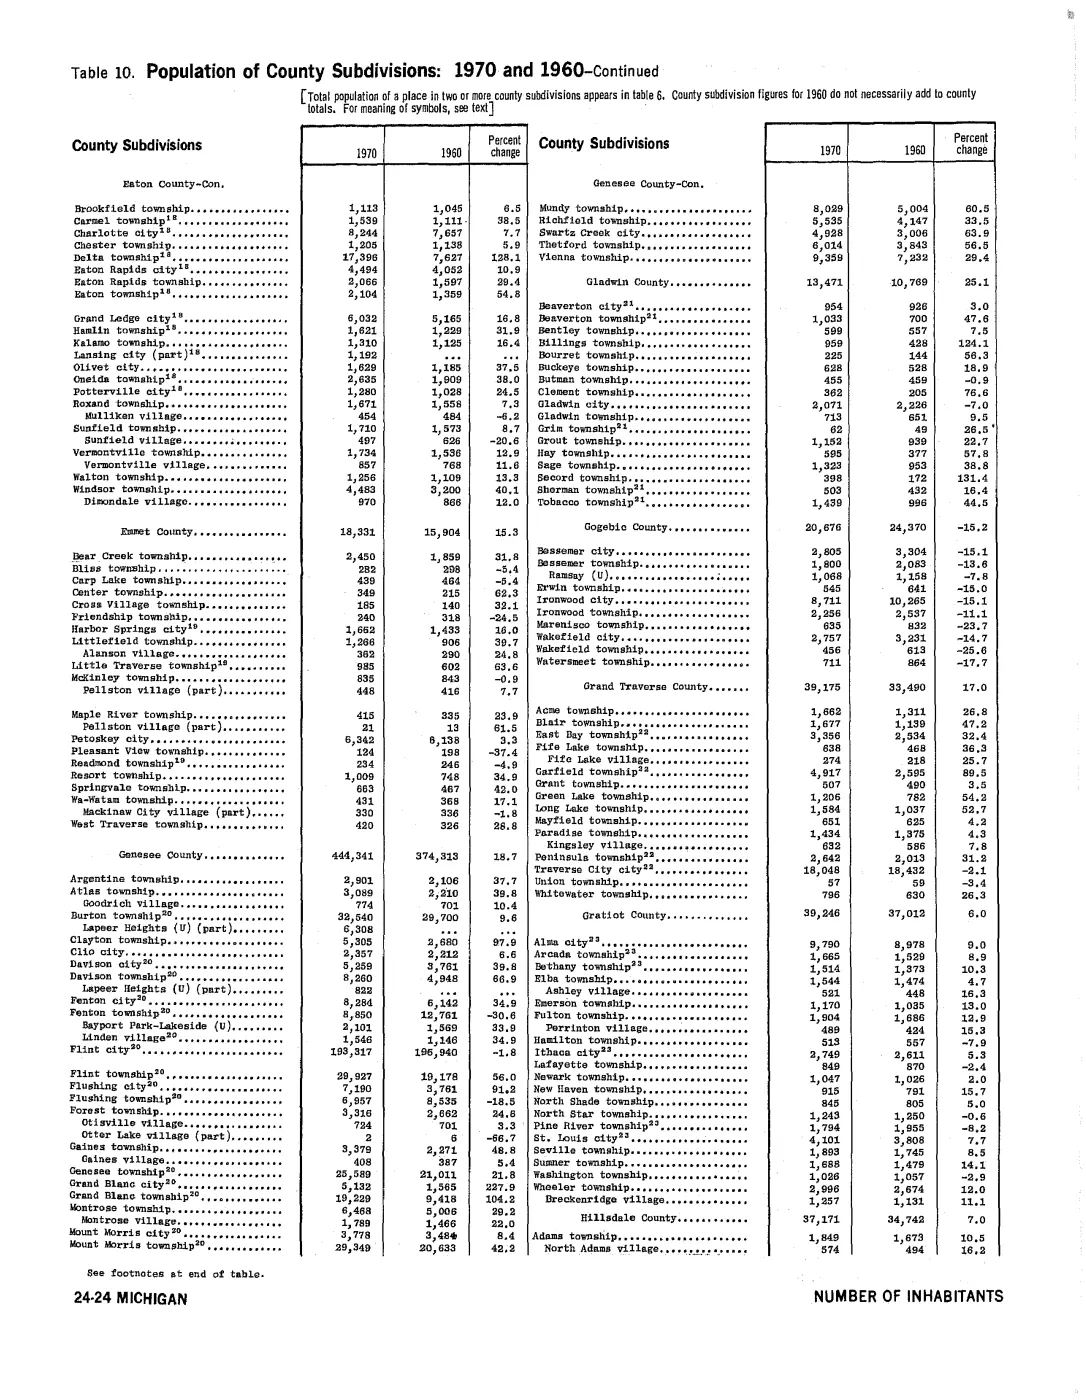
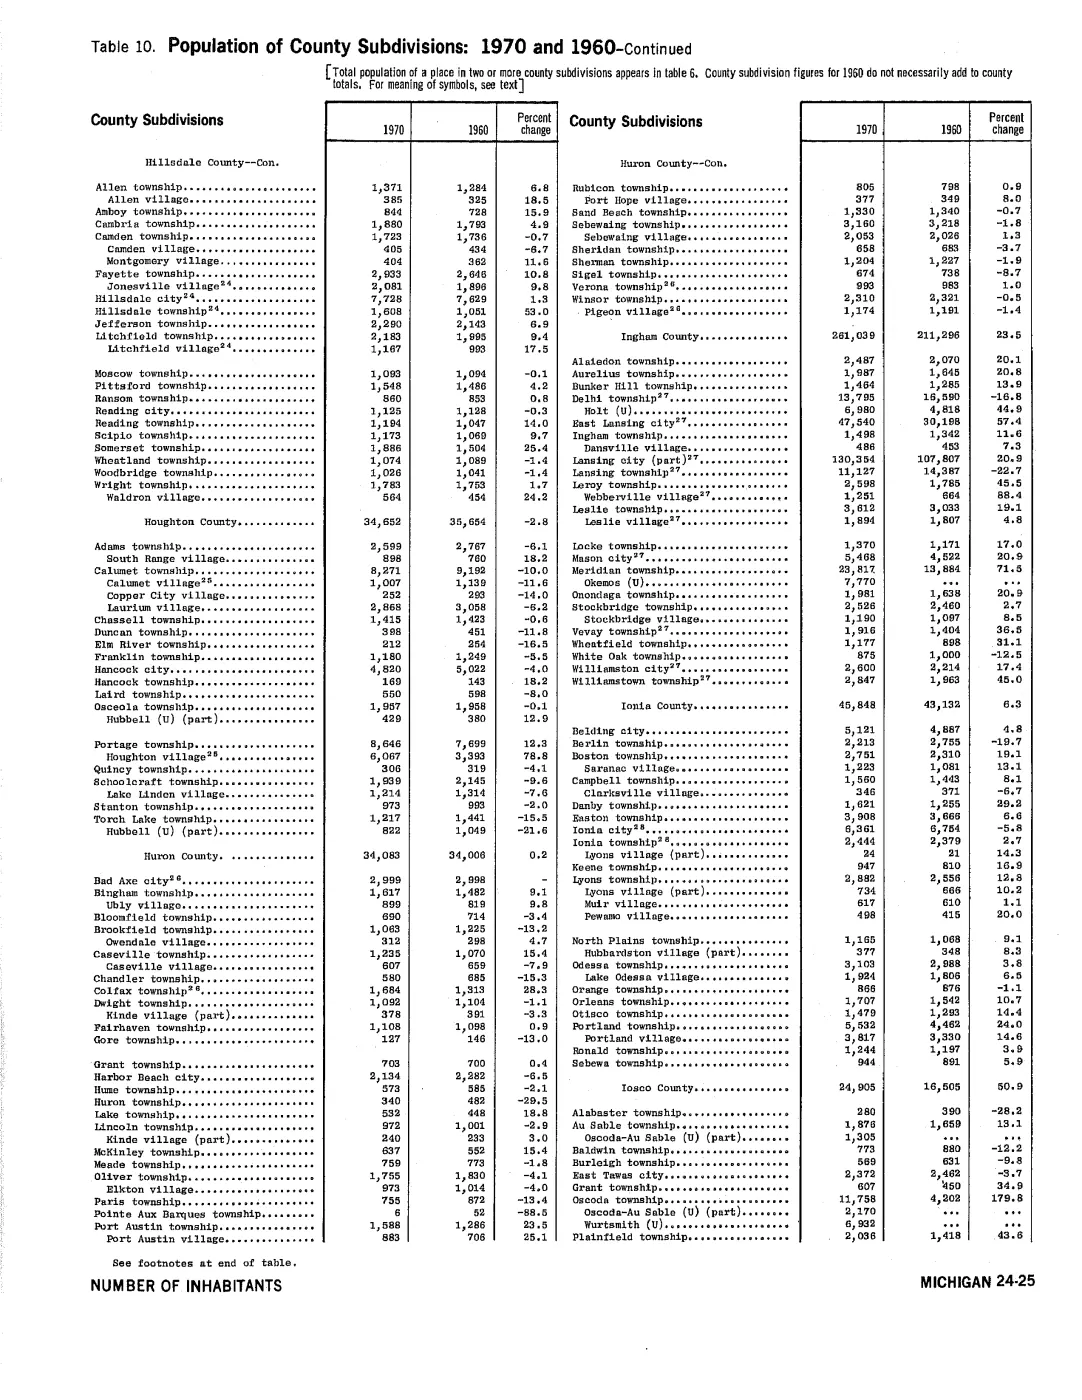
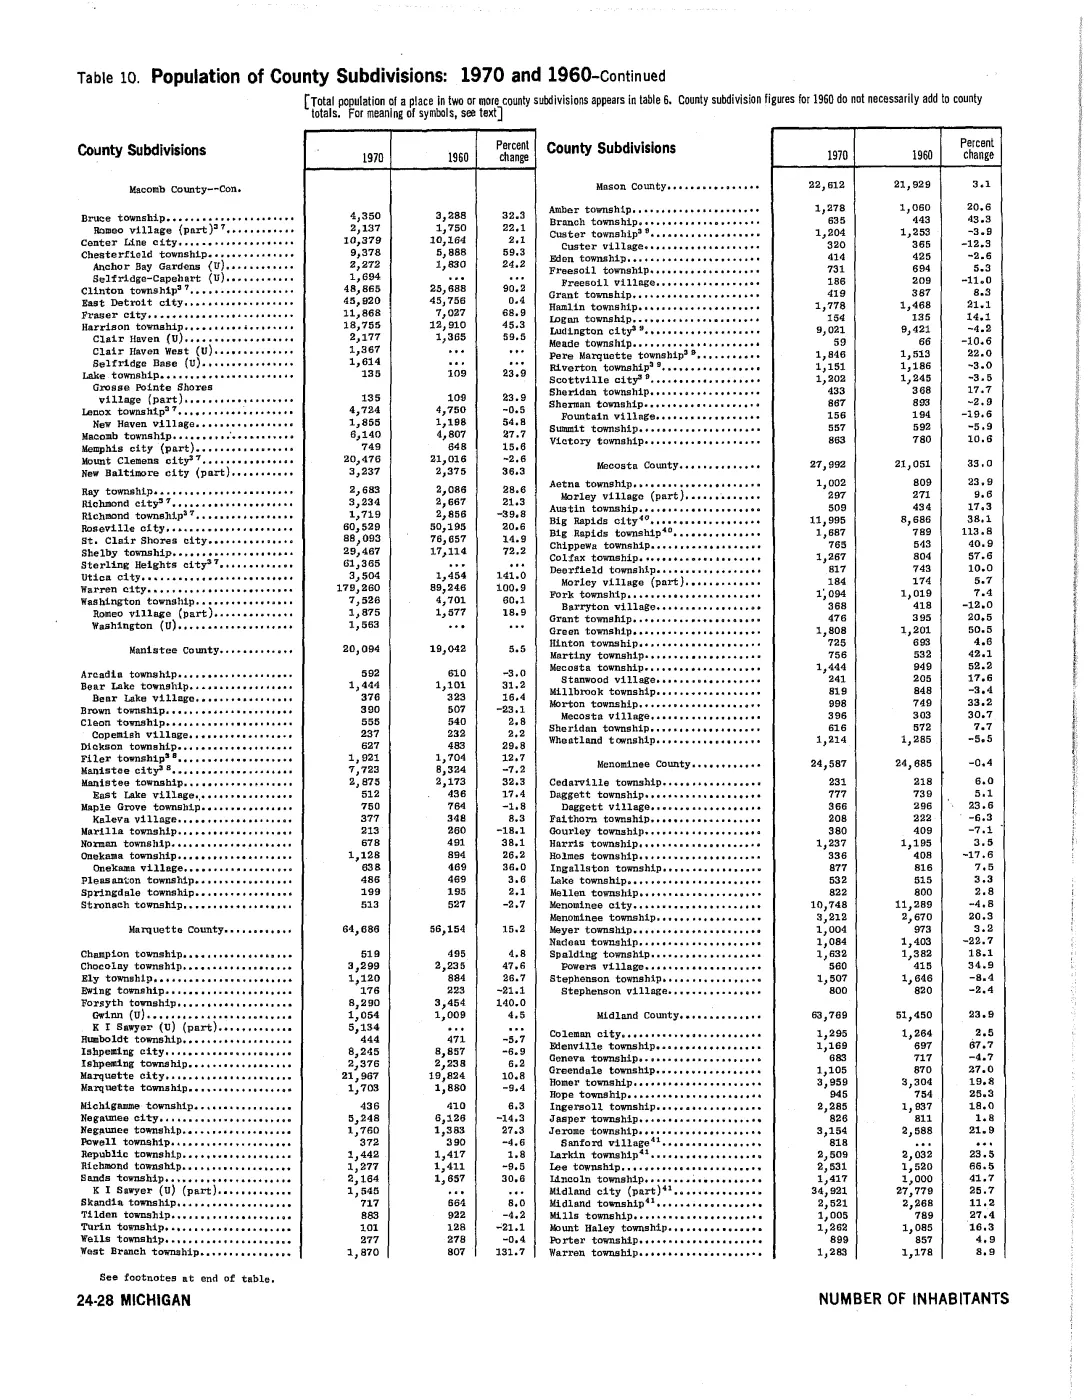
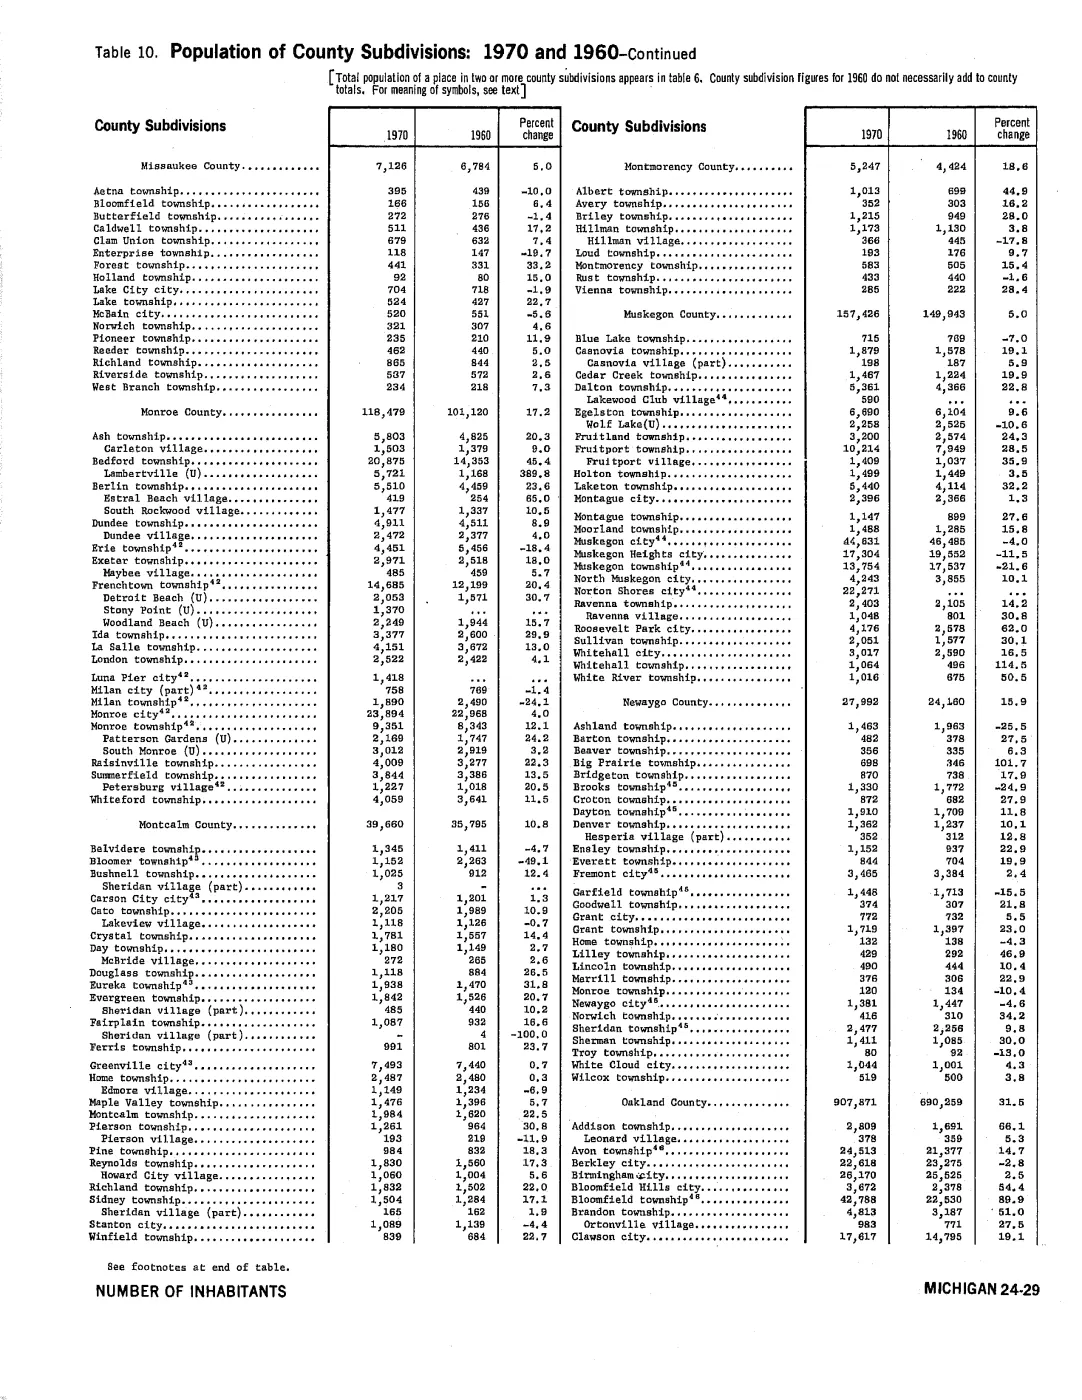
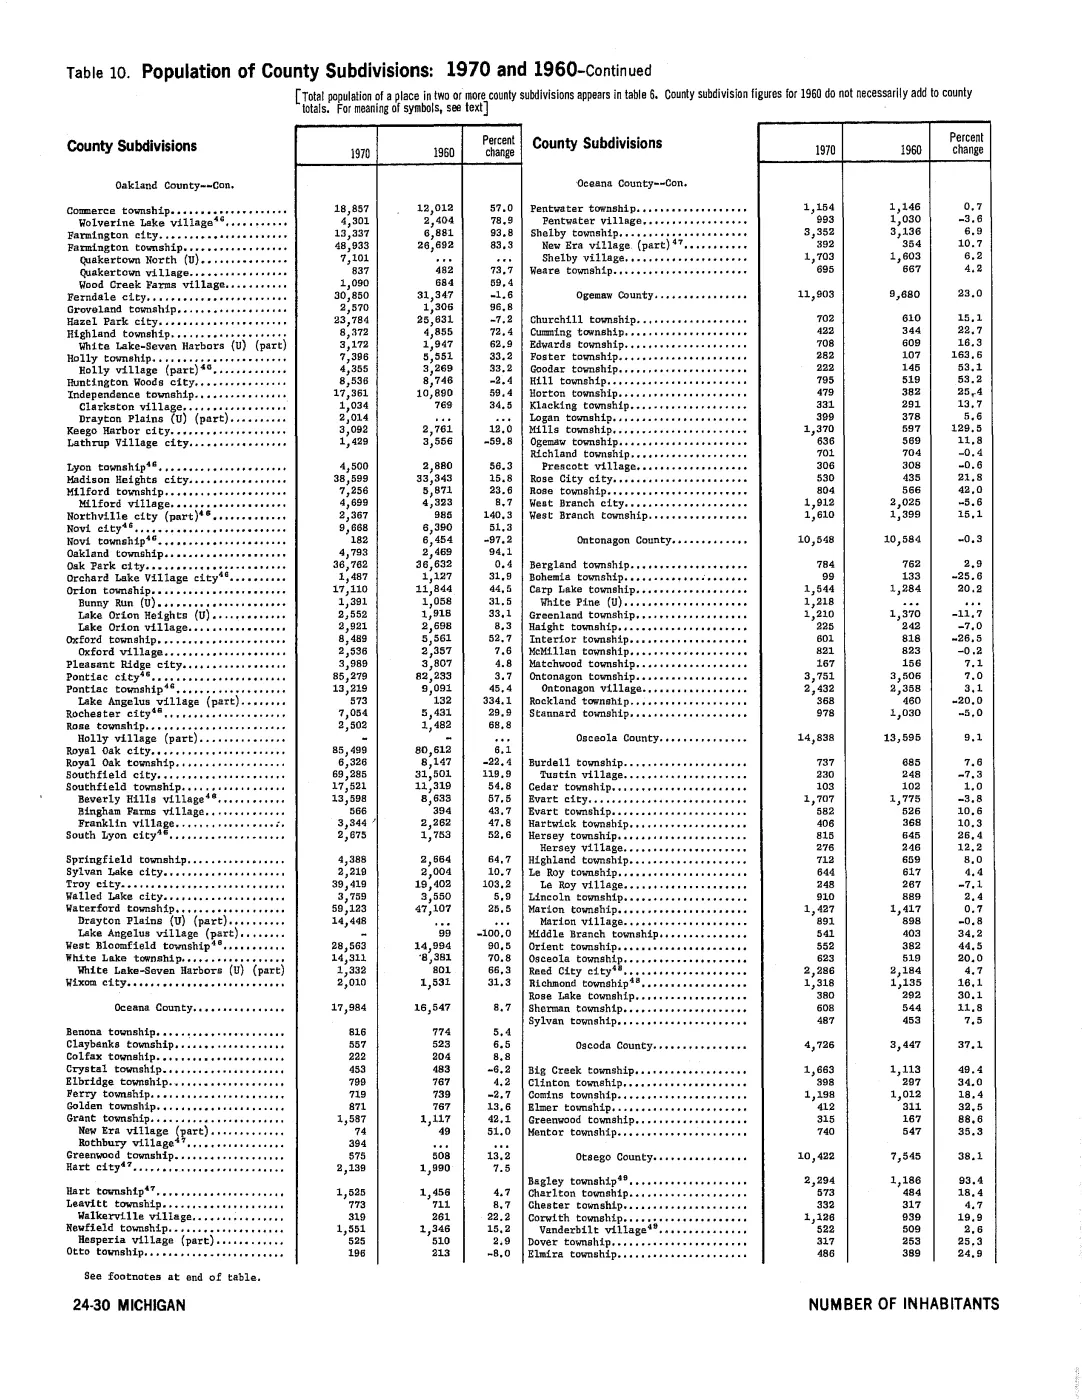
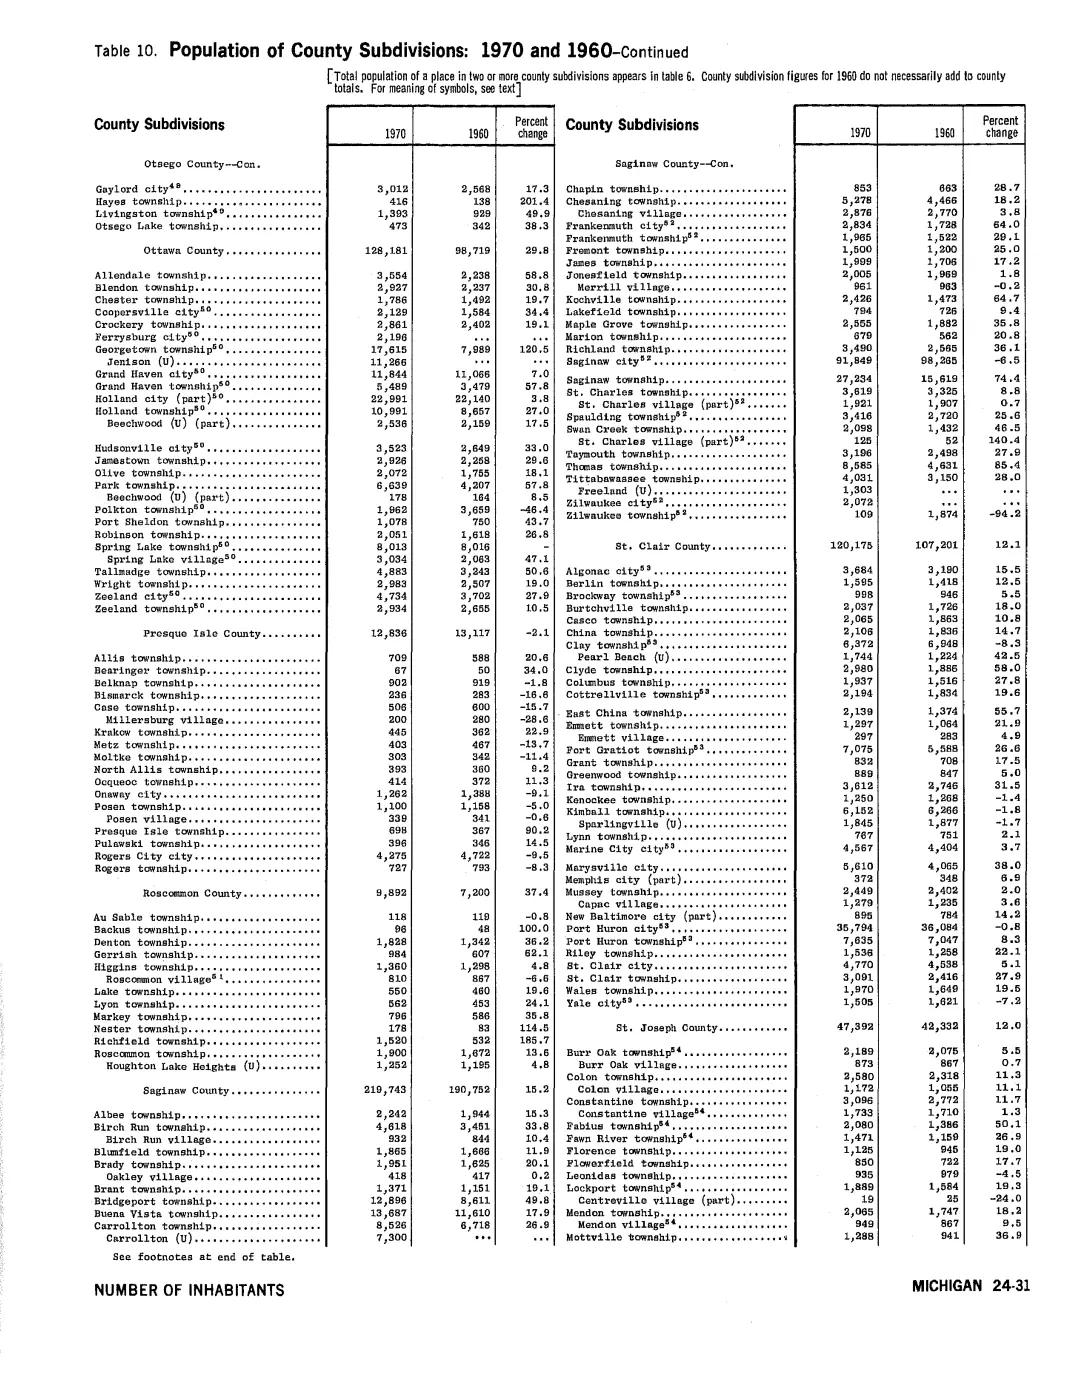
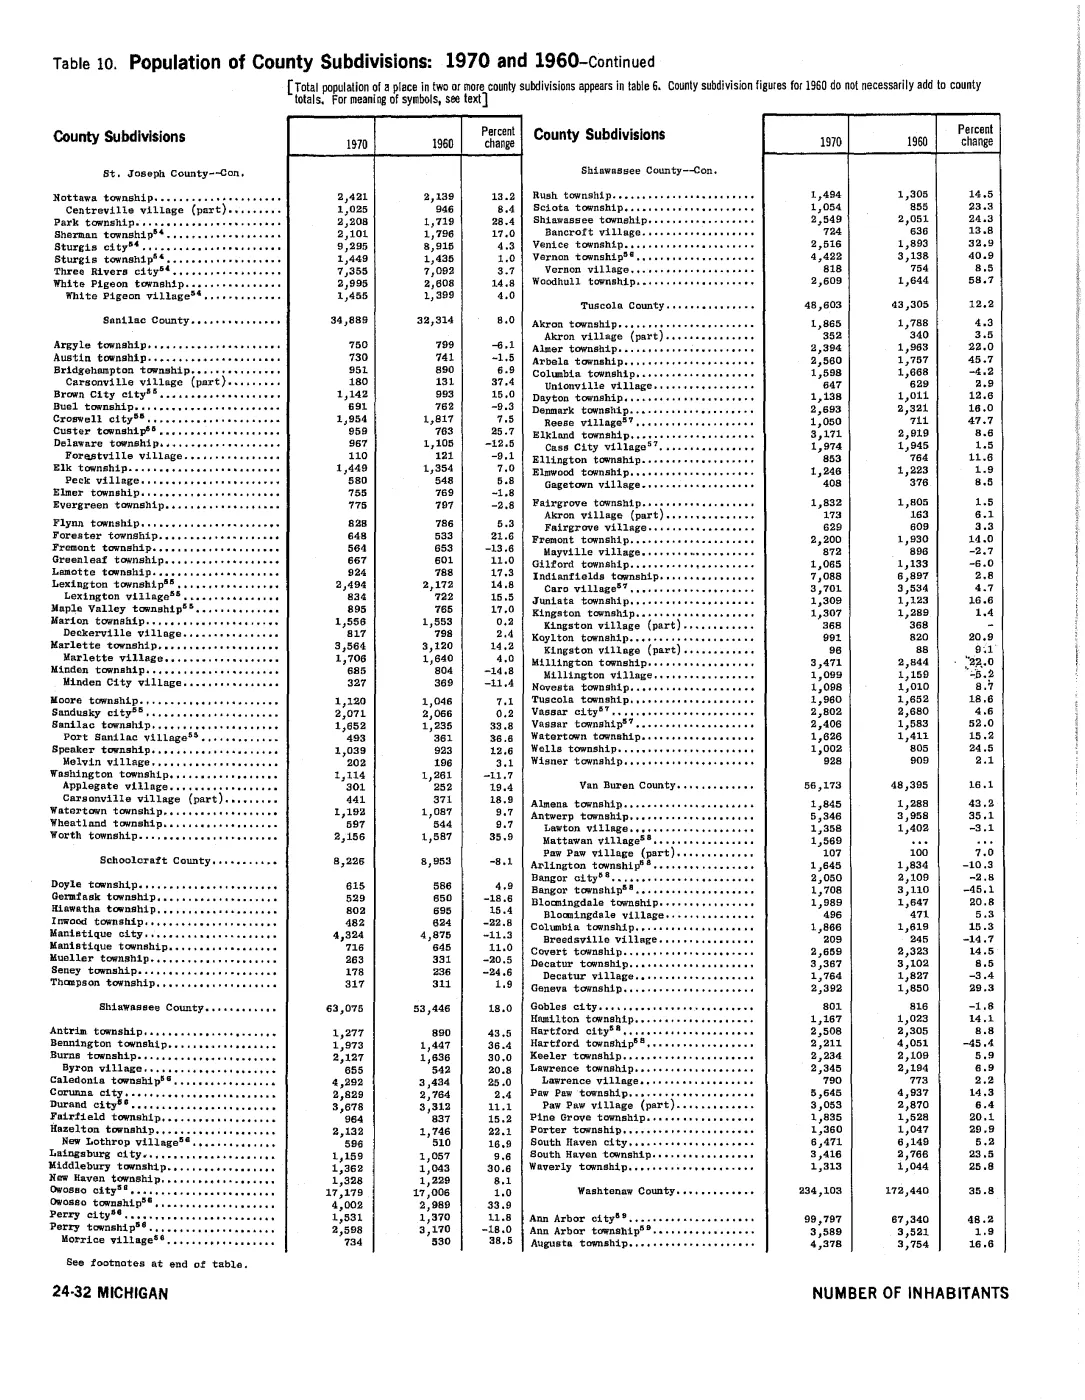
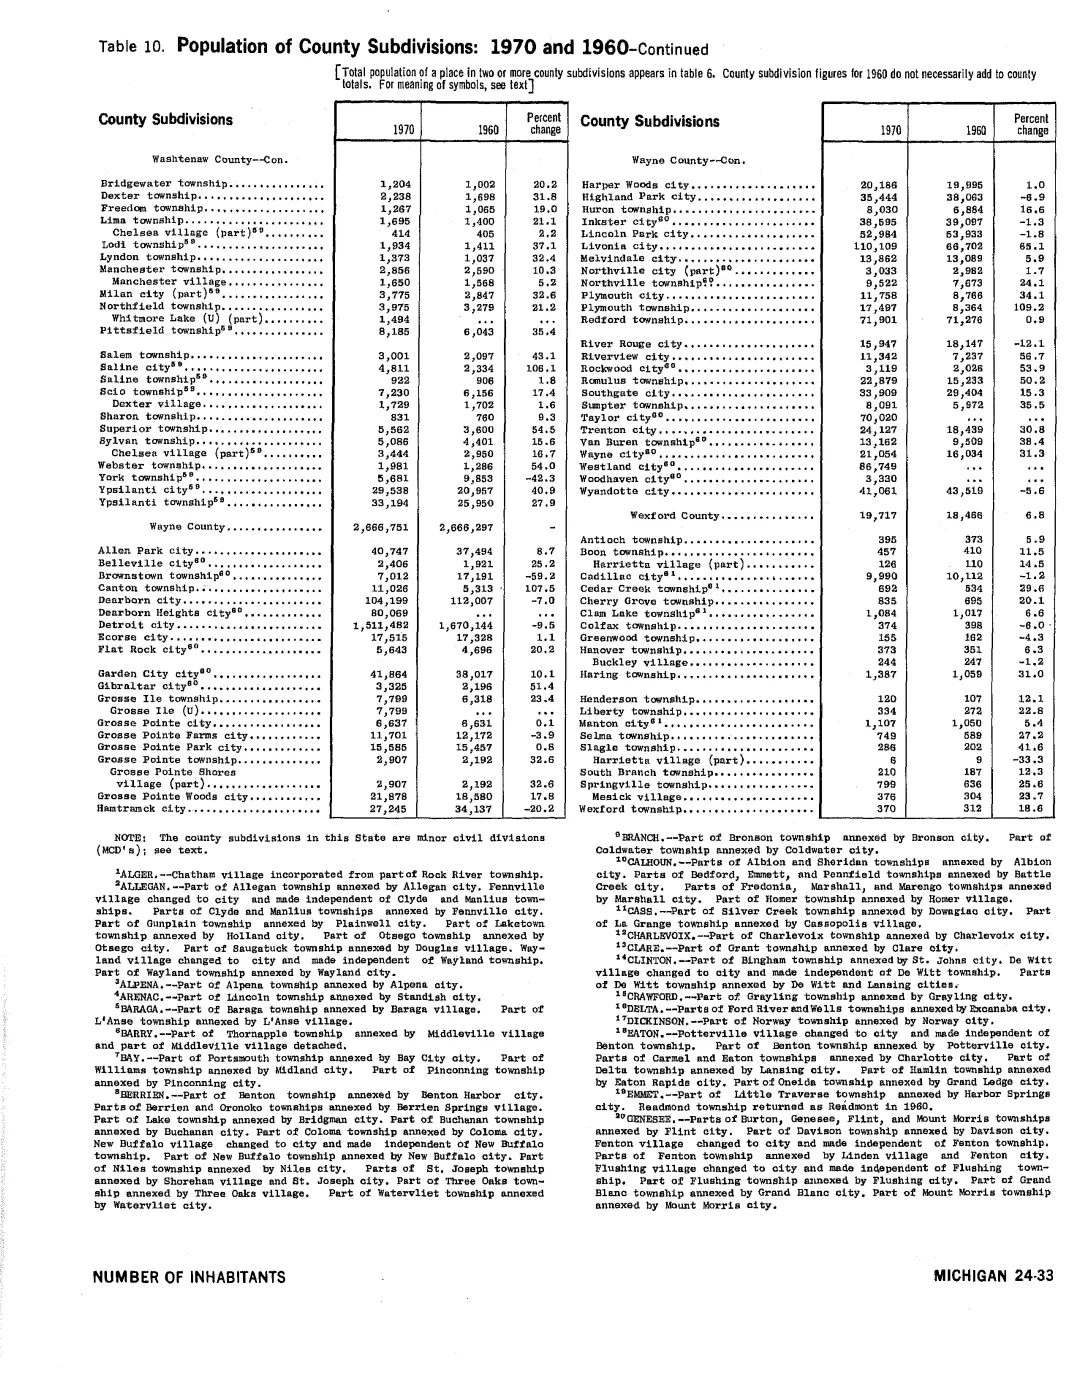
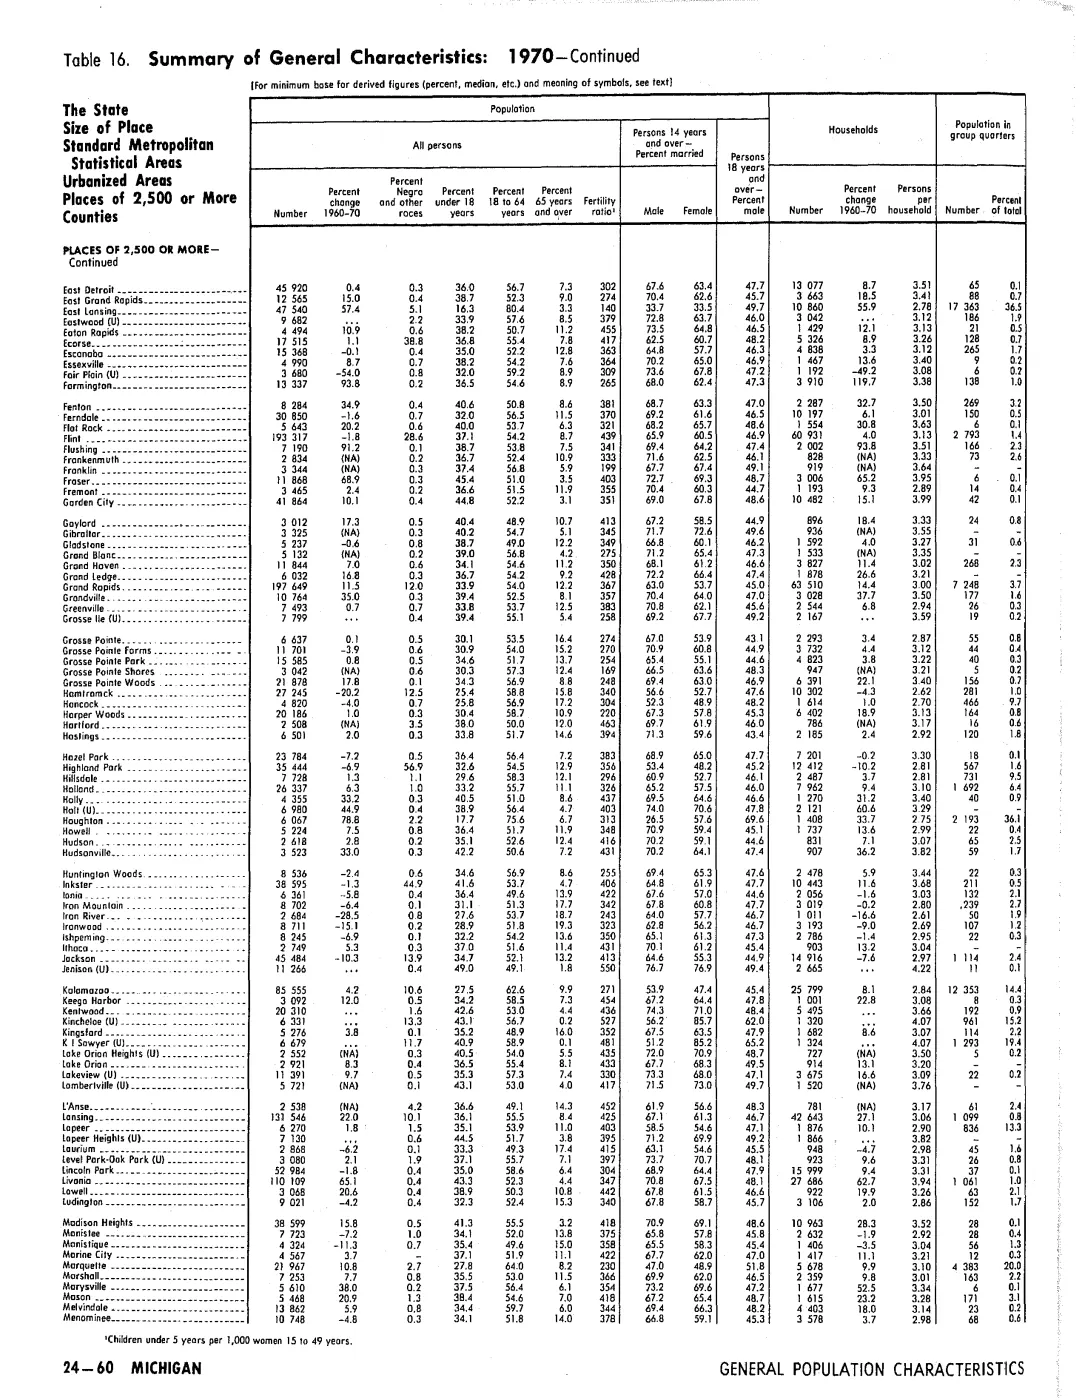
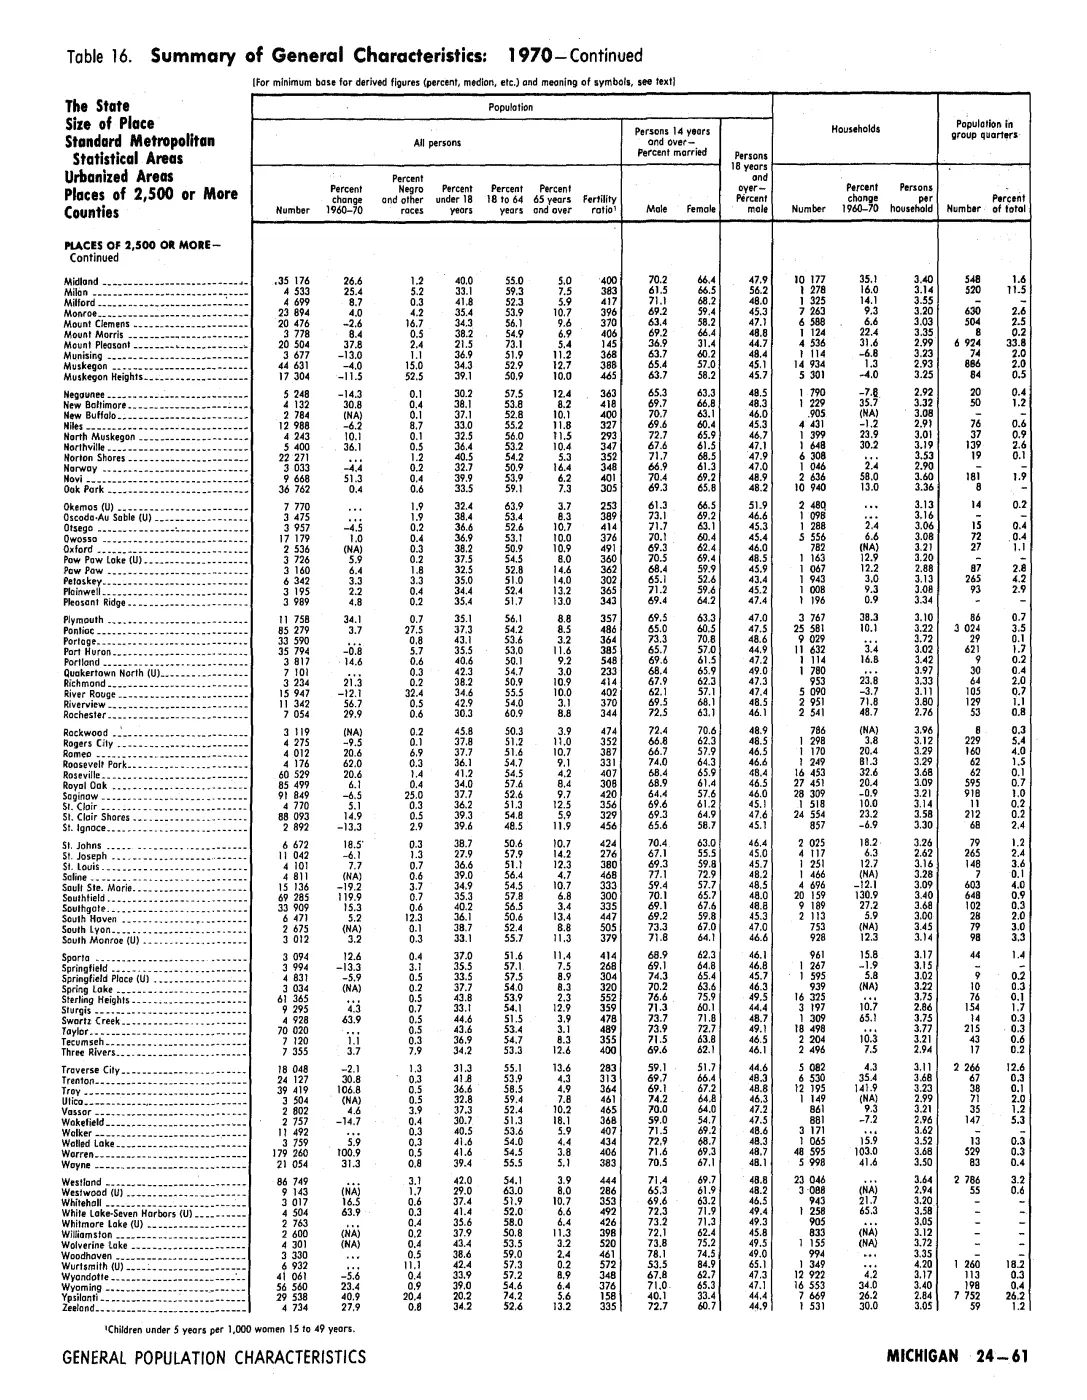
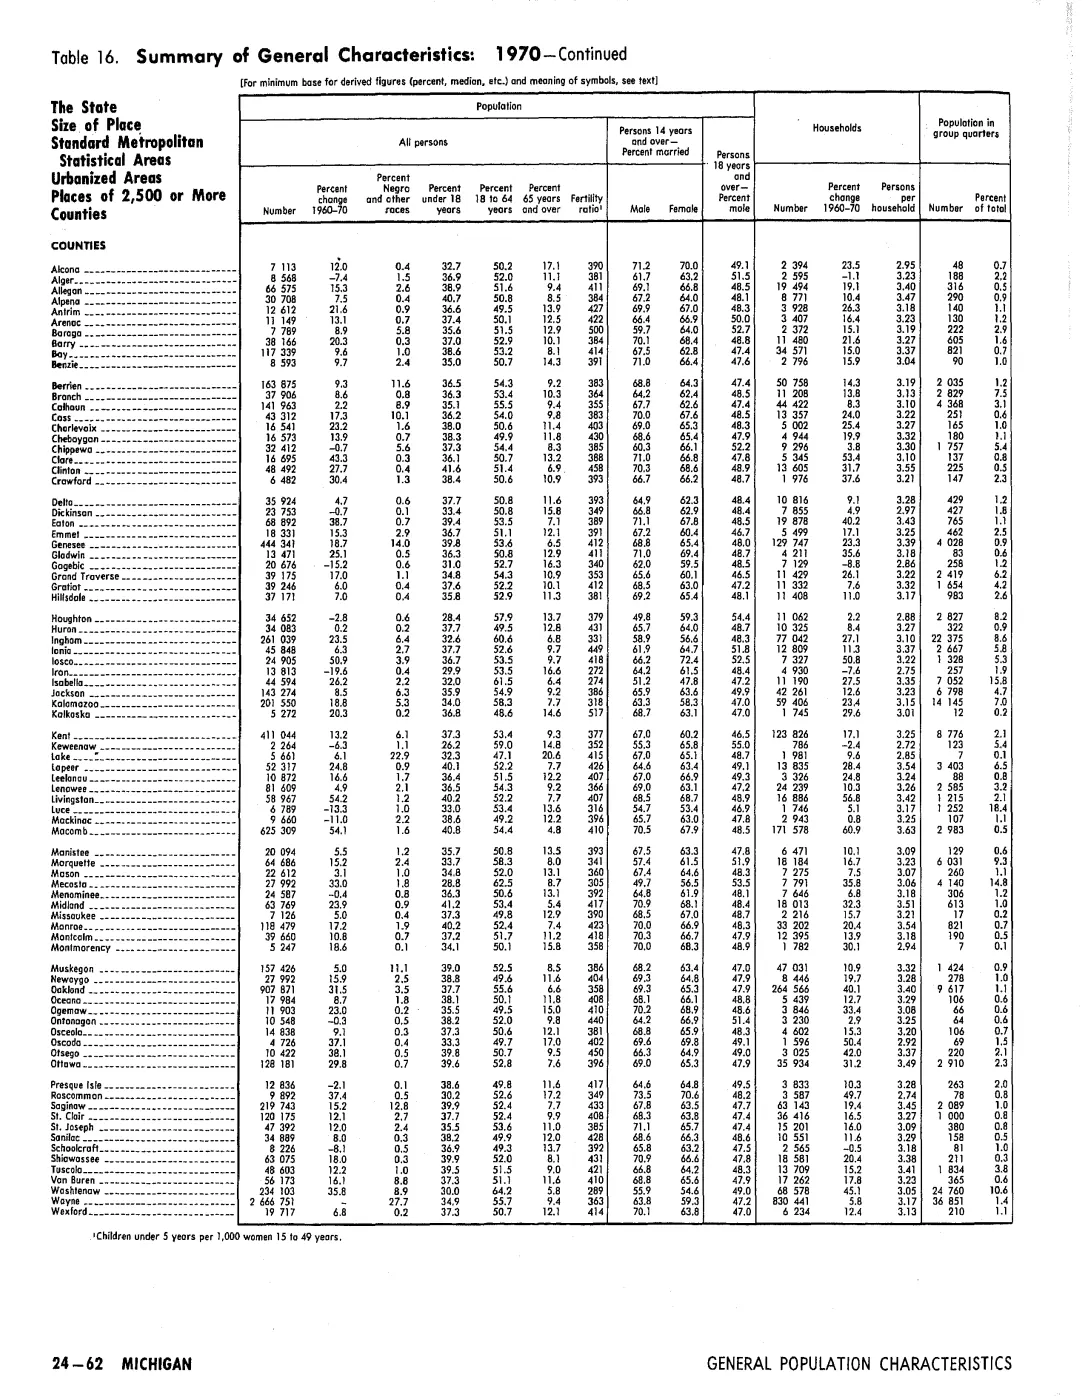
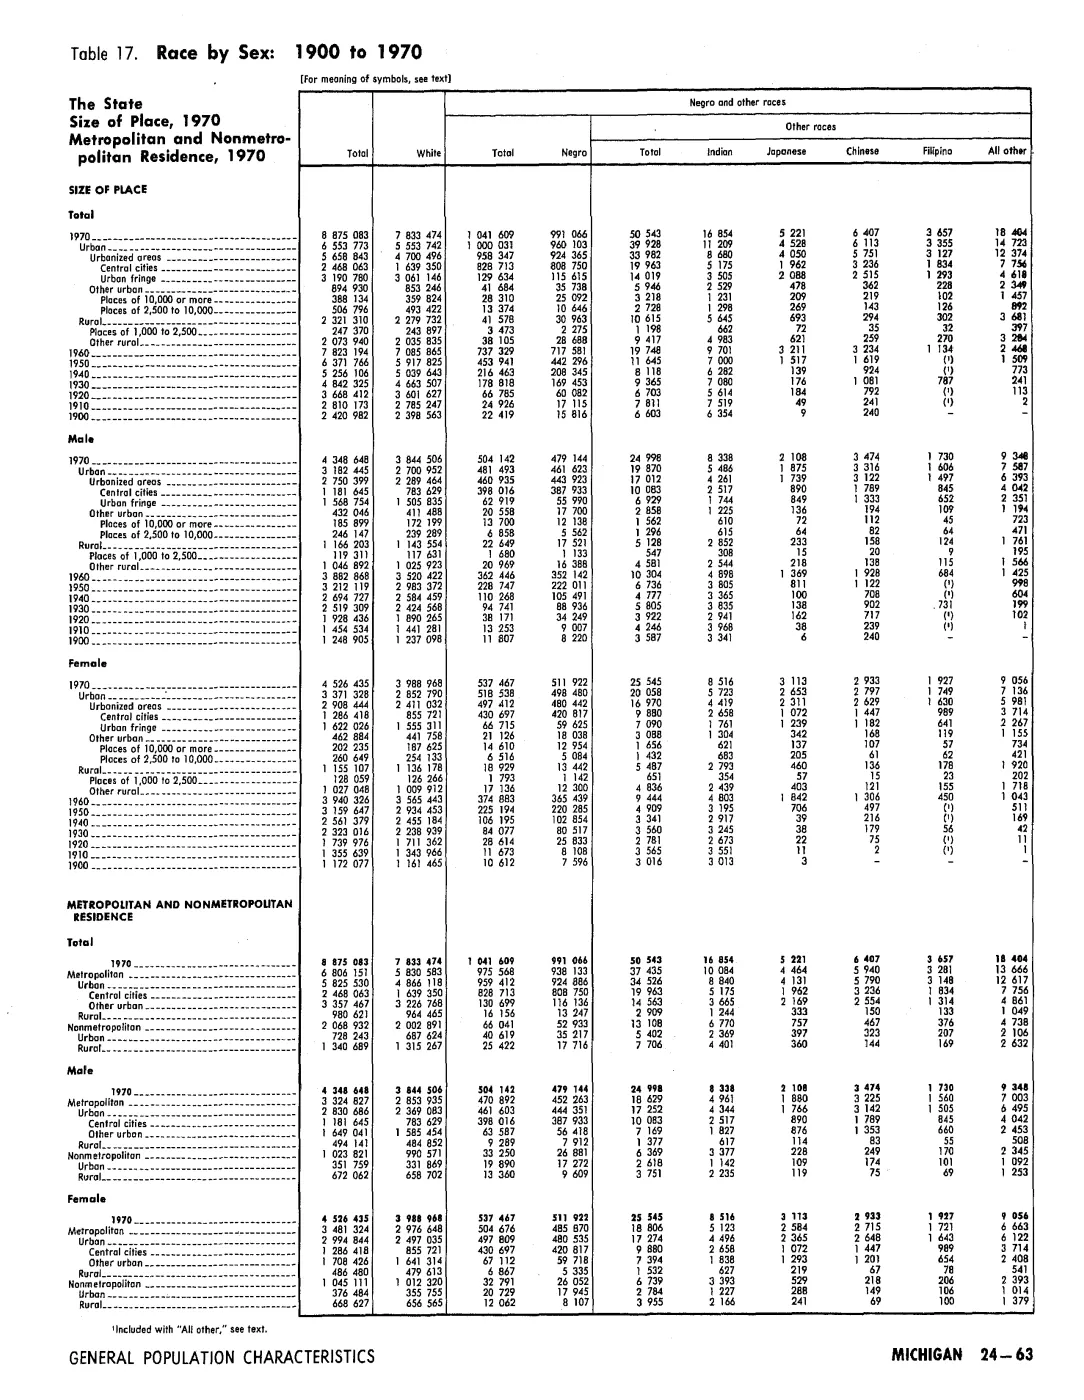
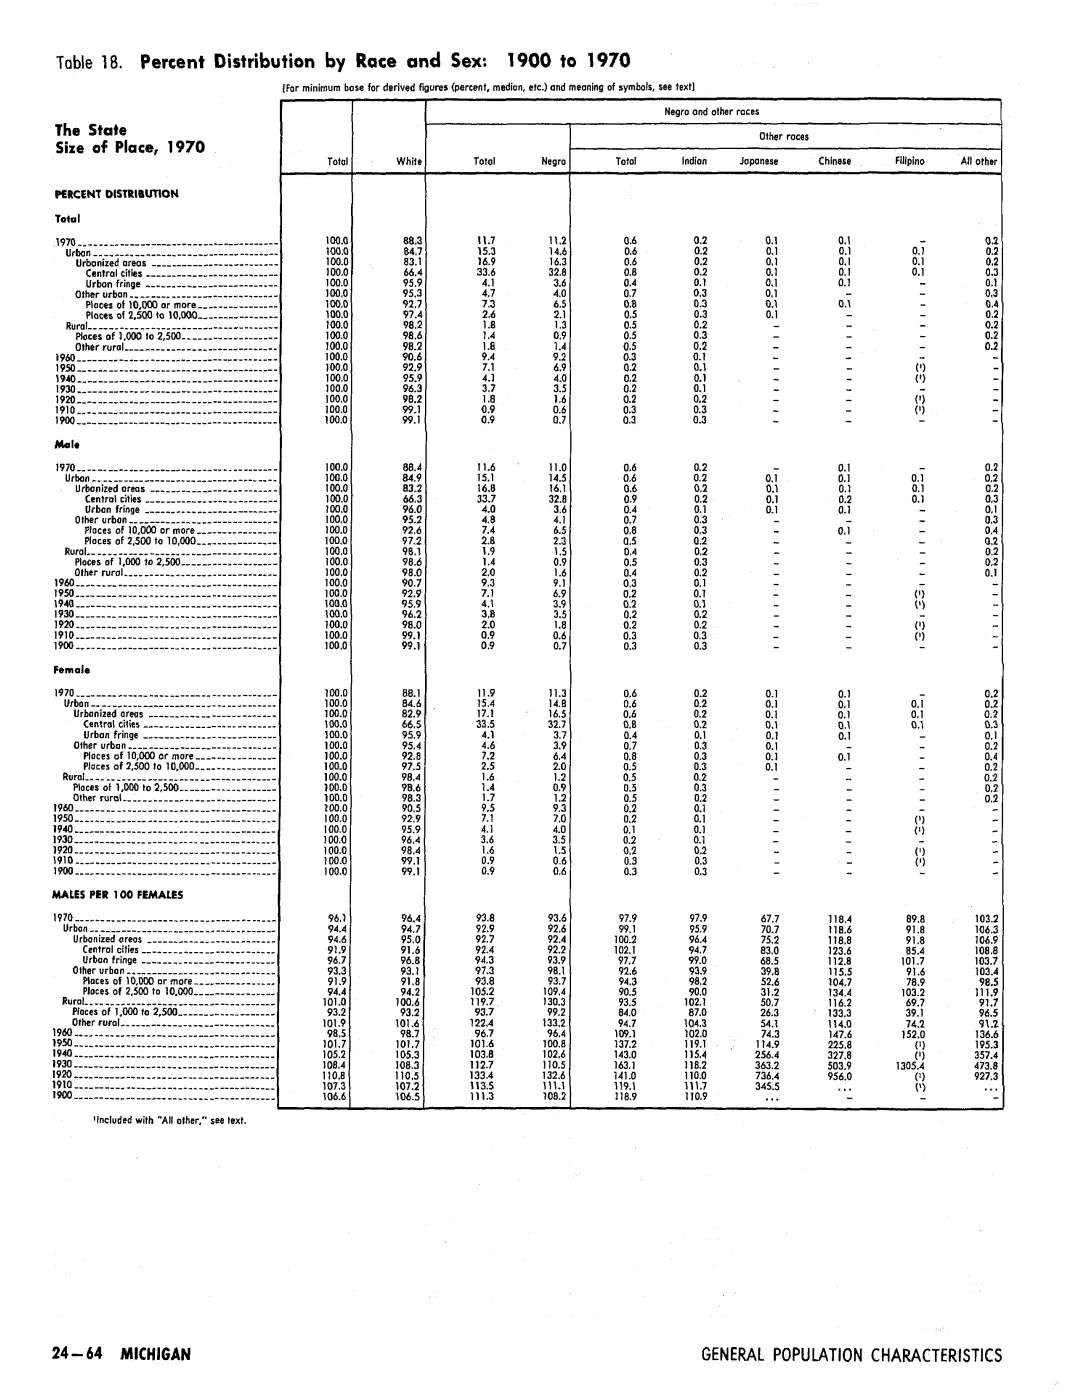
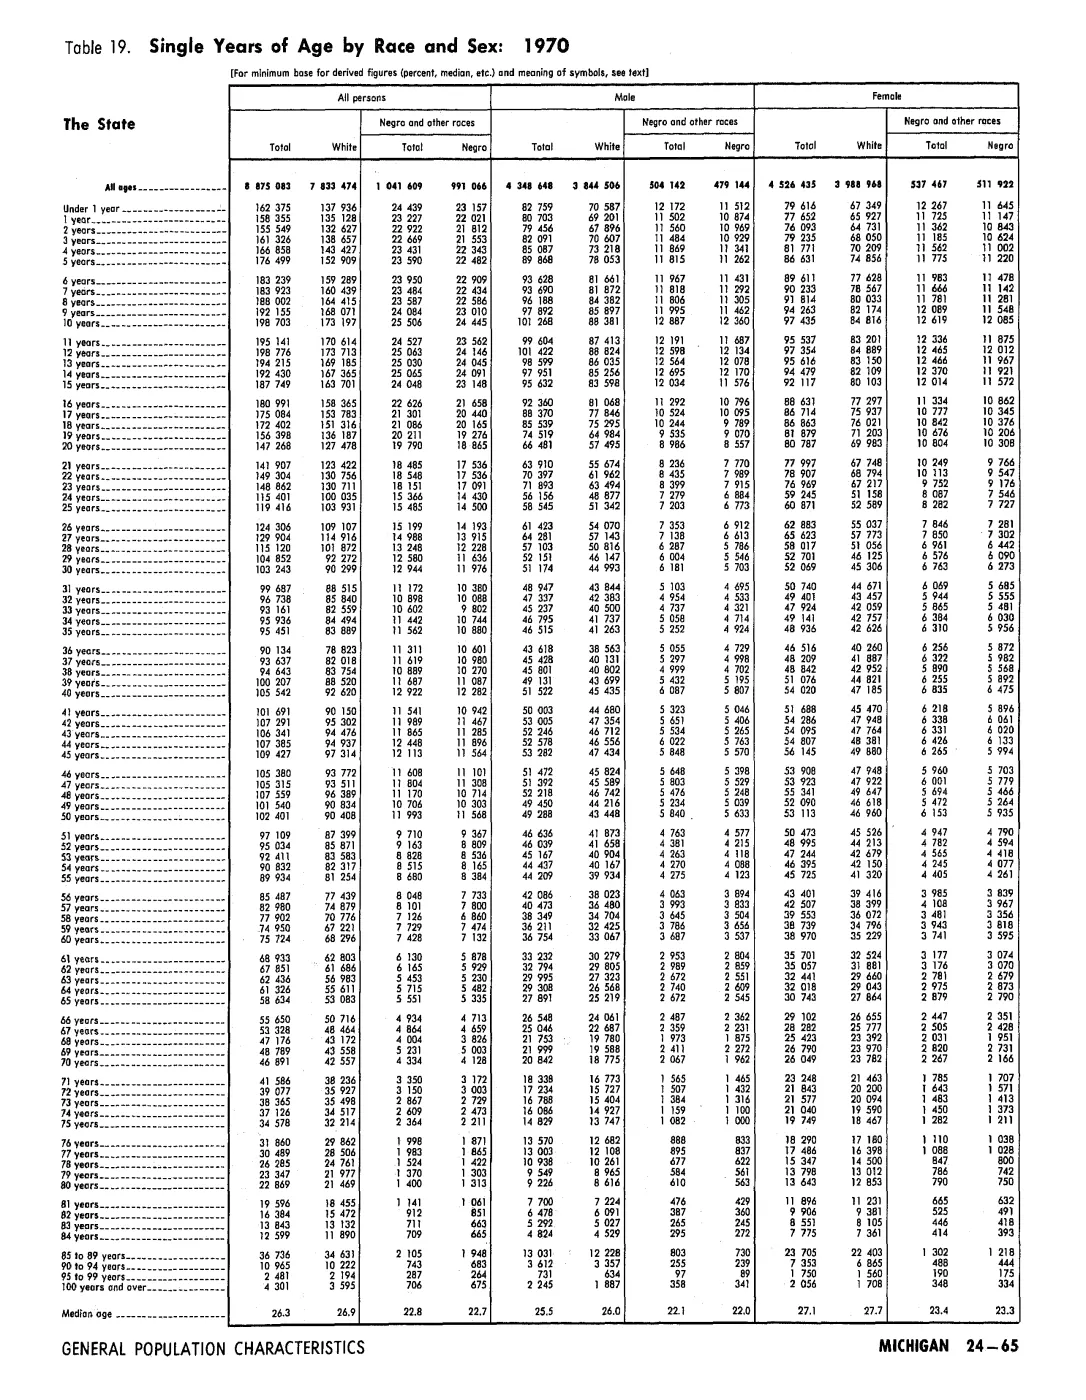
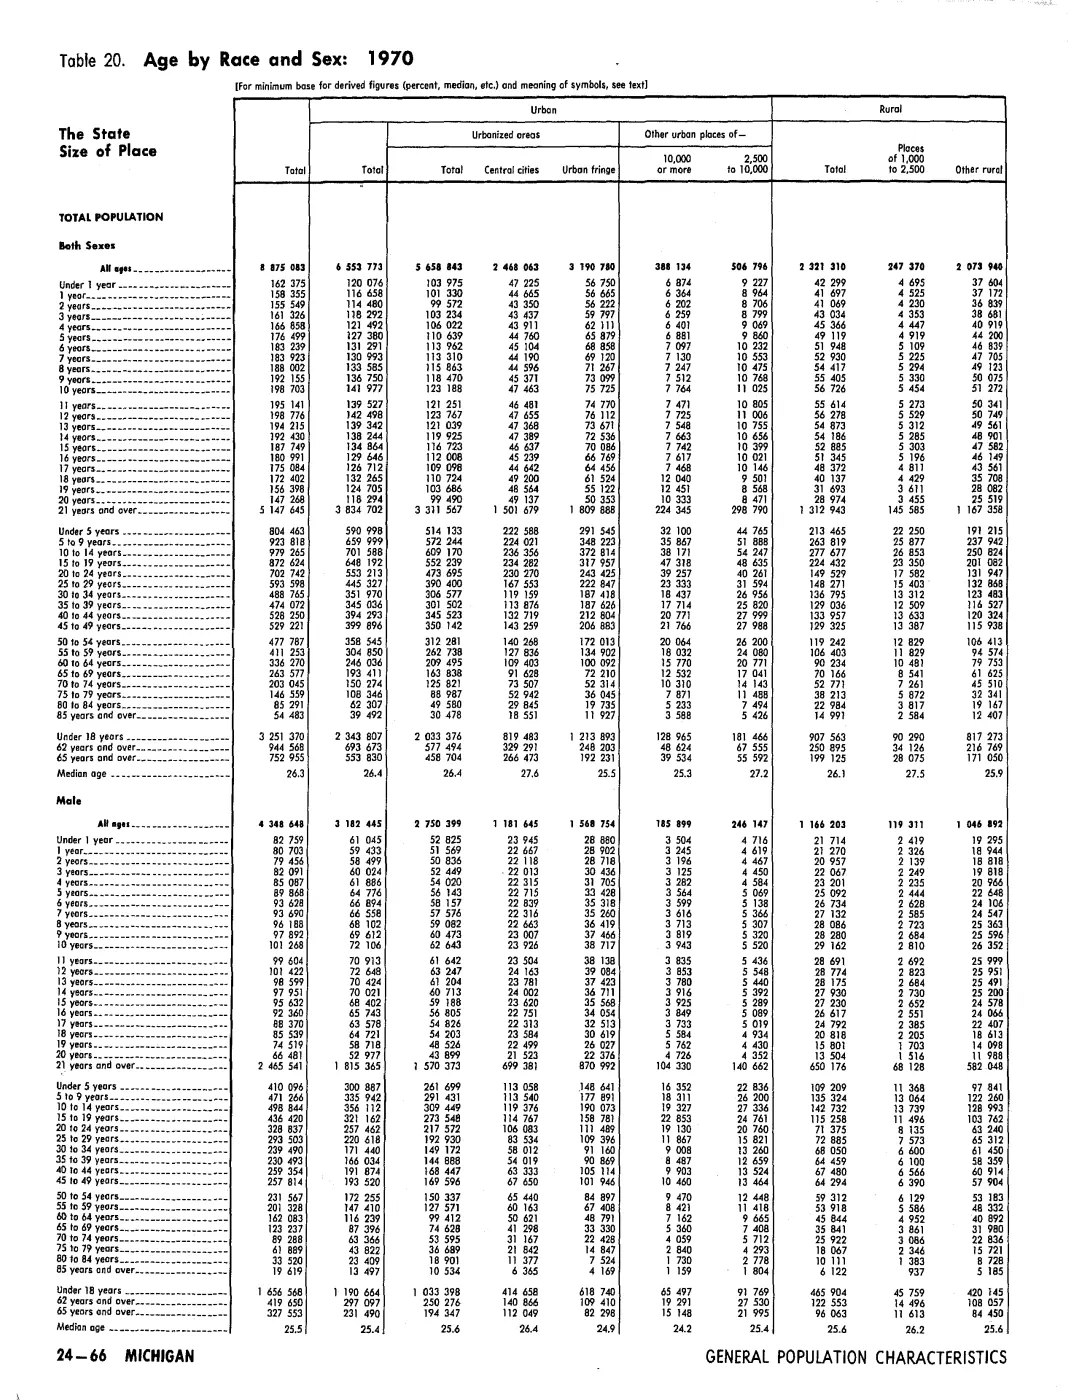
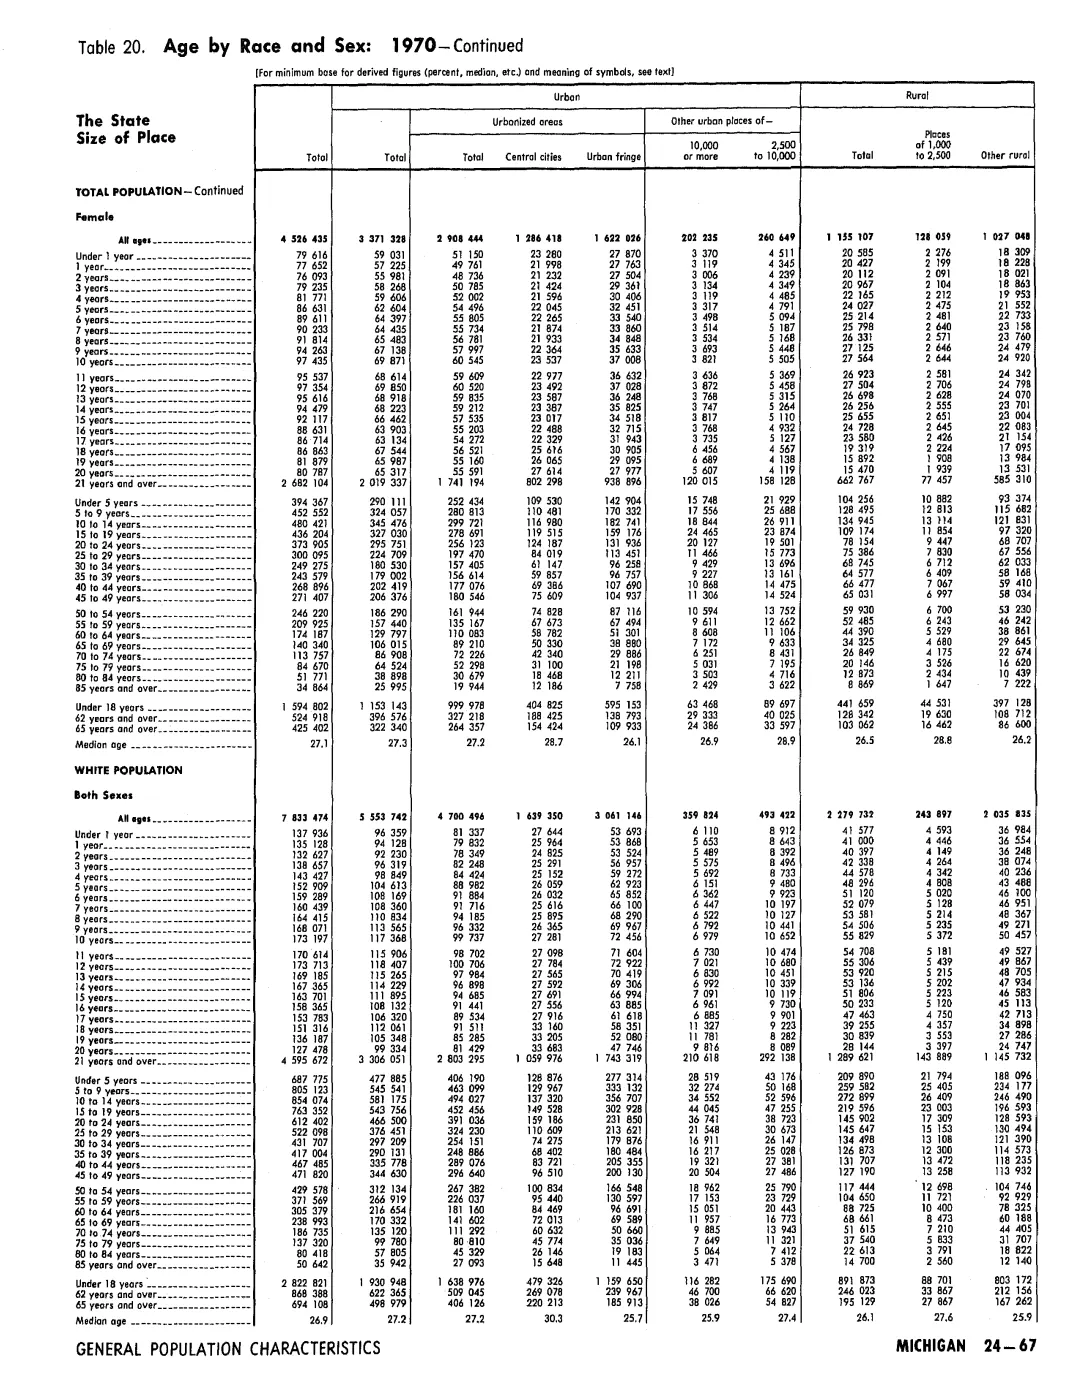
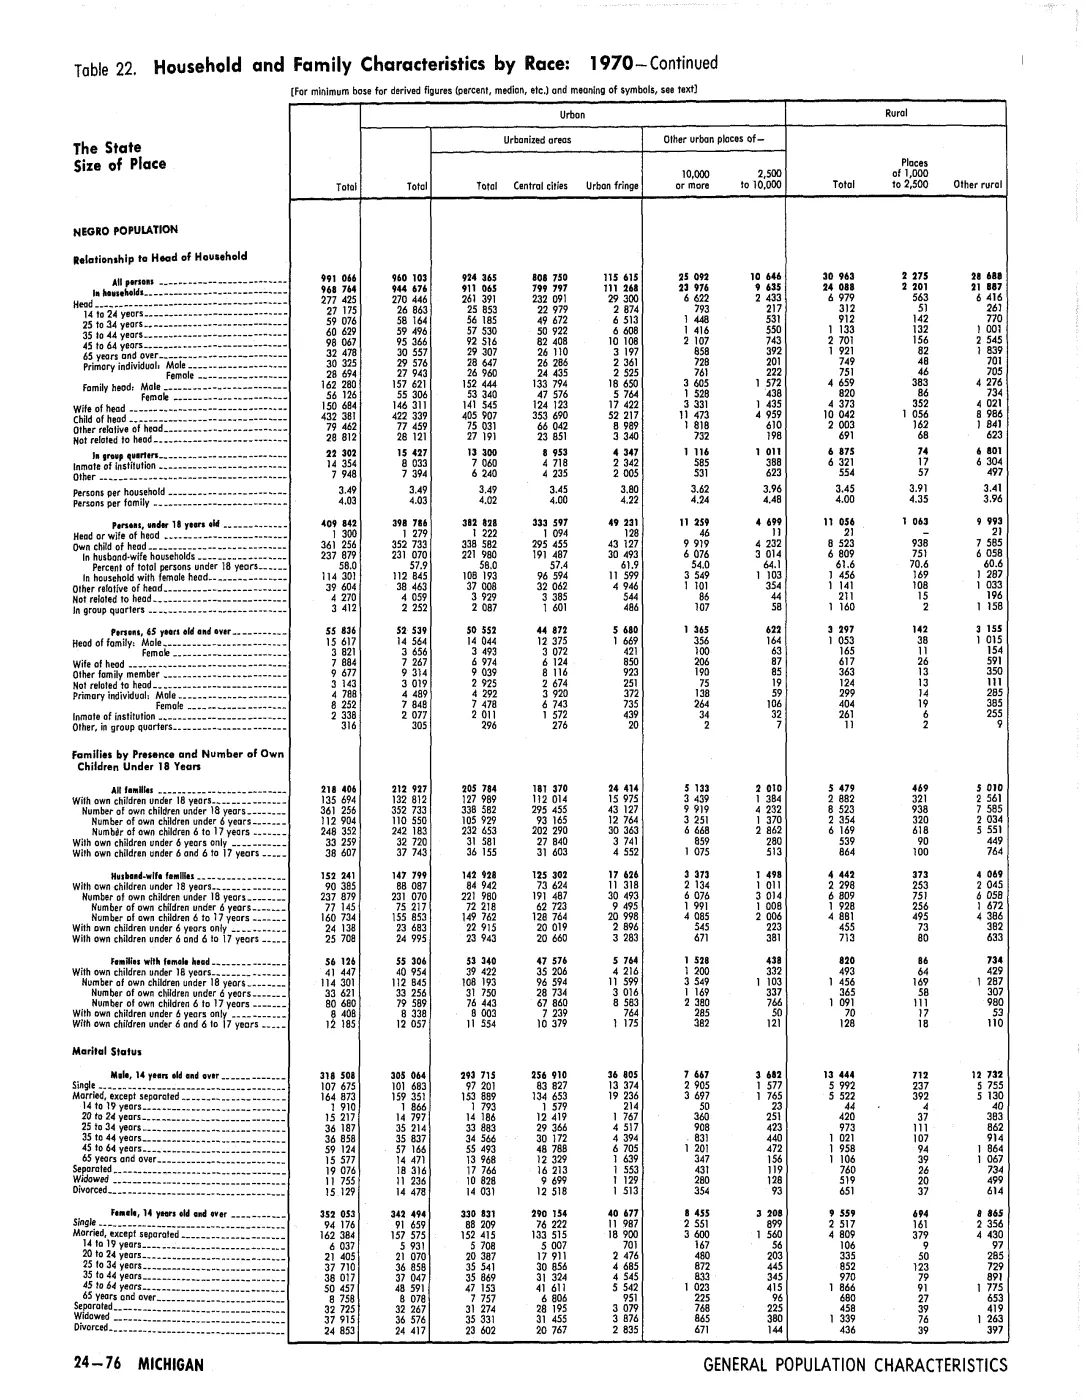
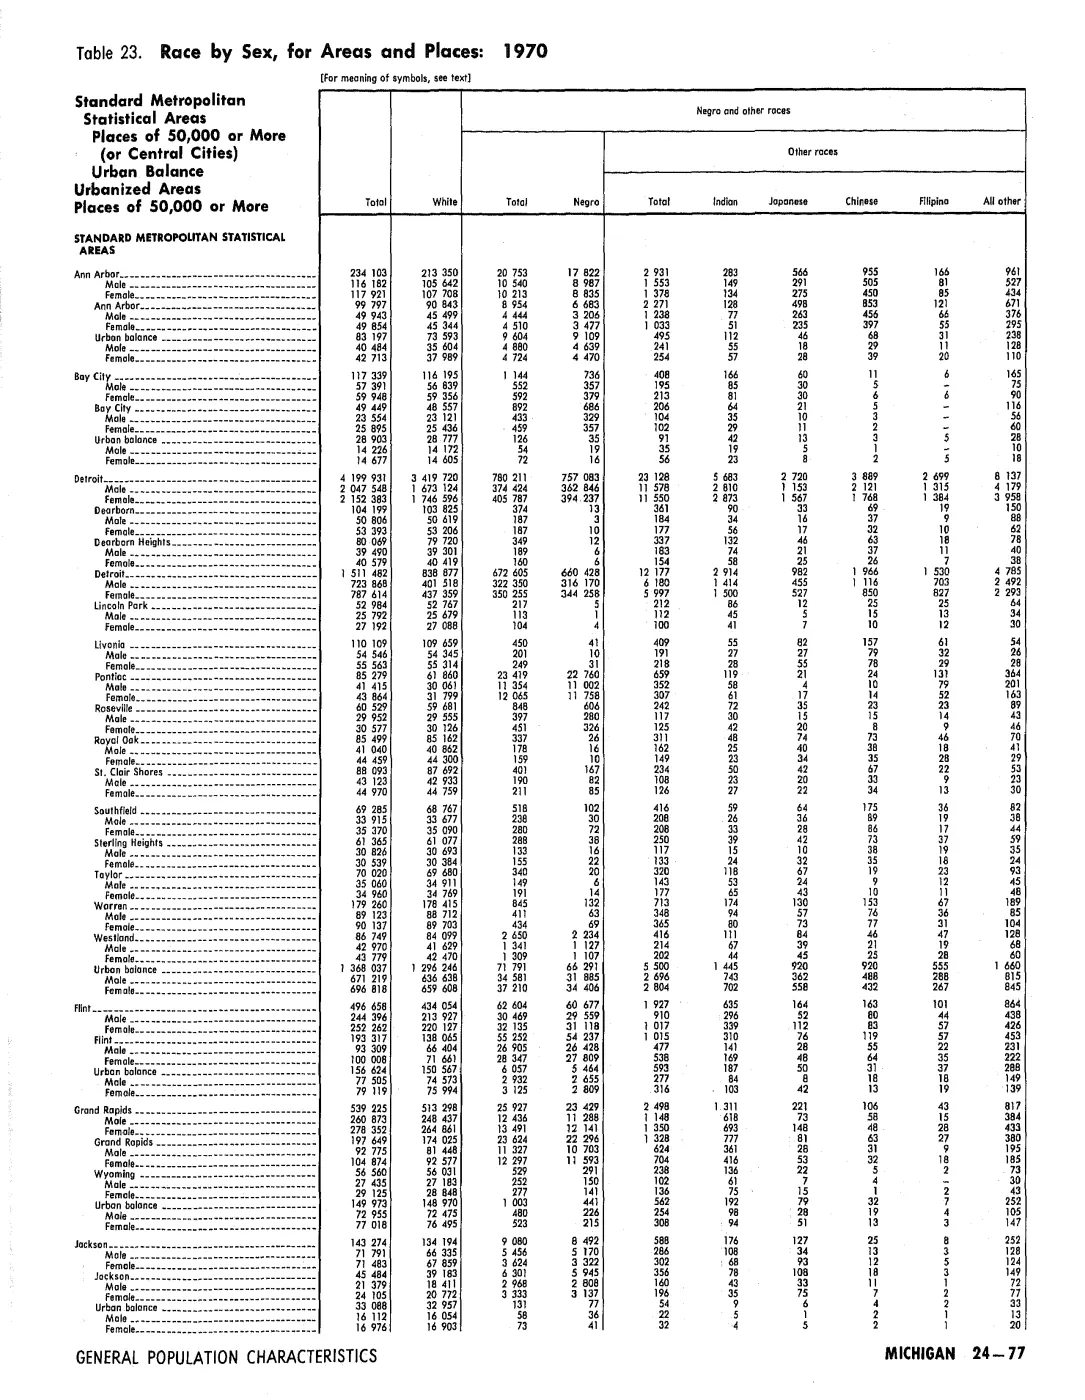
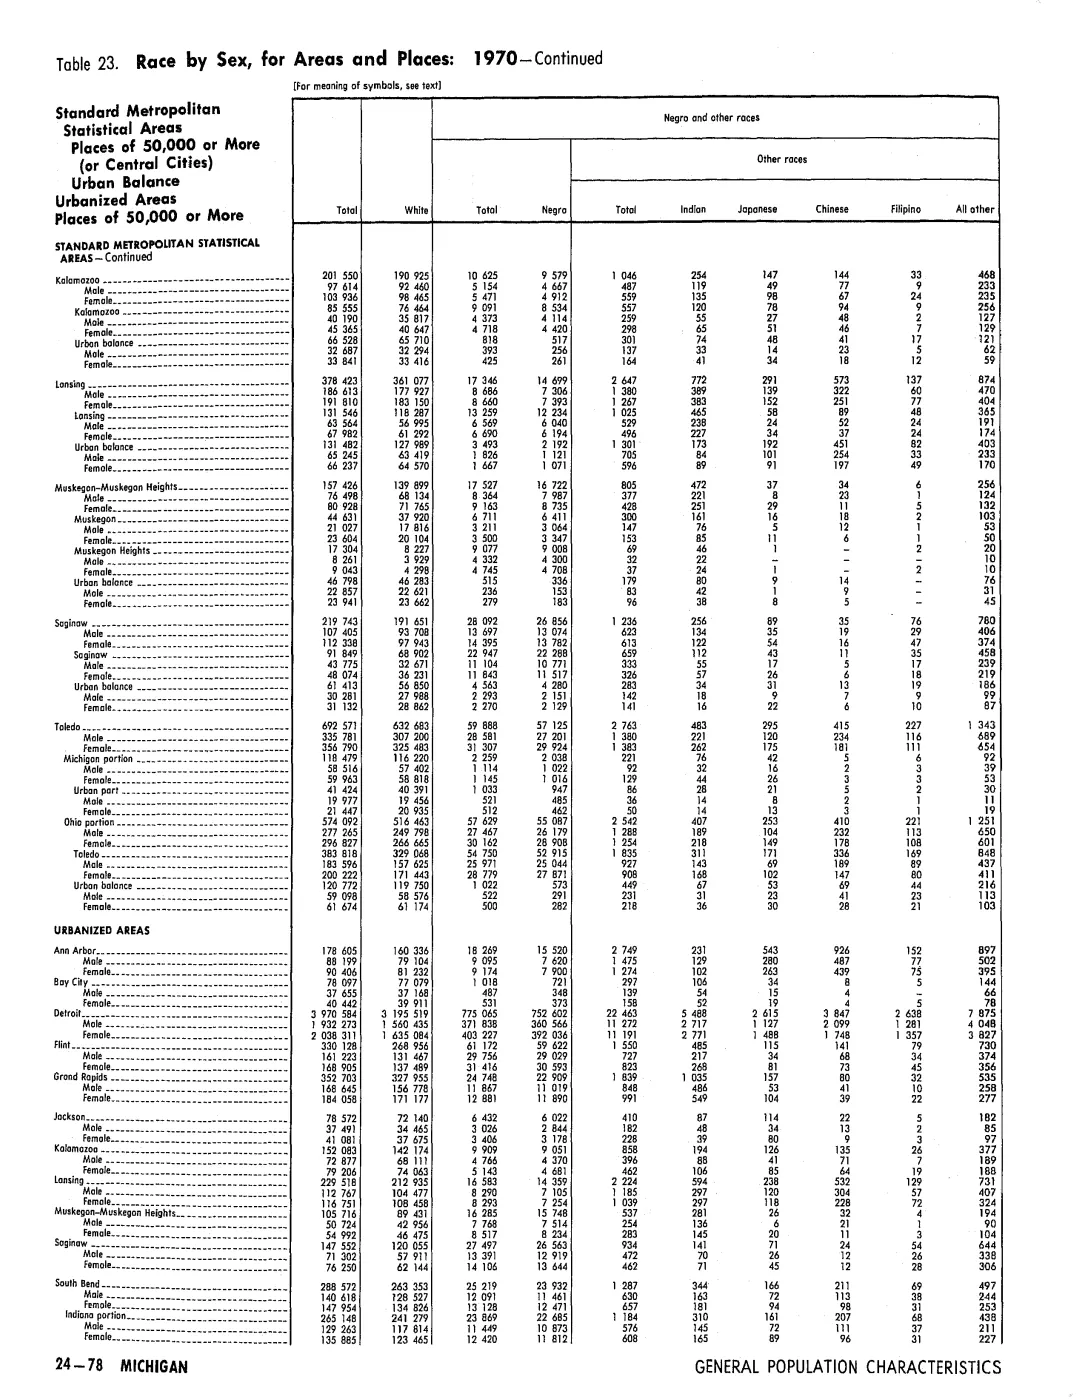
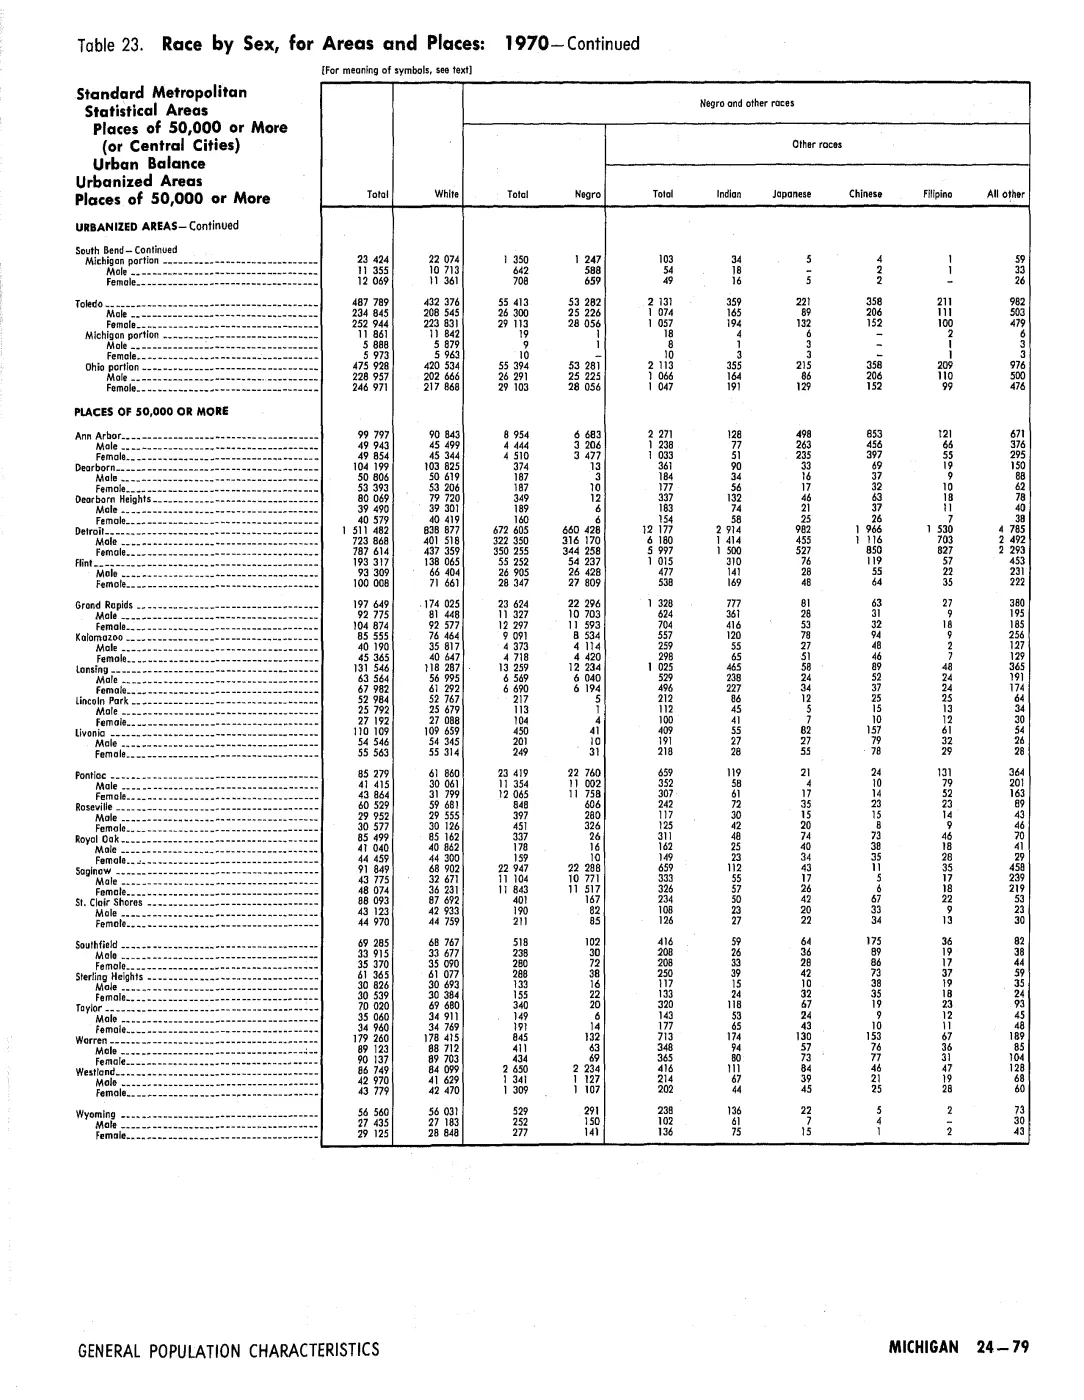
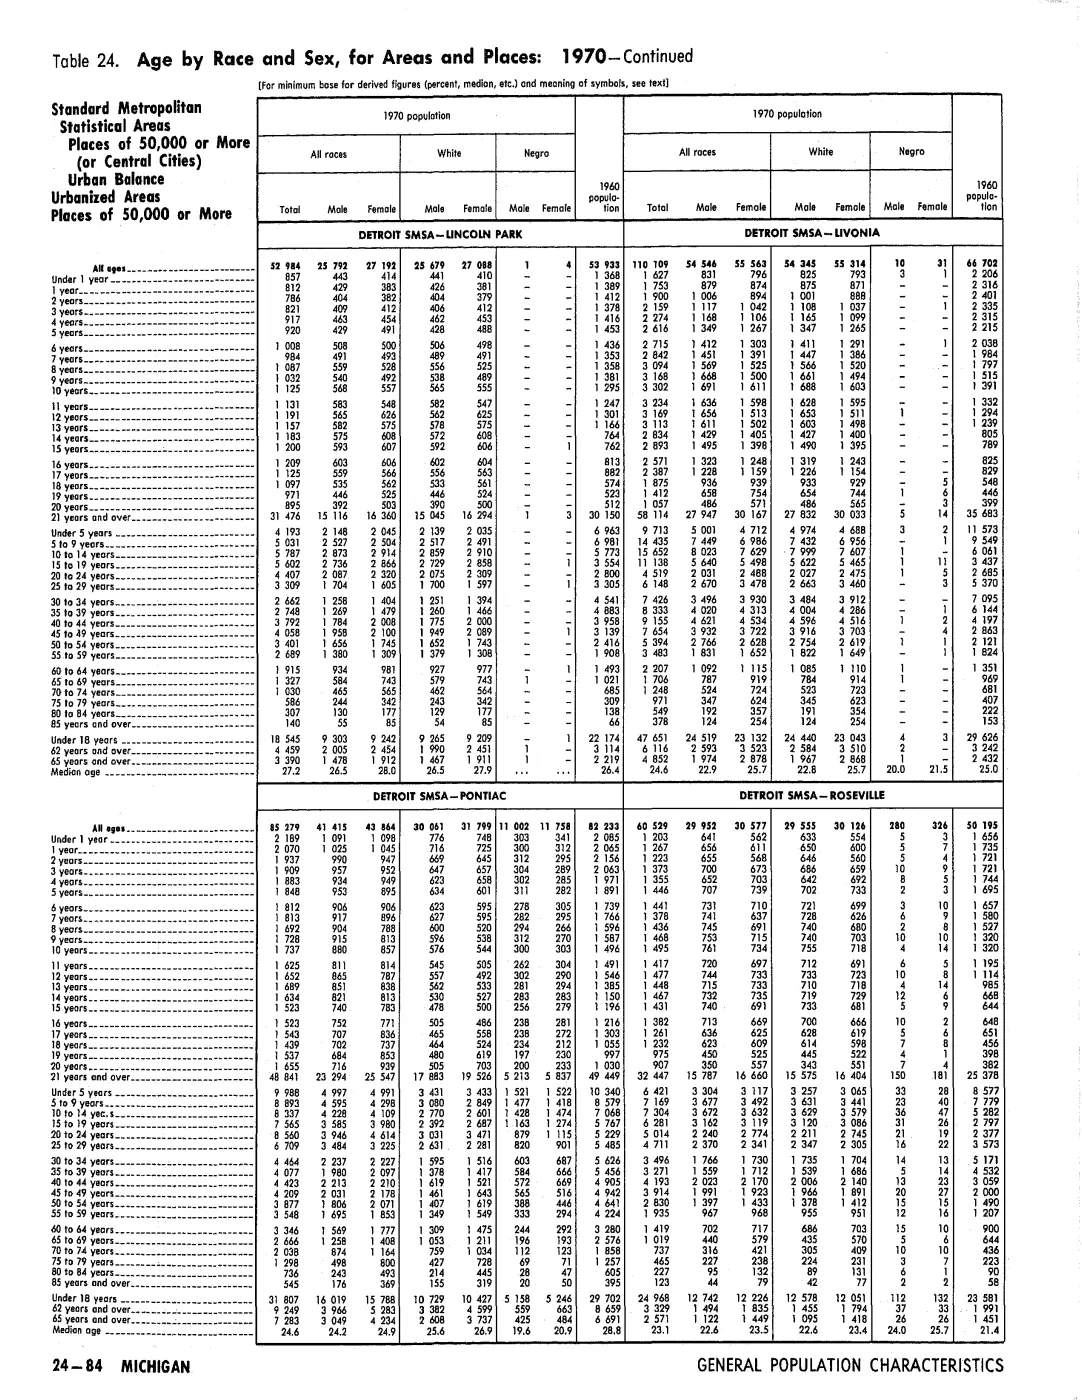
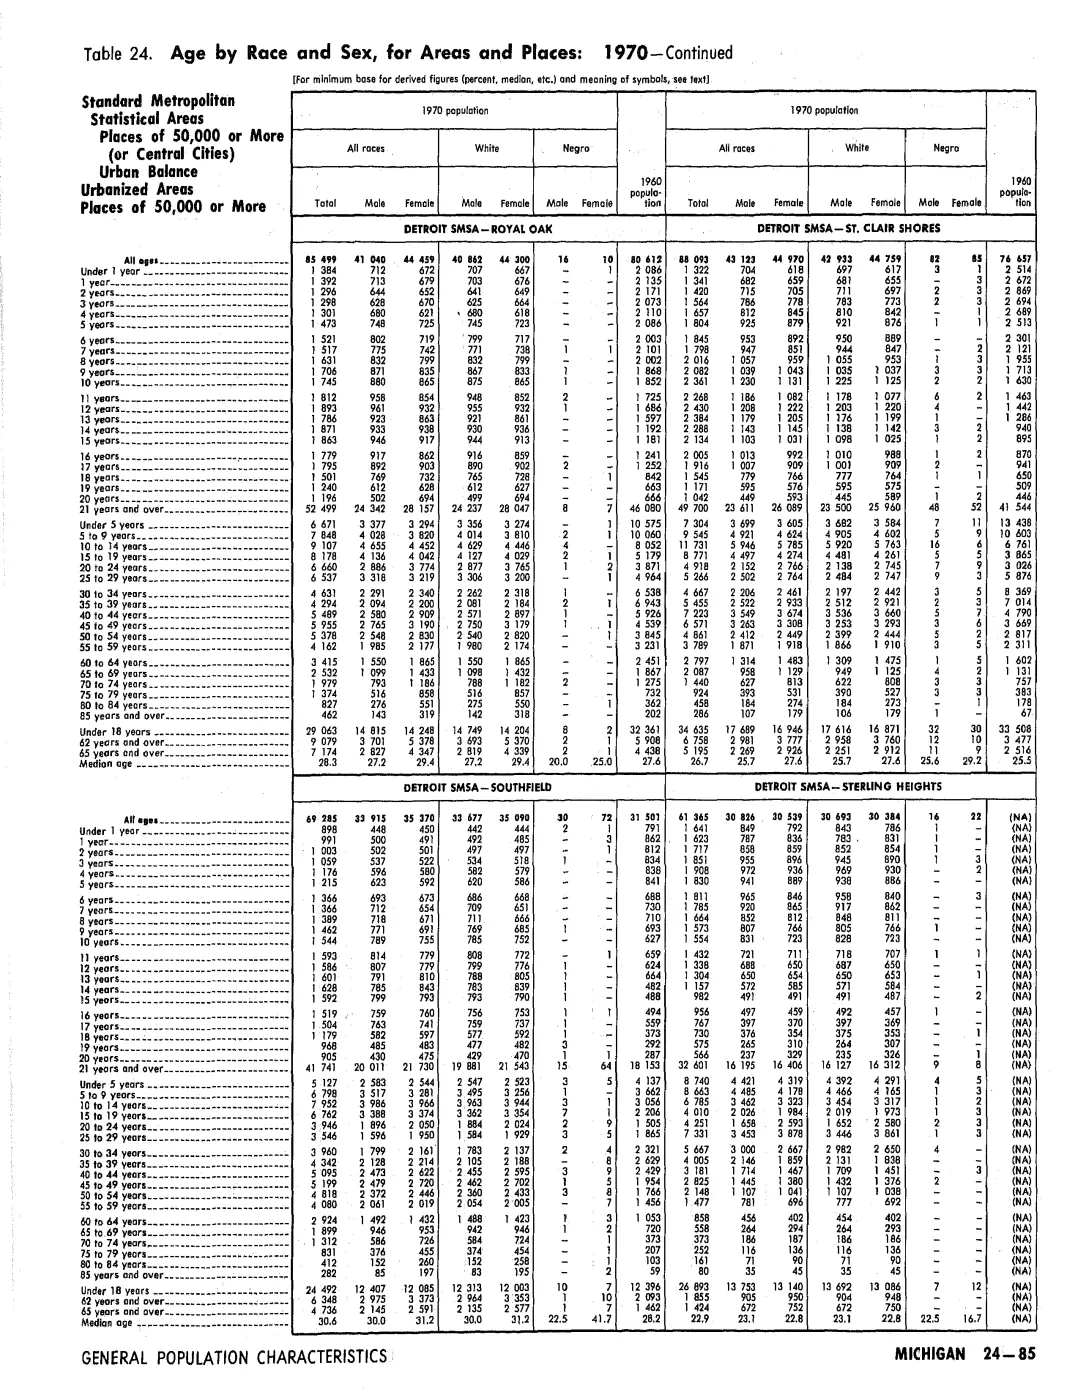
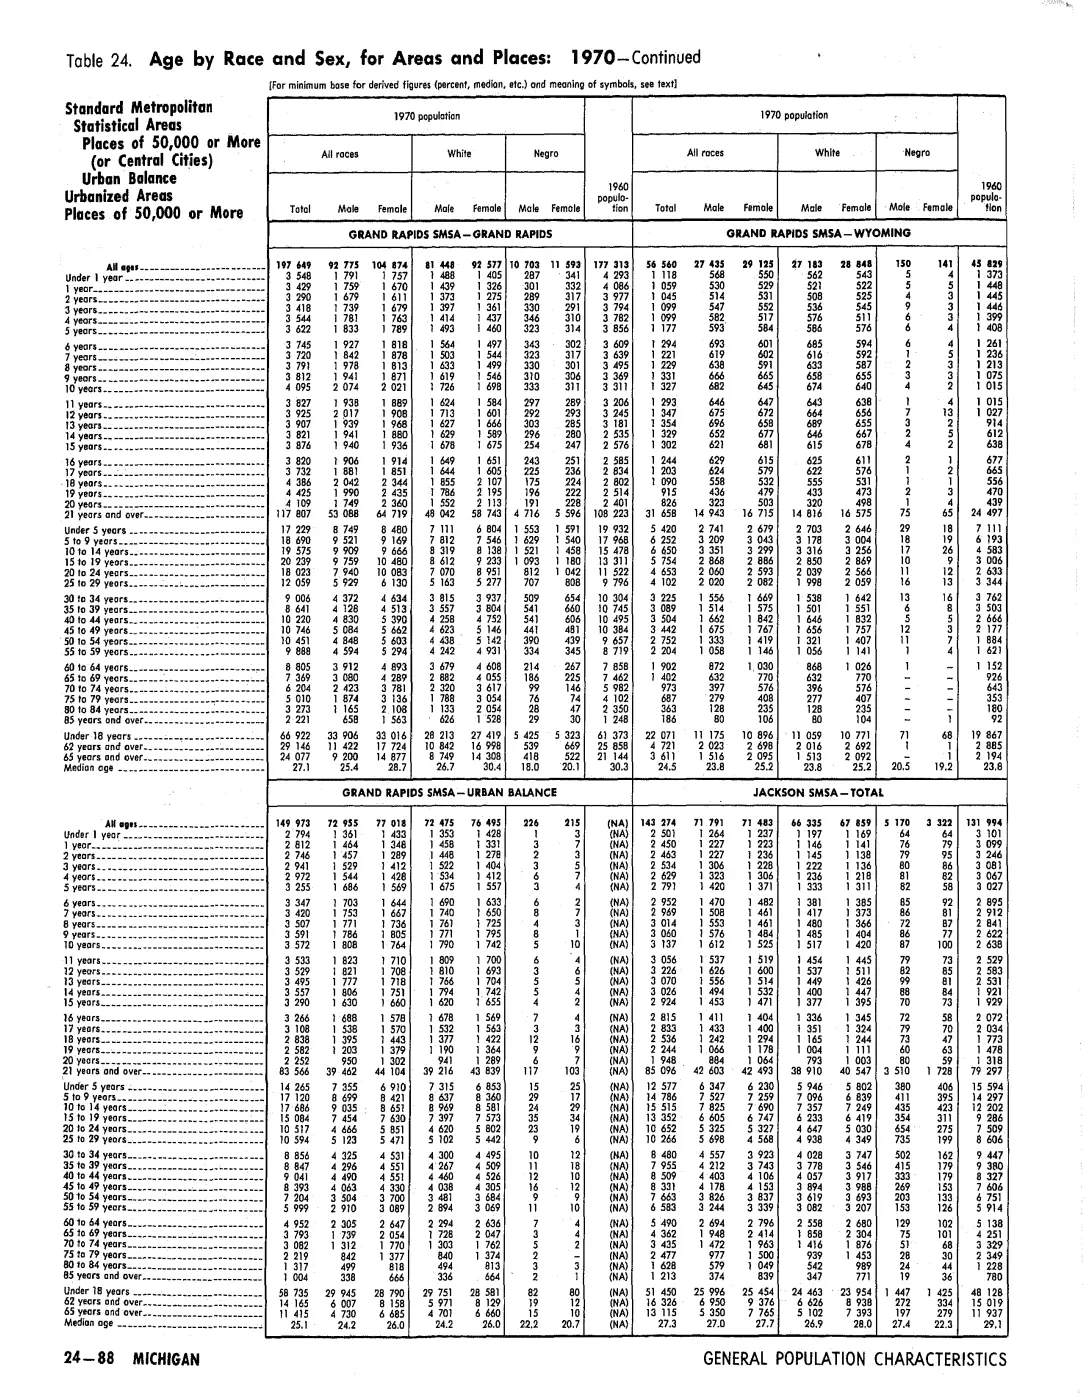
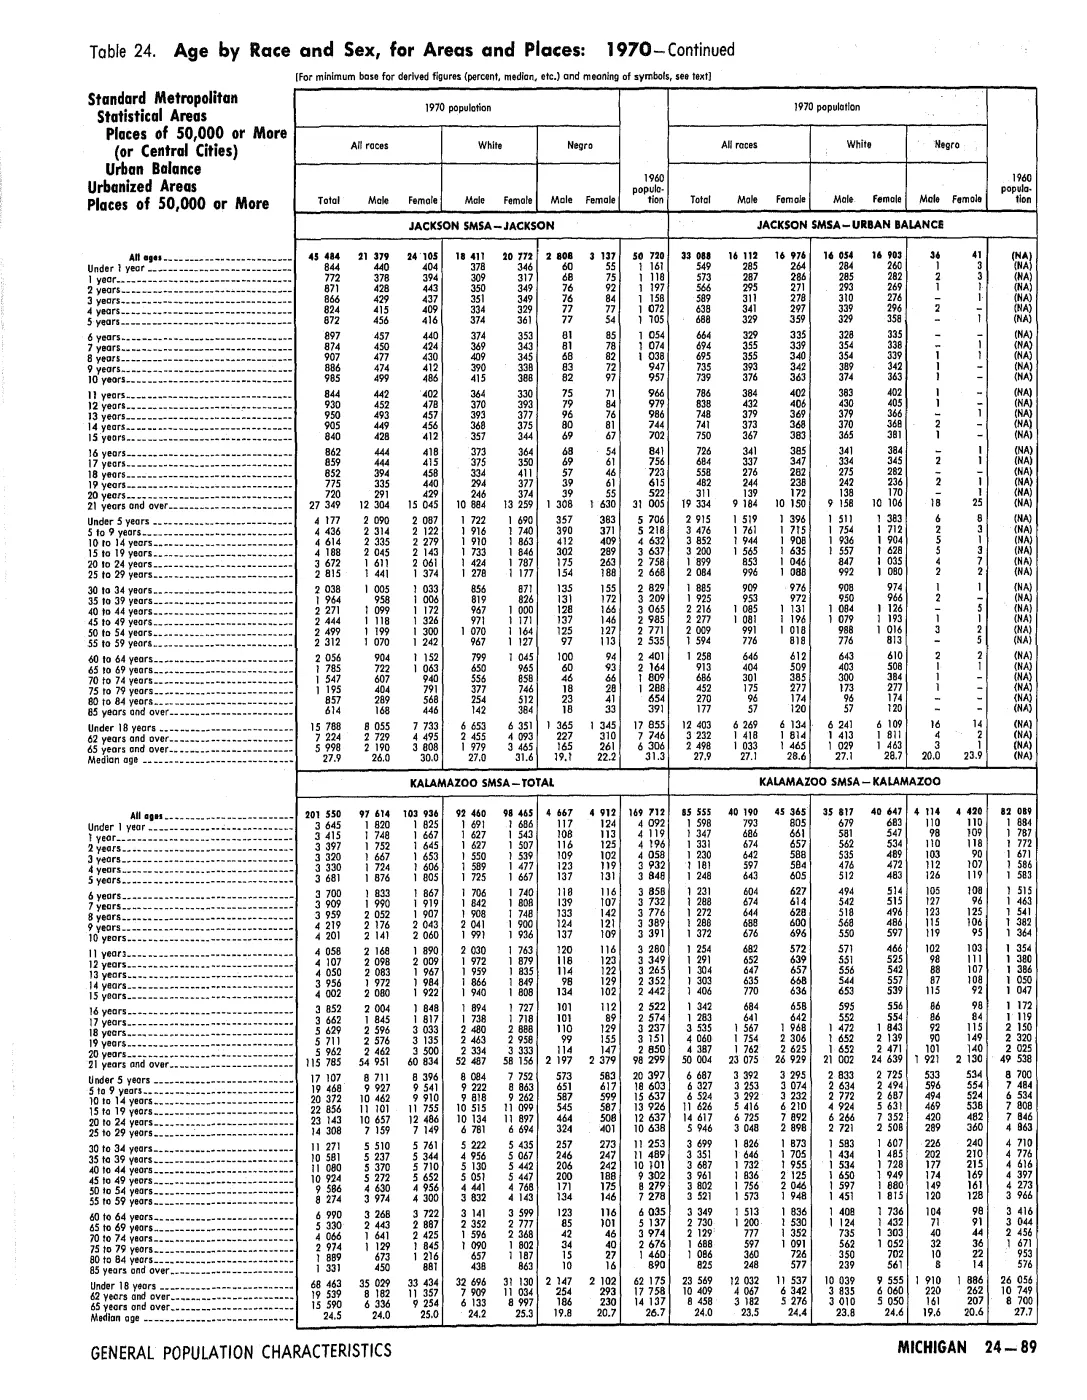
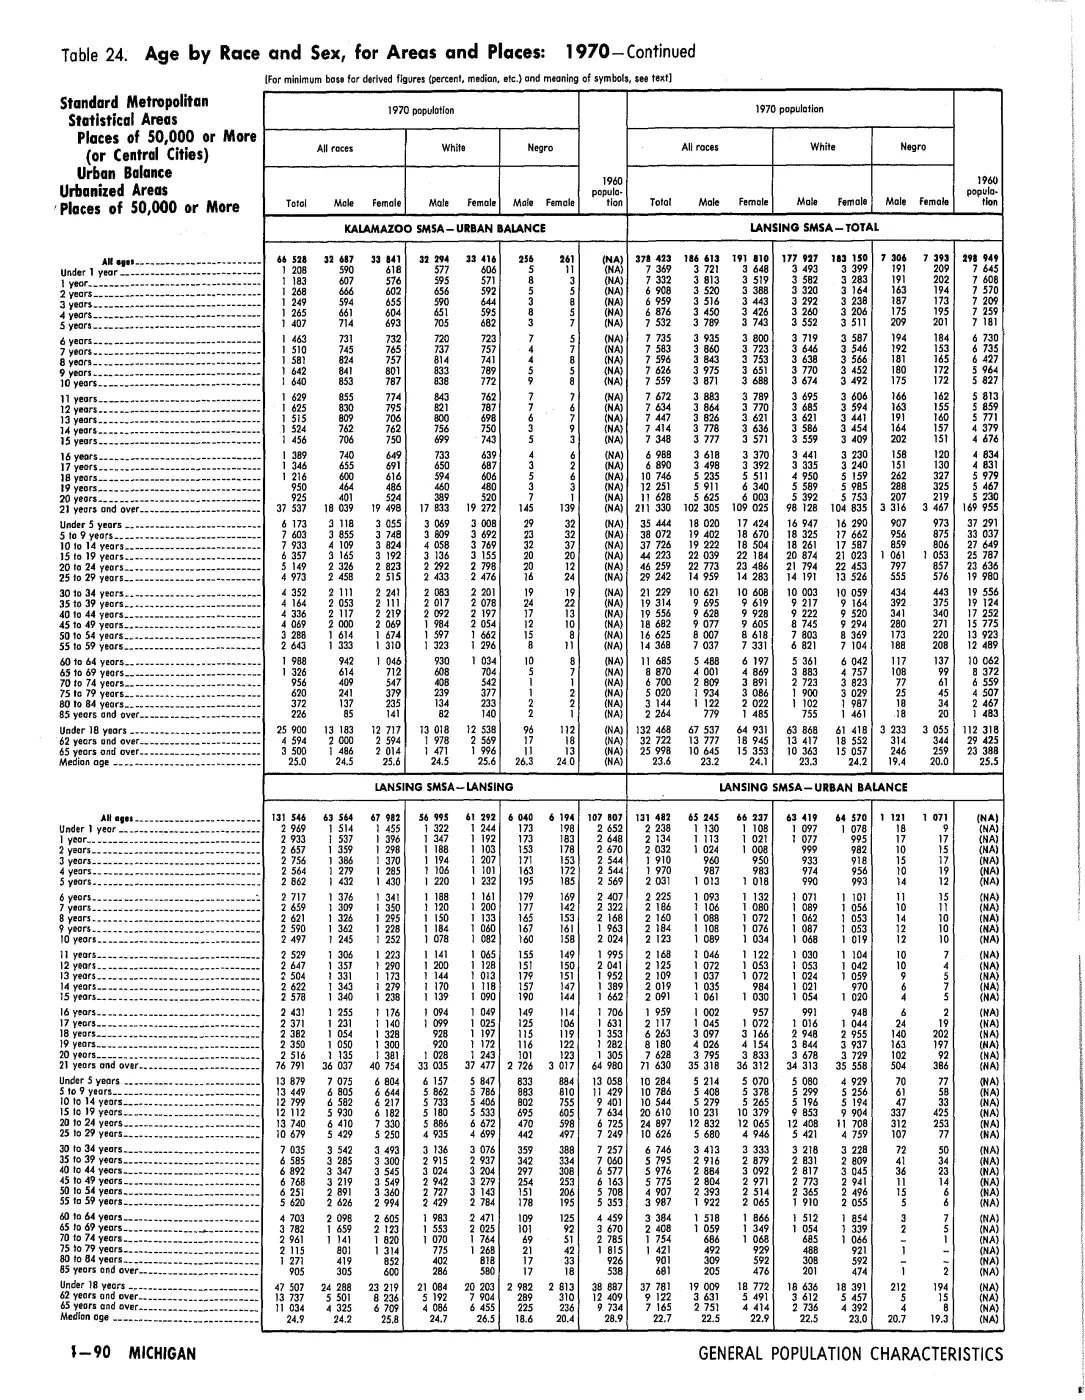
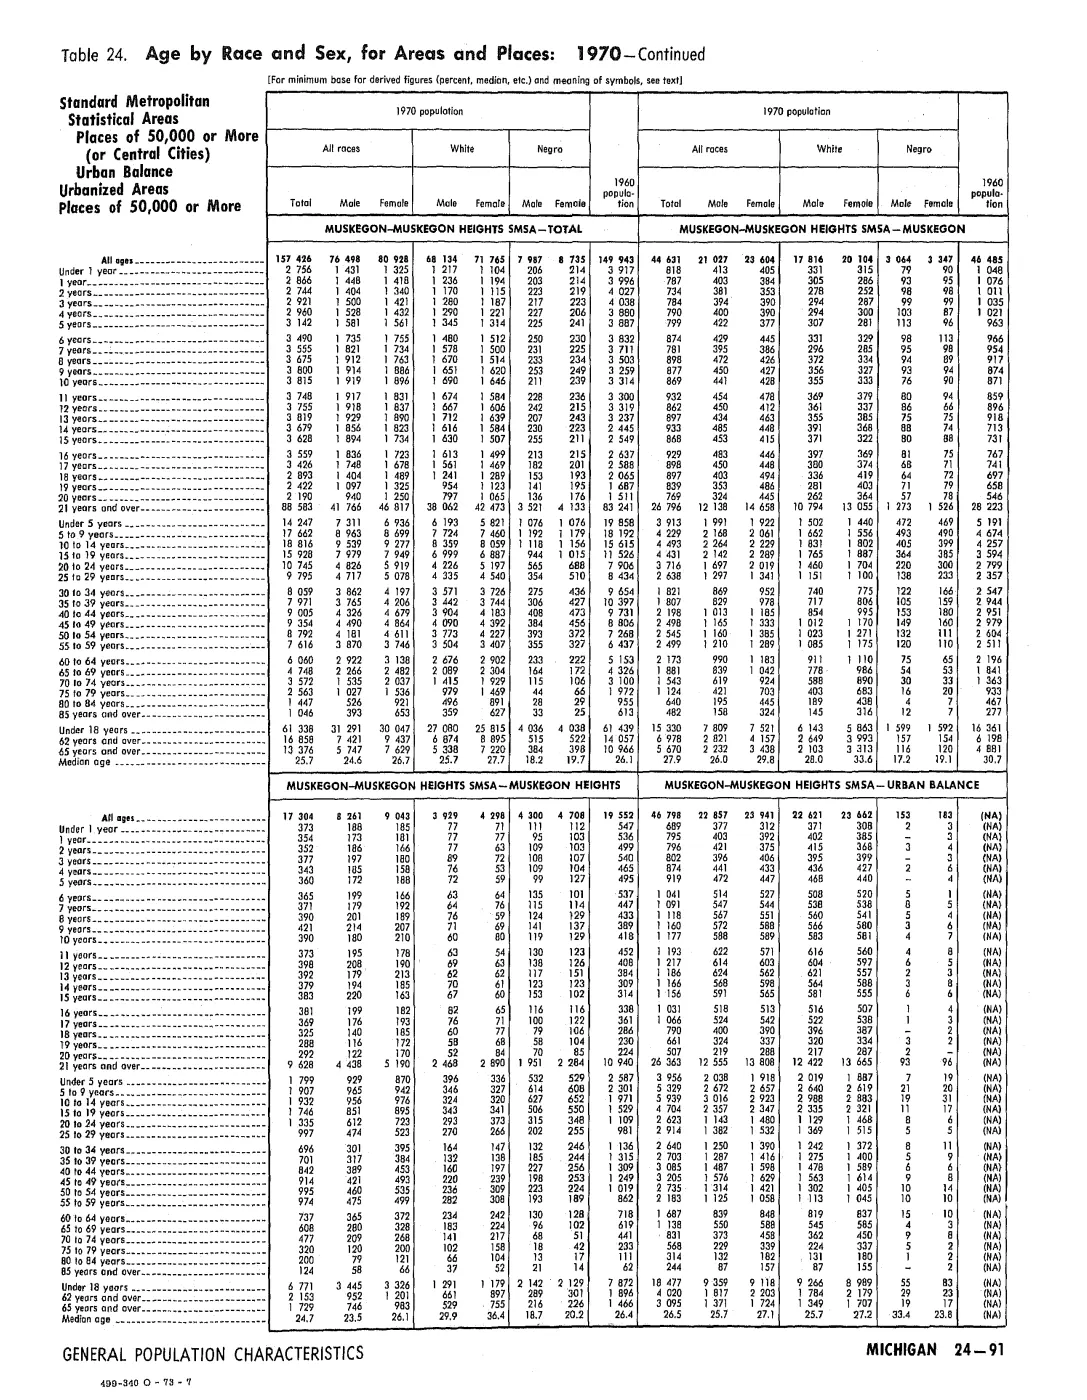
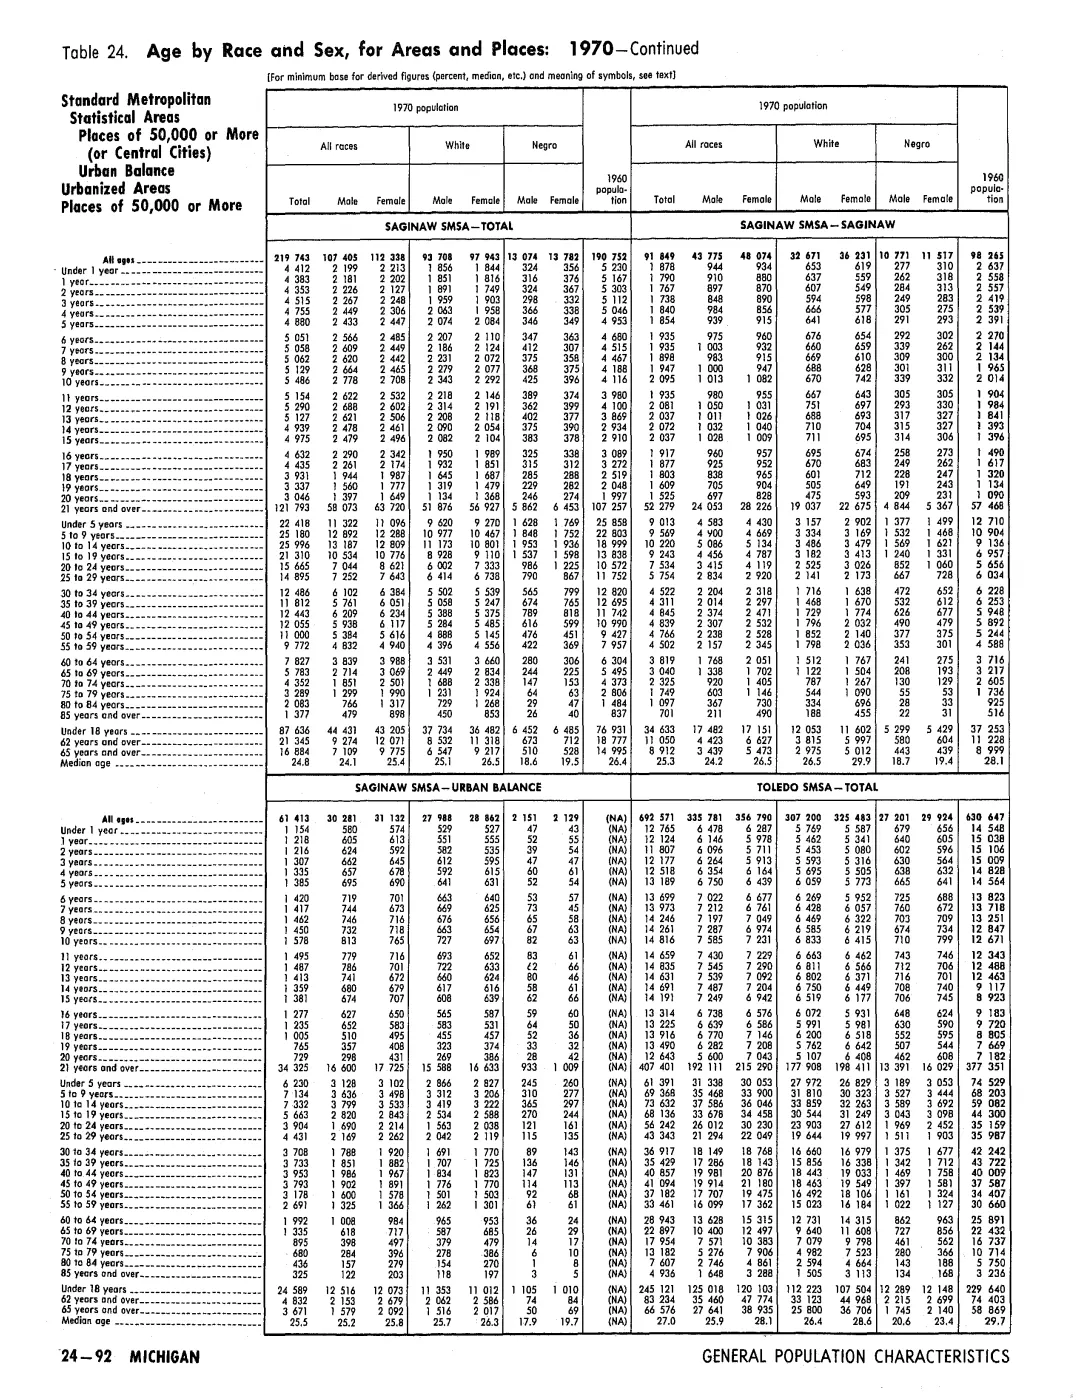
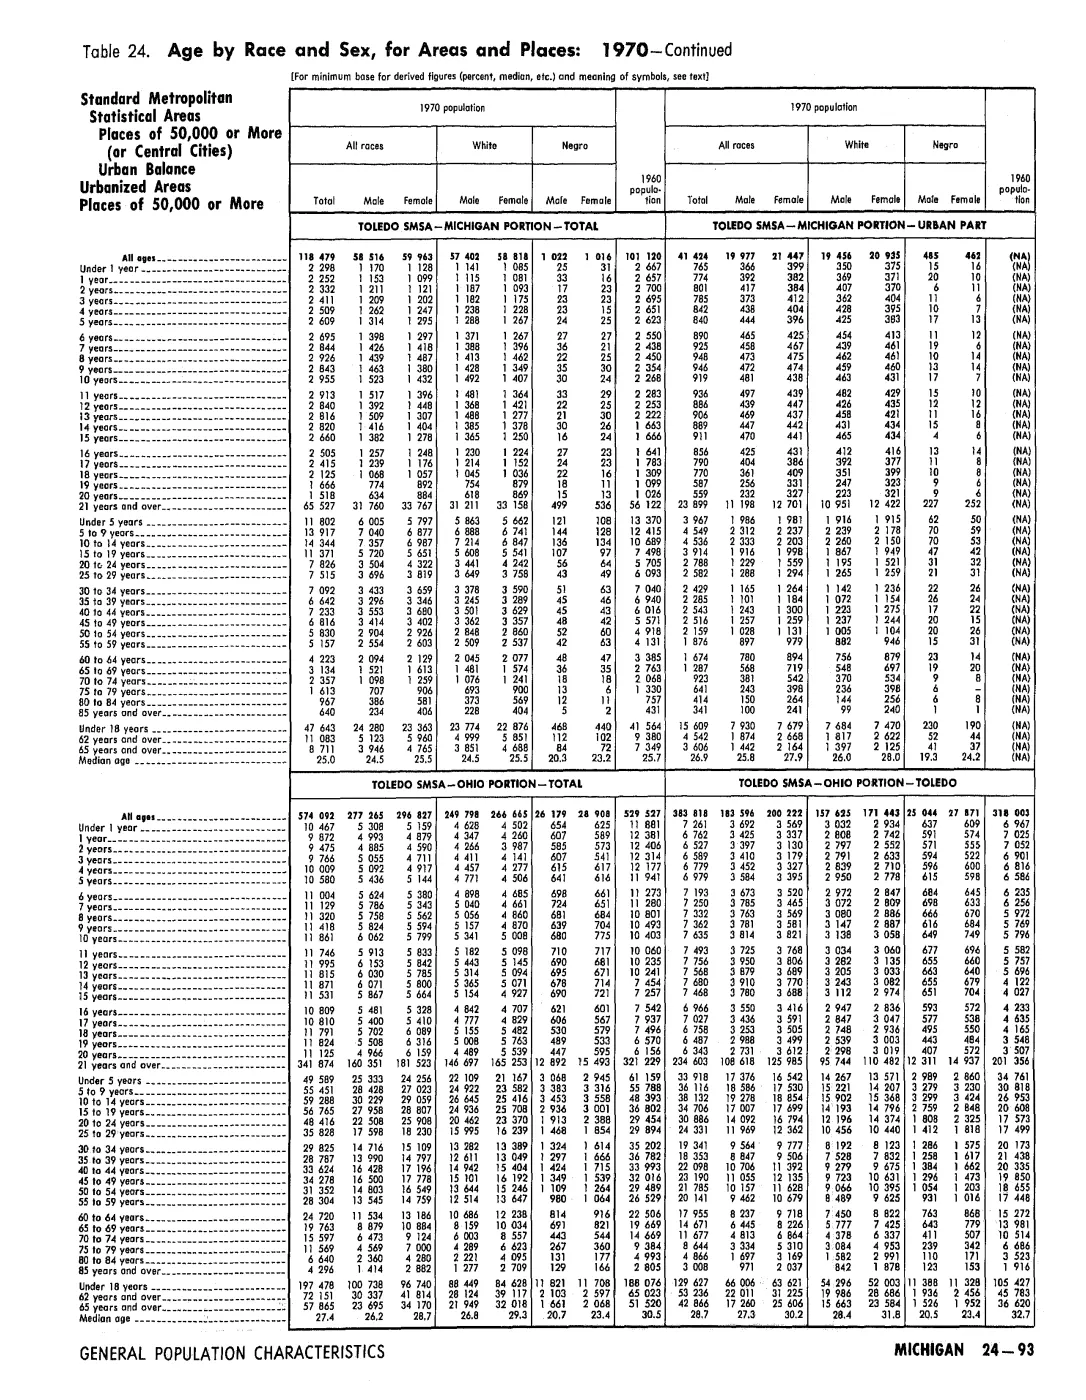
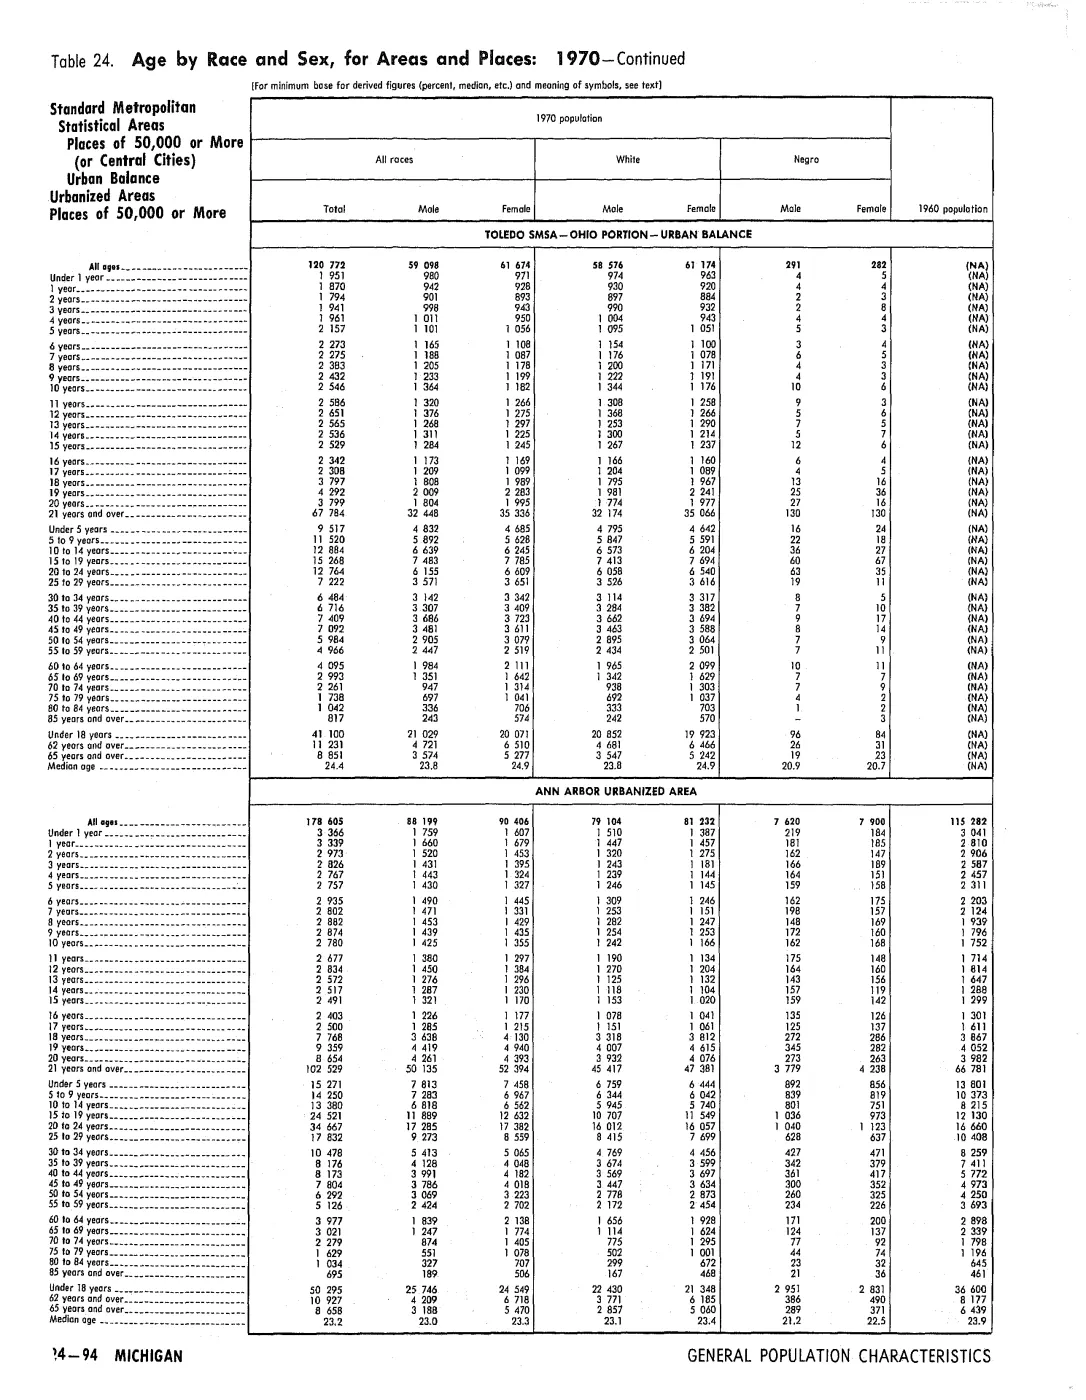
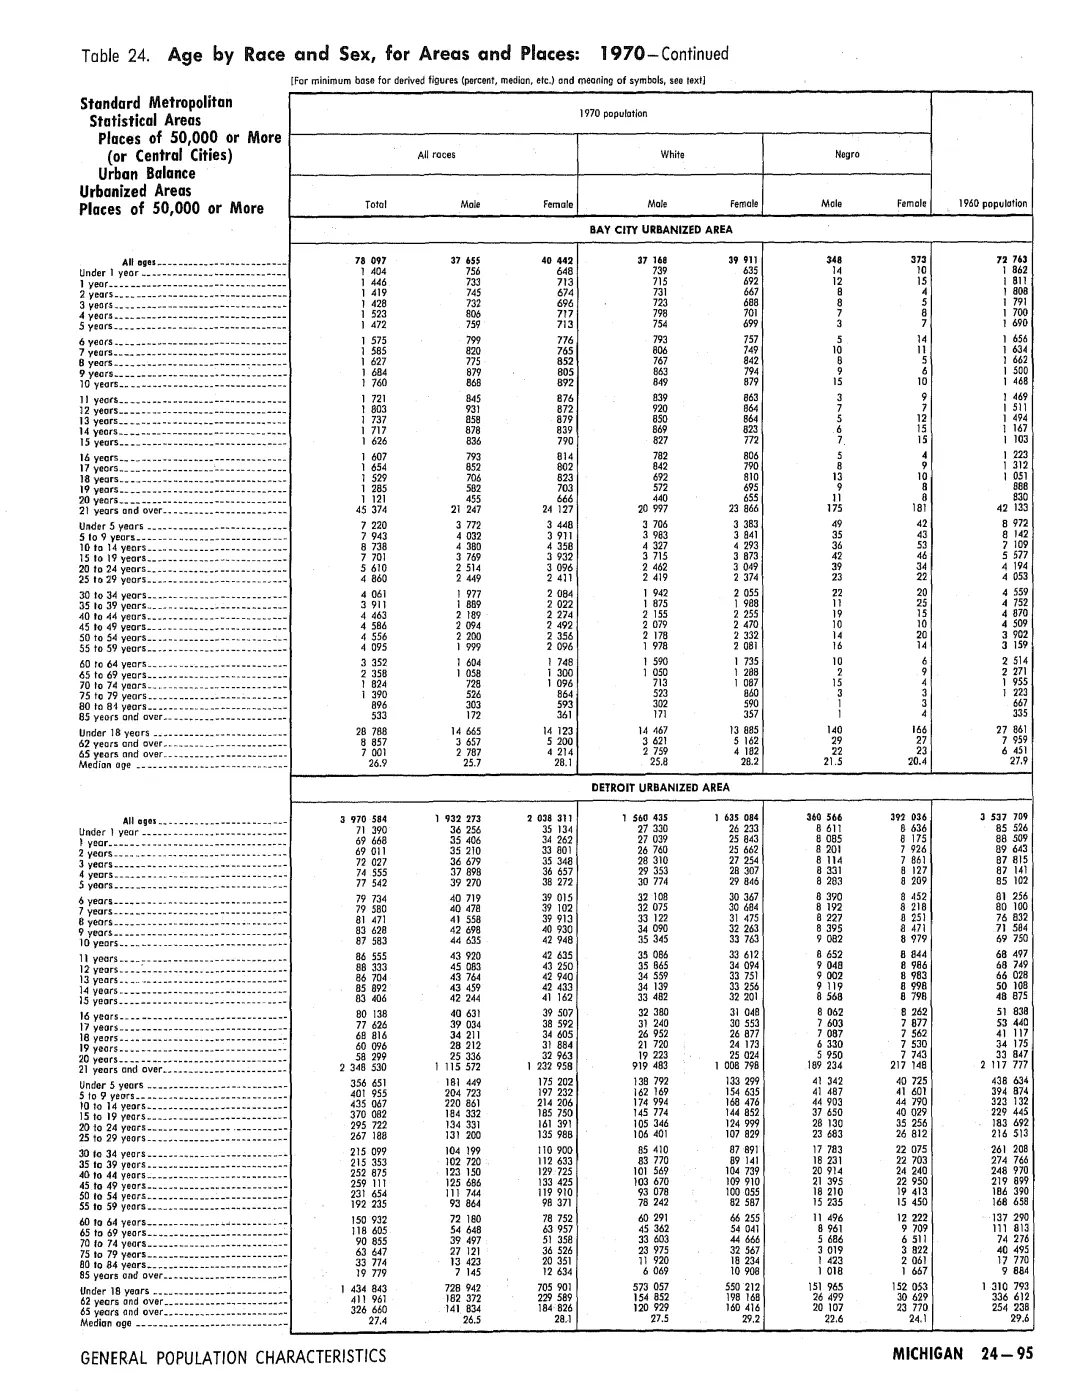
- Table gives Peaine/St. James counts of 48/169 in 1960 and 58/161 in 1970.demographics · historical_census · 1970-population-michigan-county-subdivisions
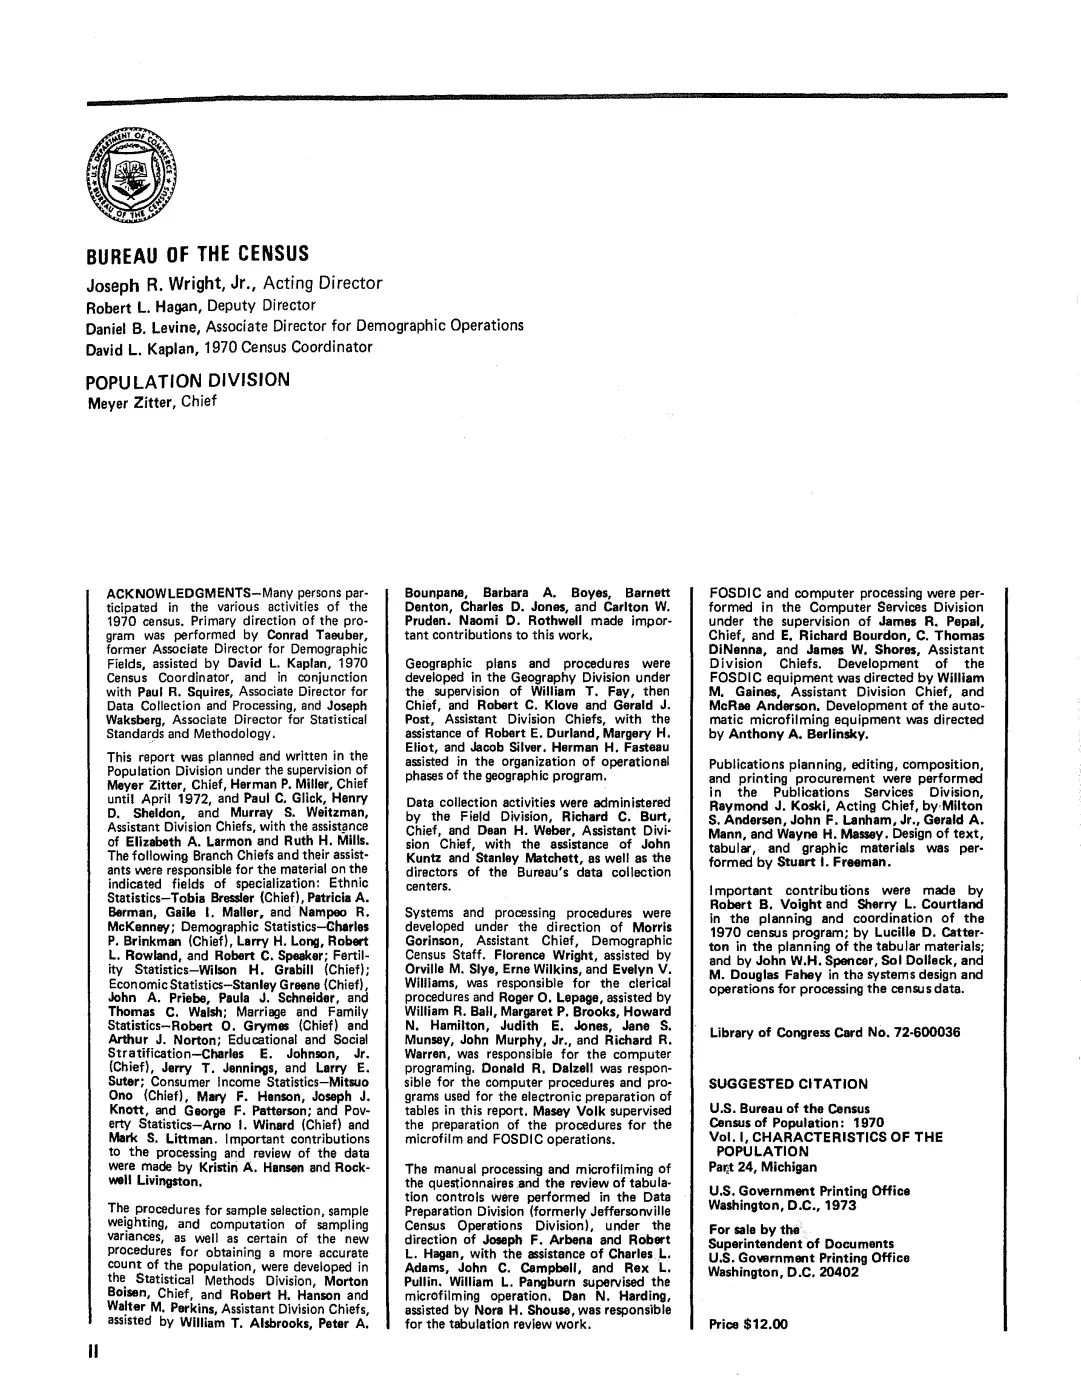
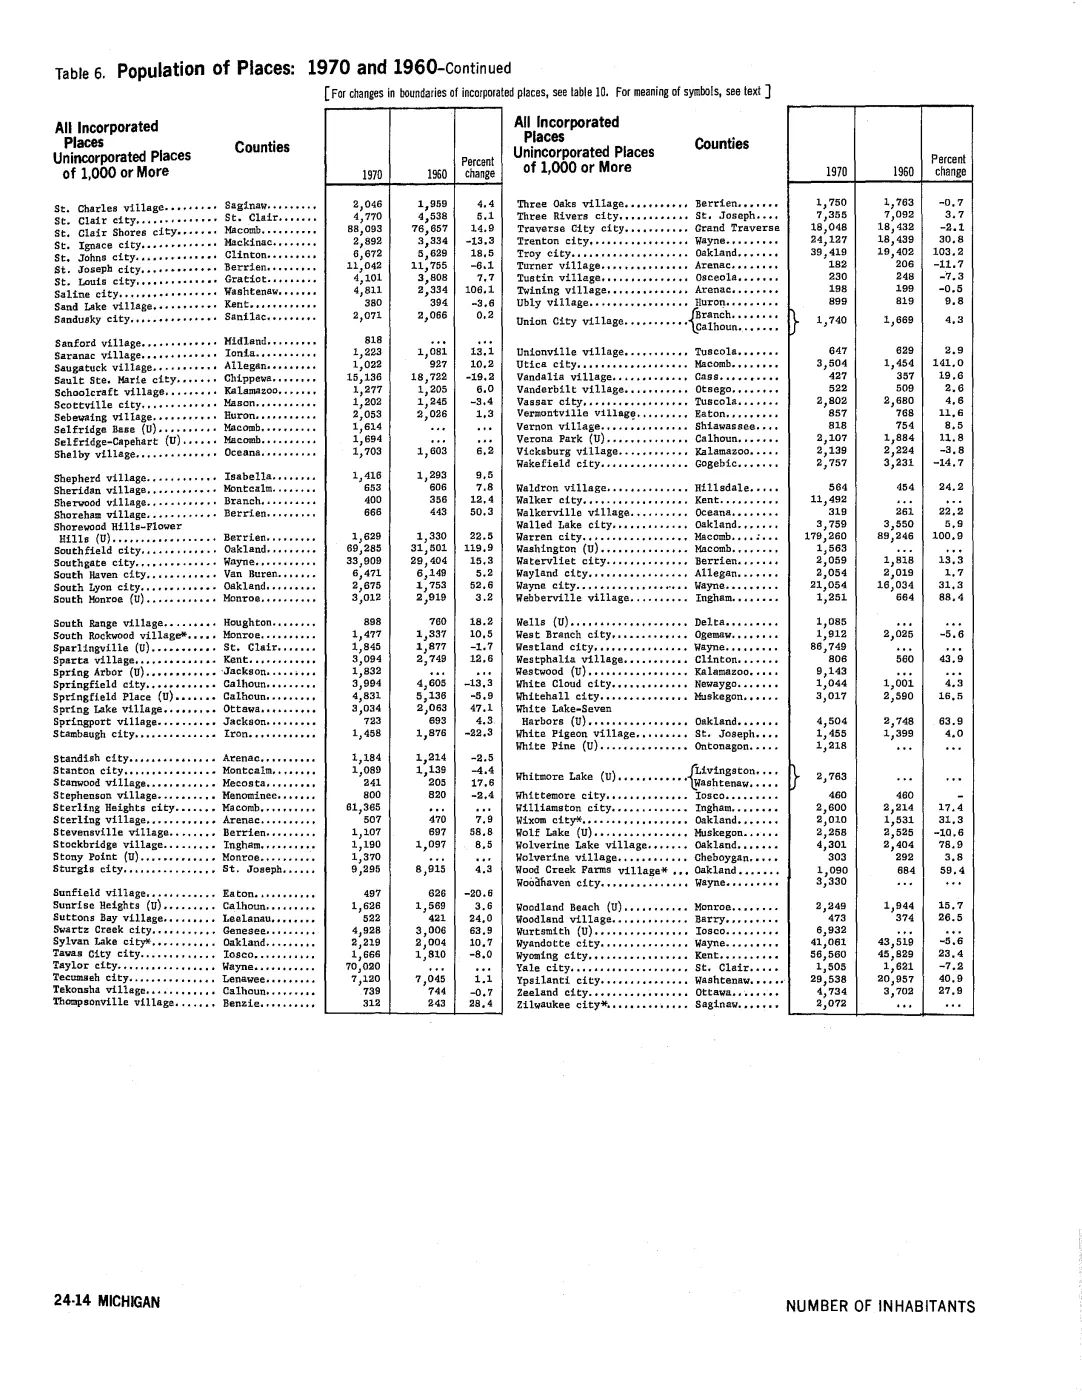
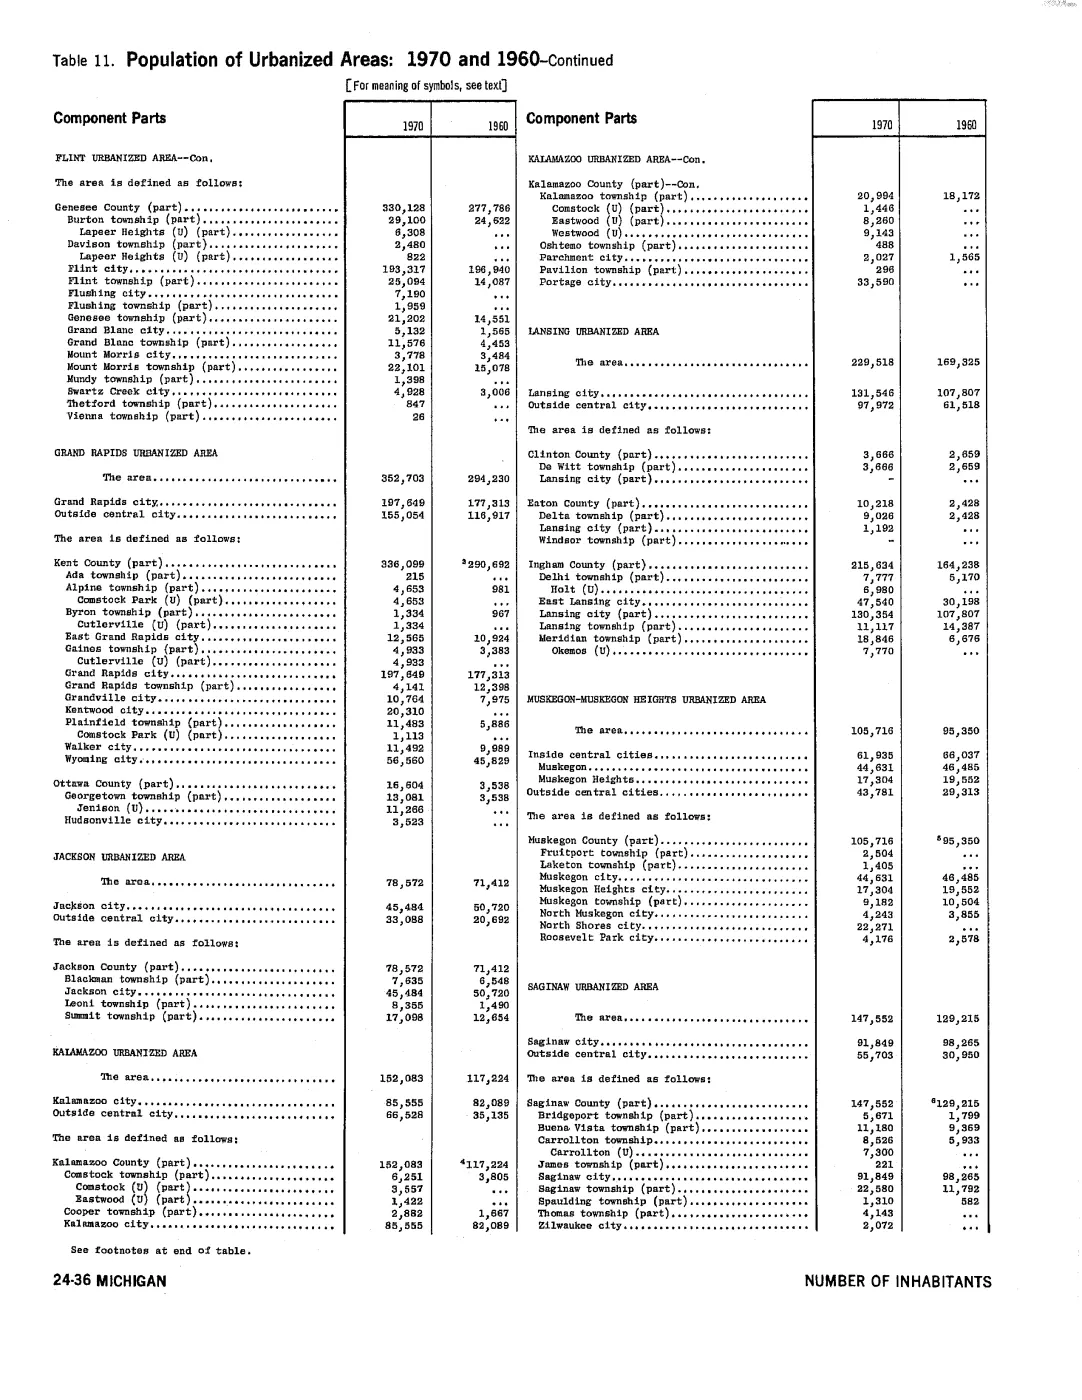
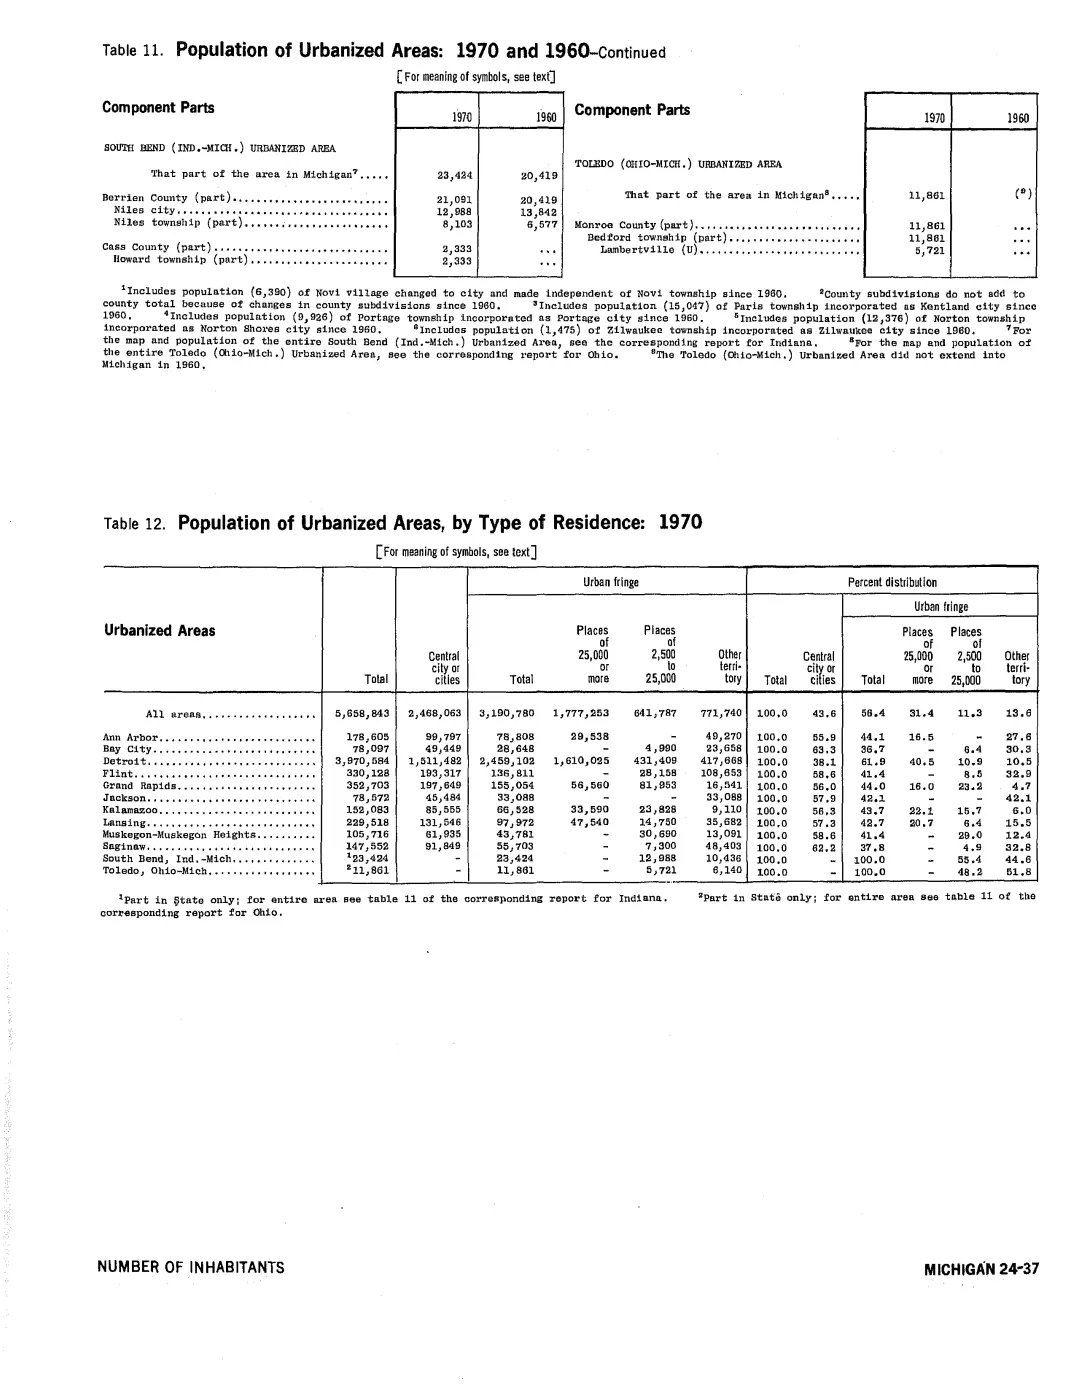
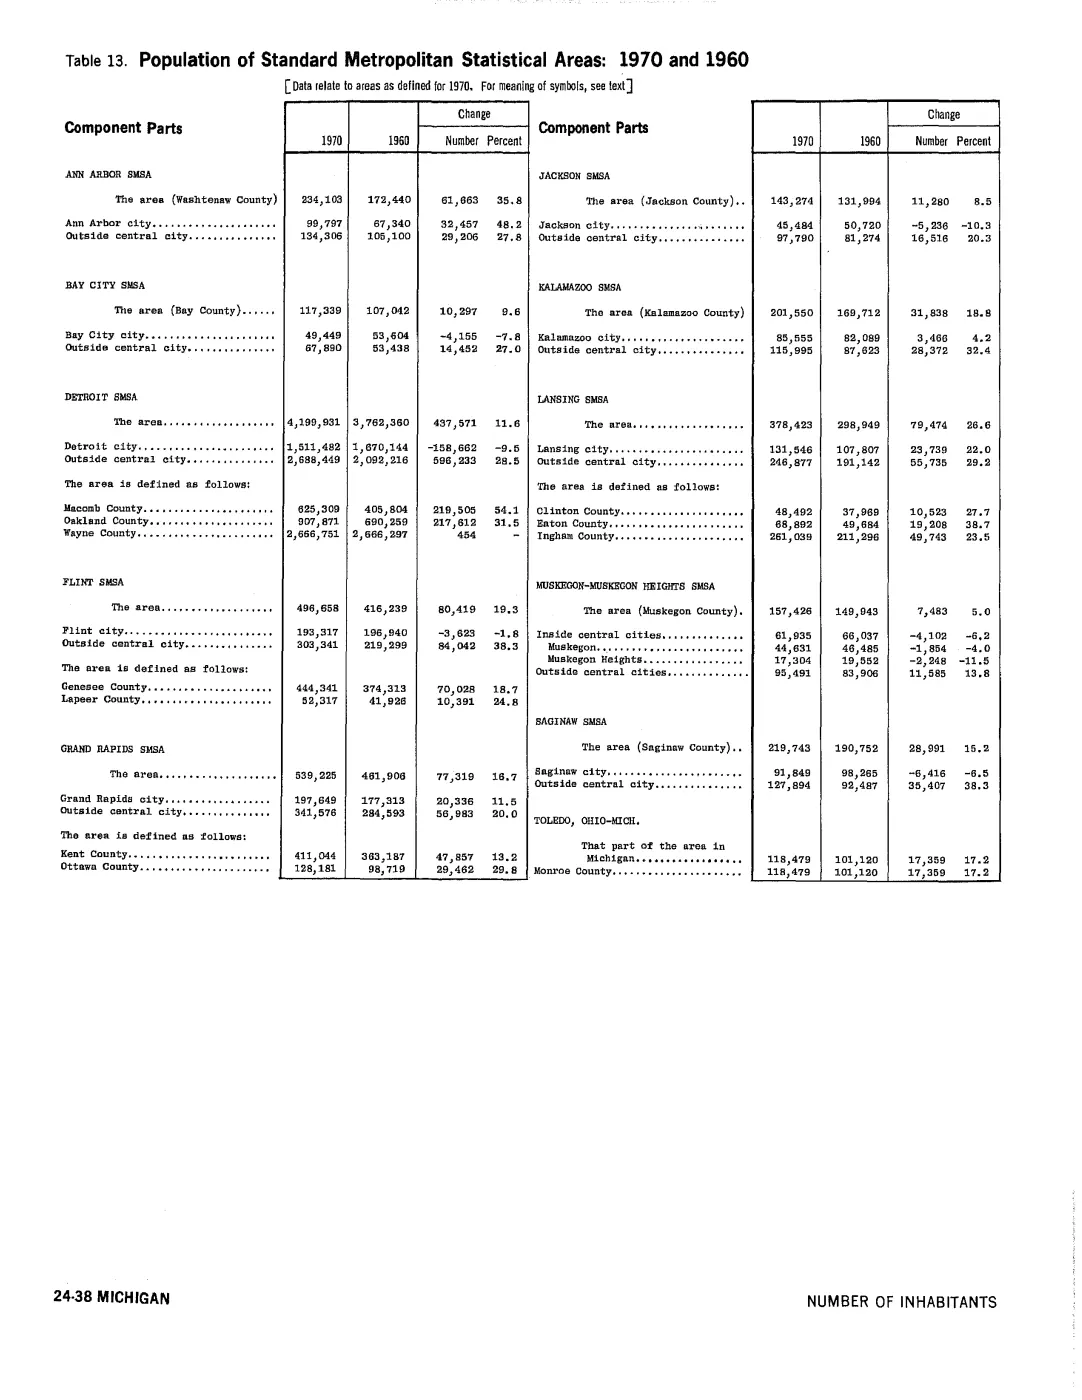
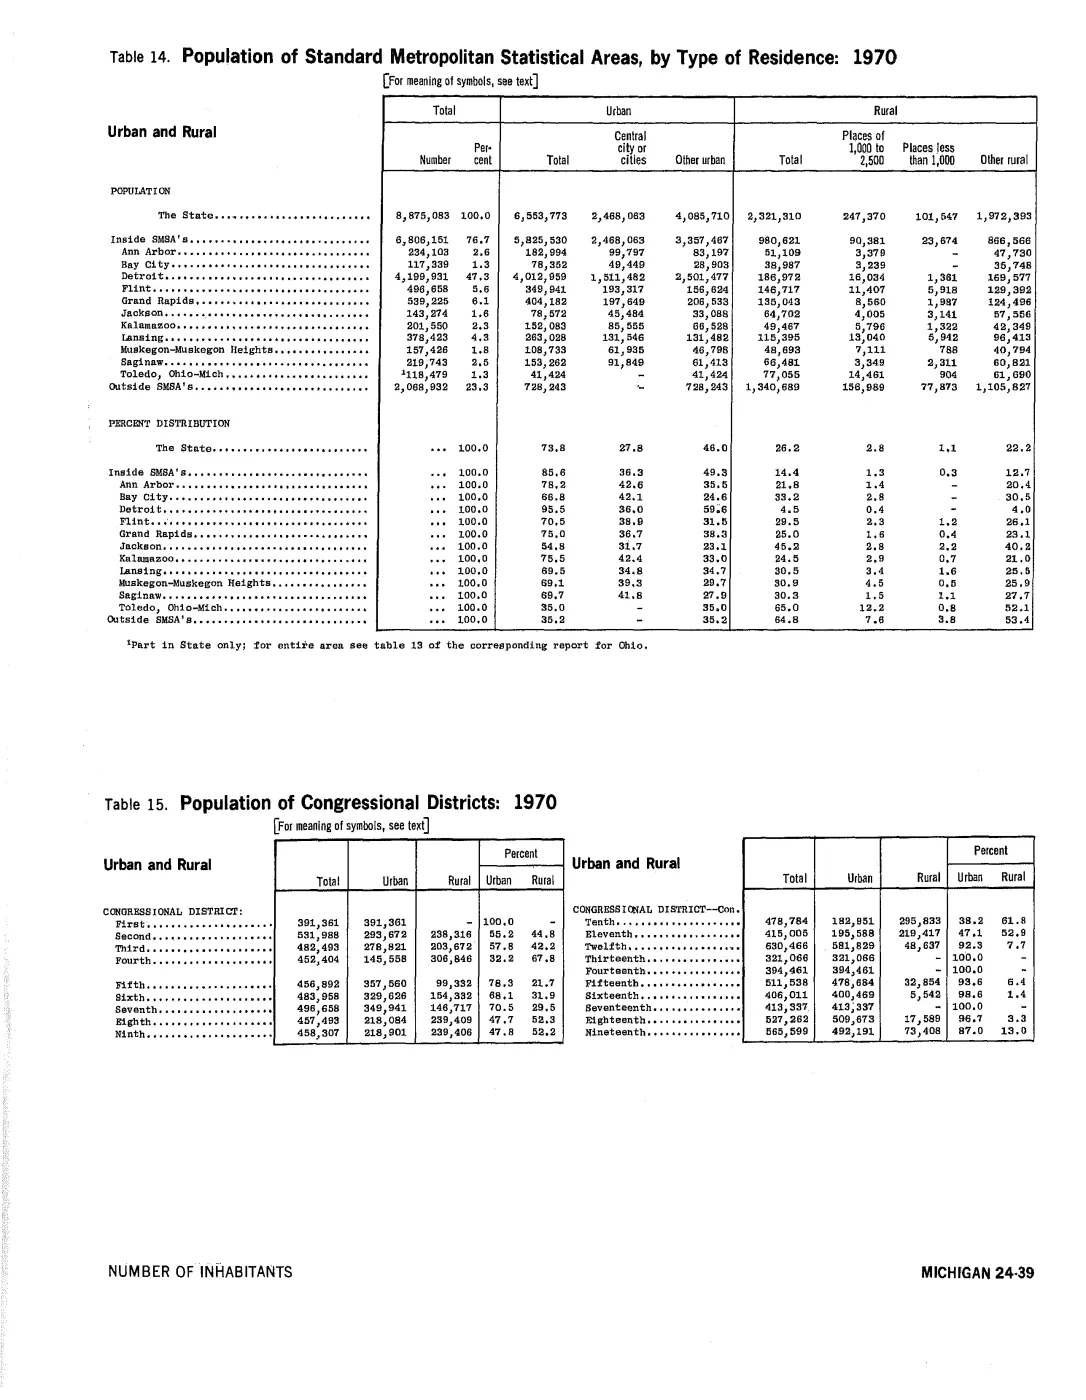
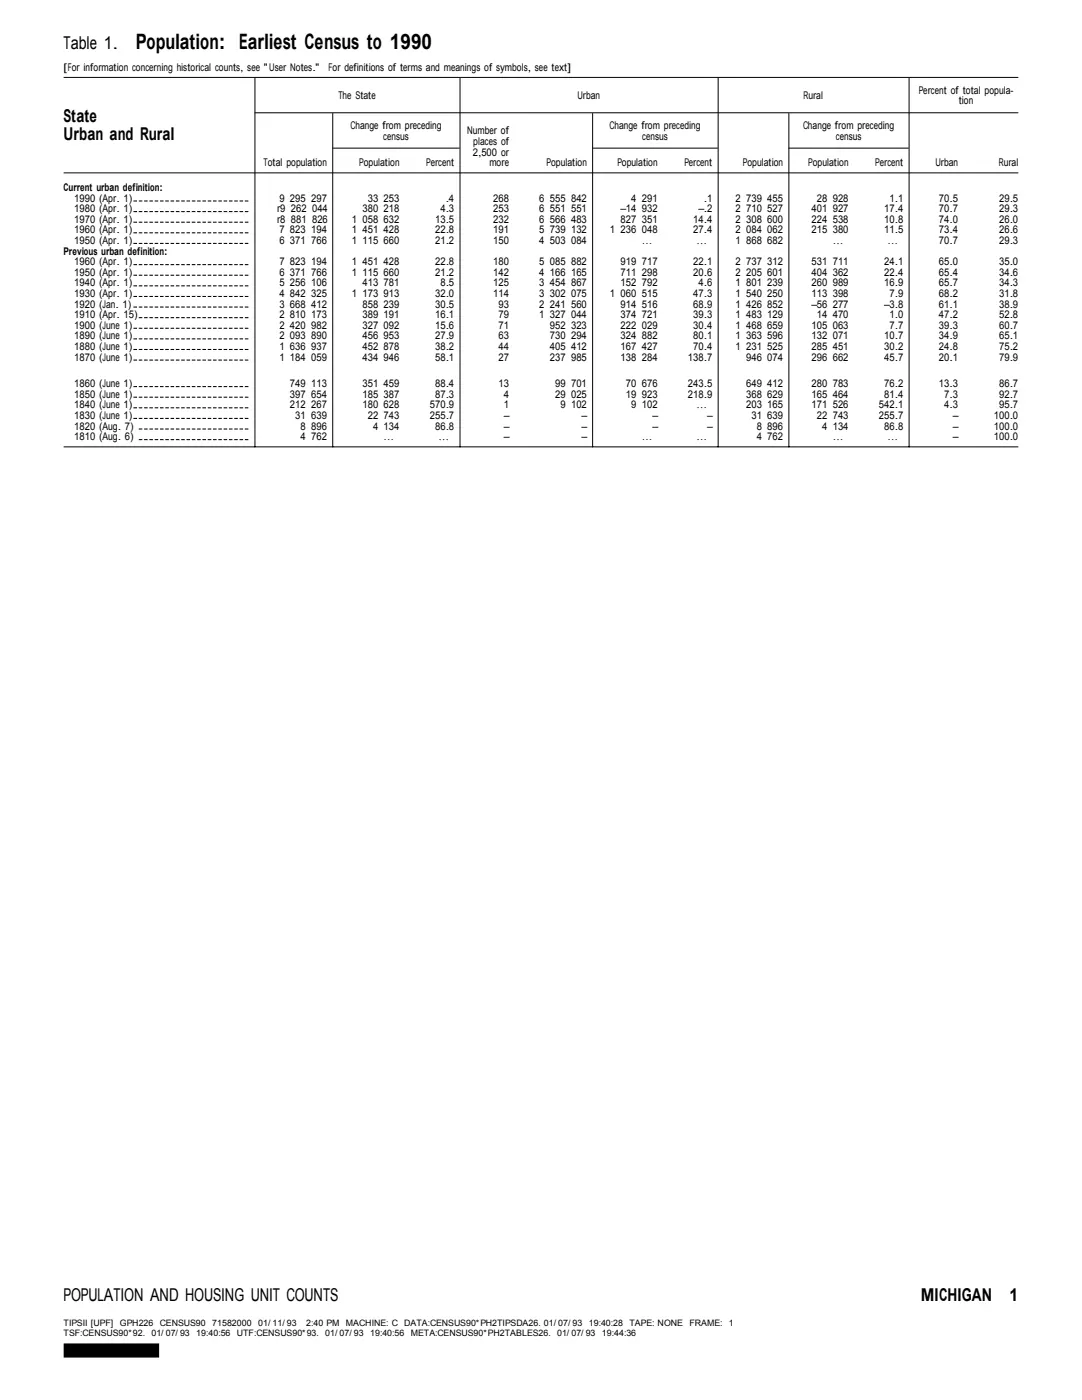
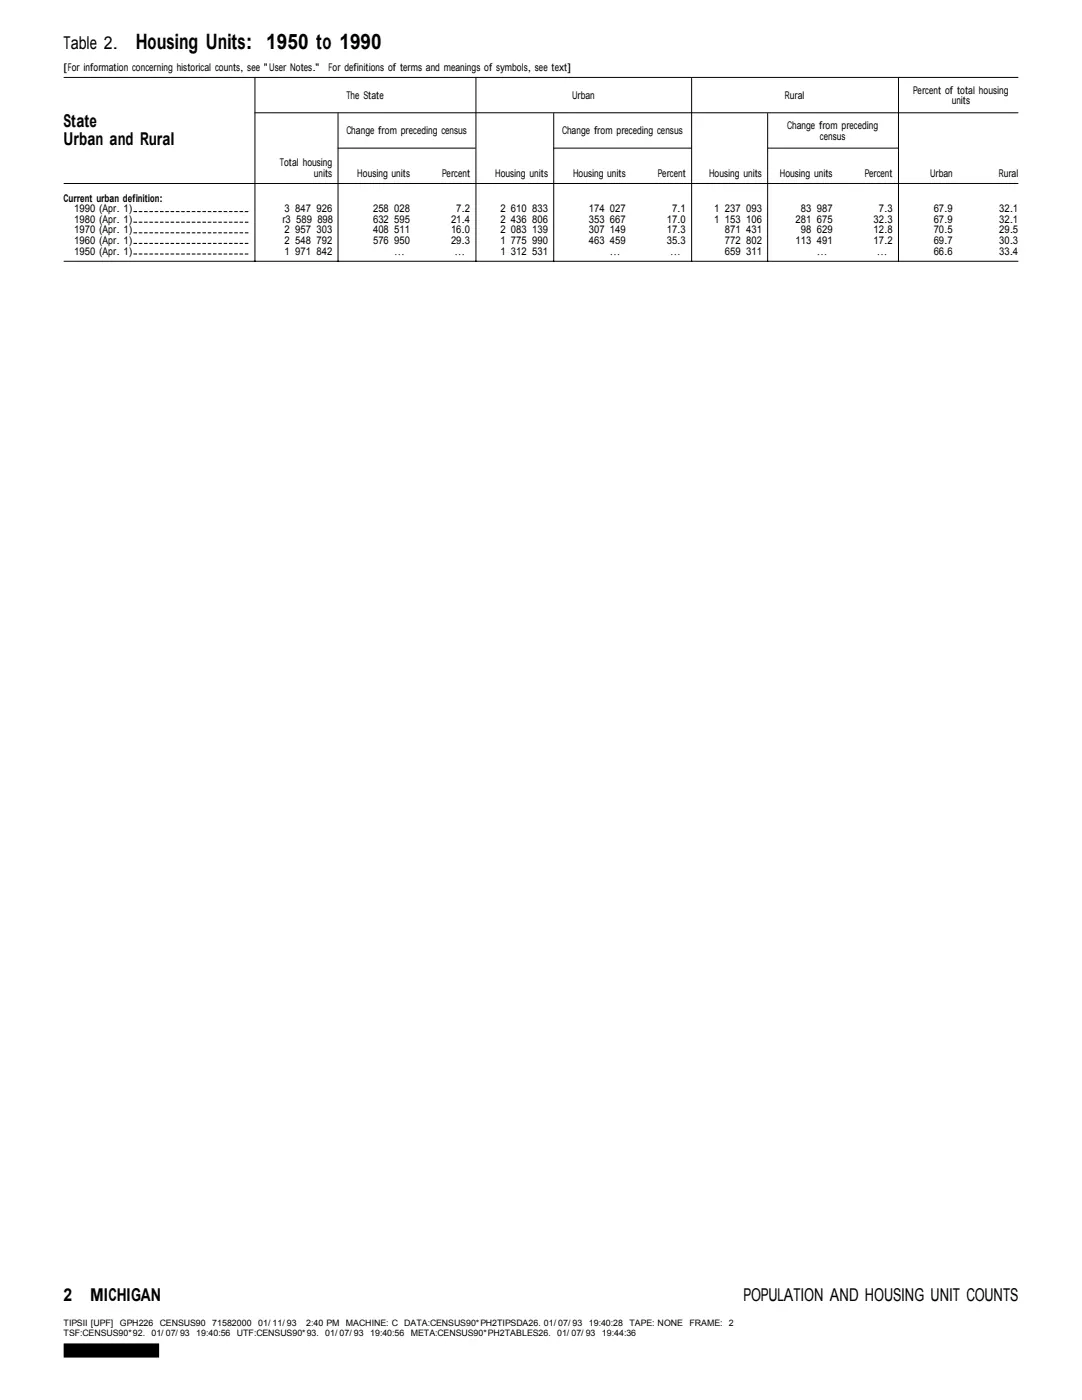
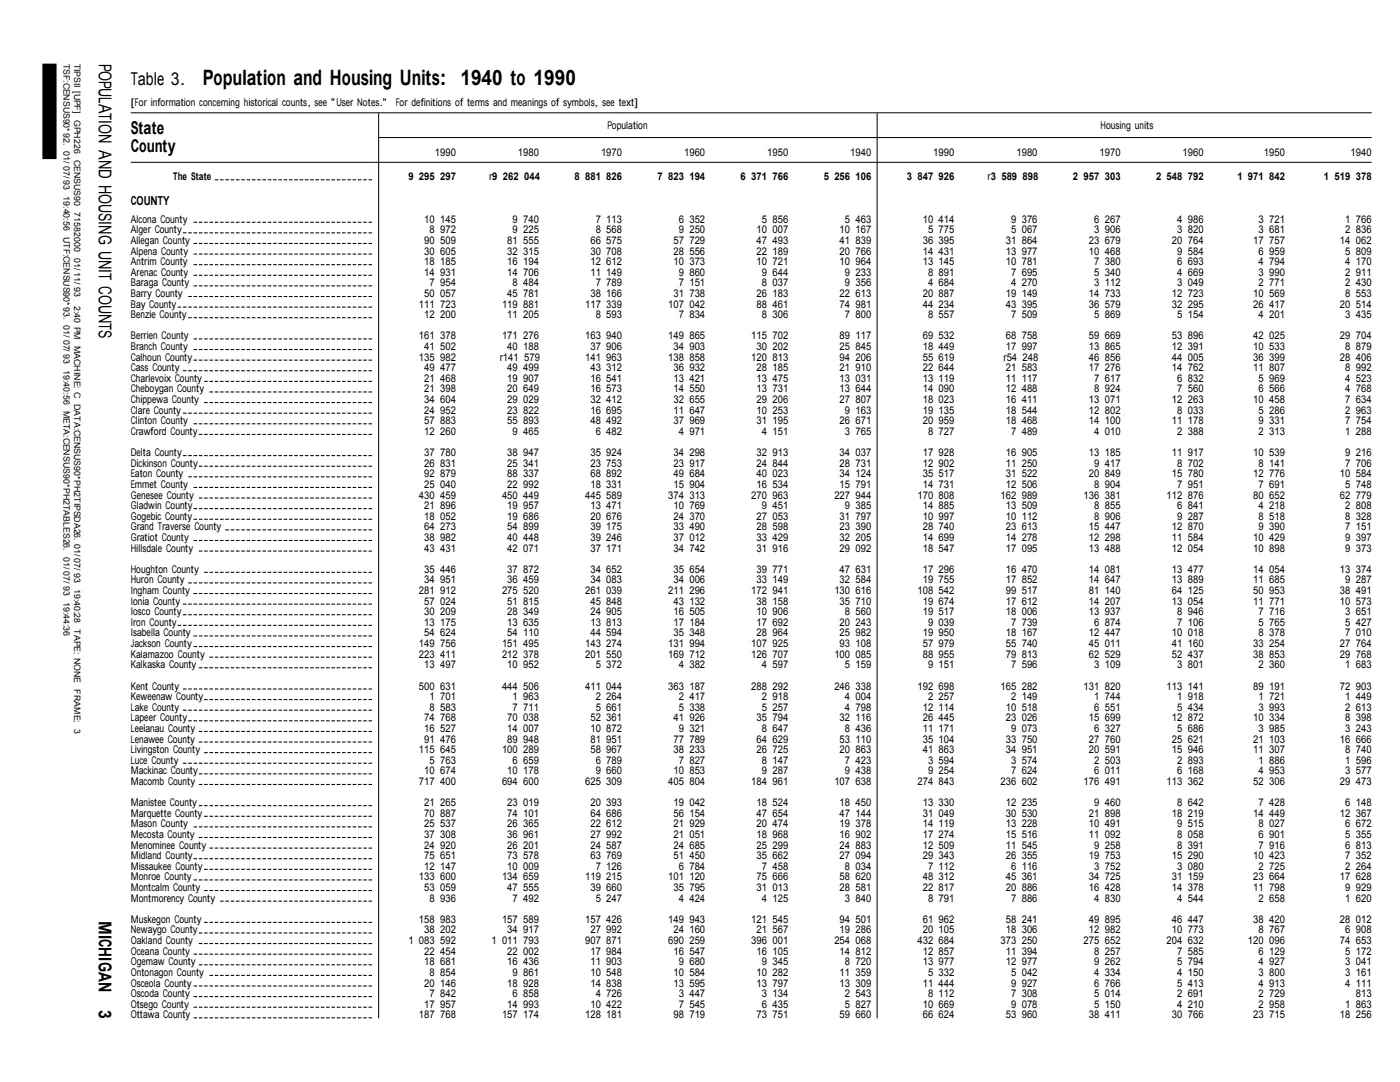
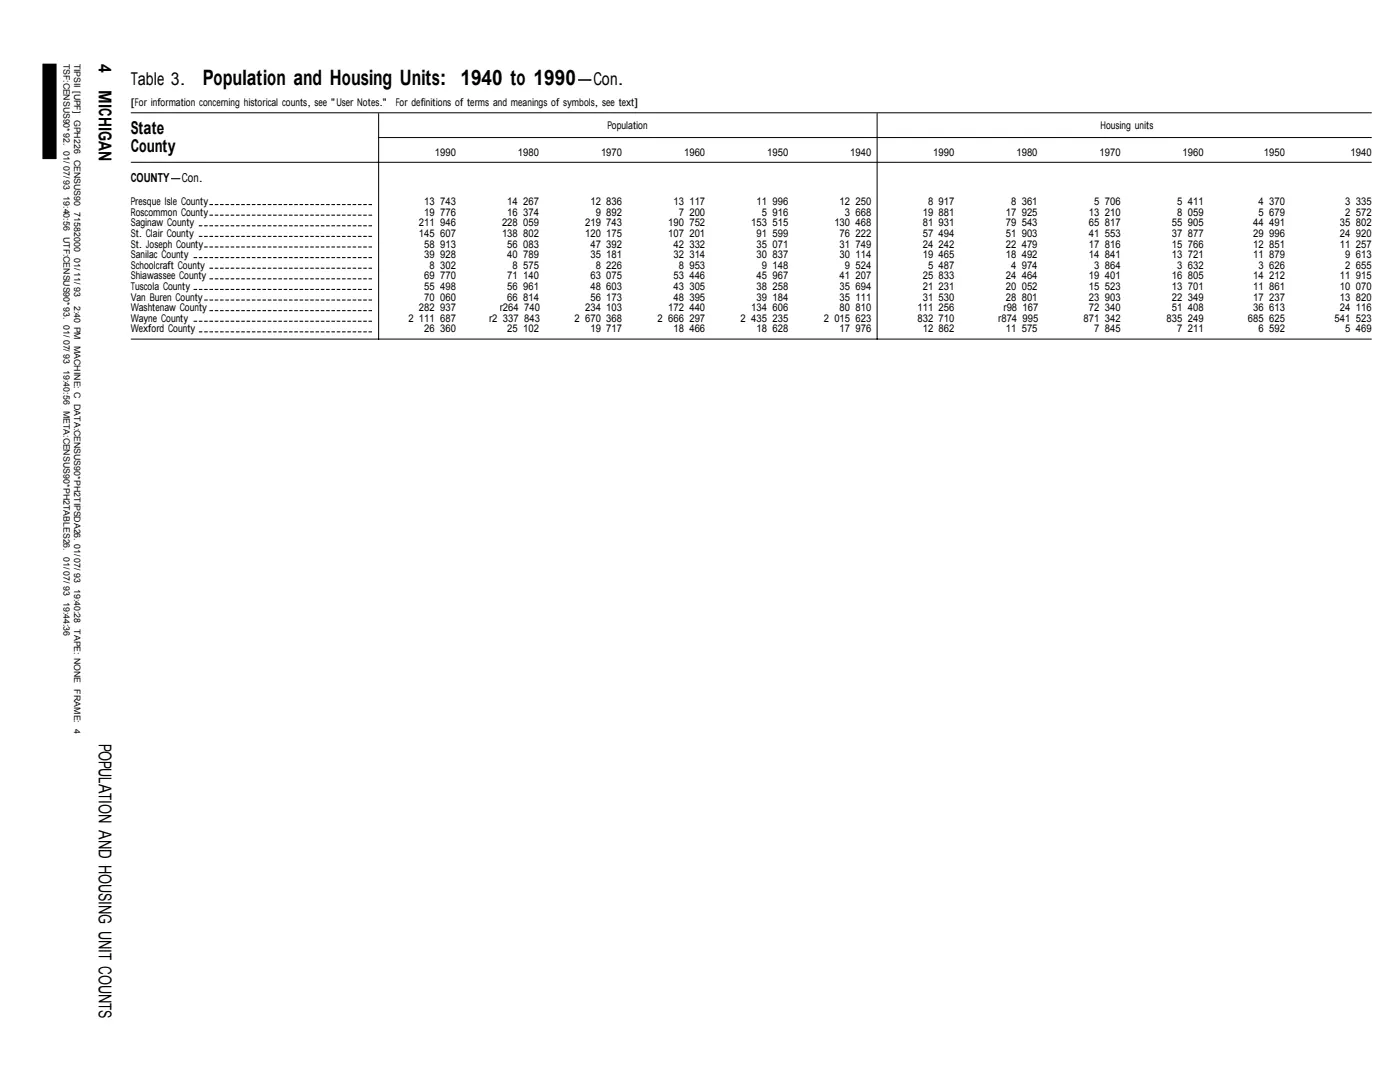
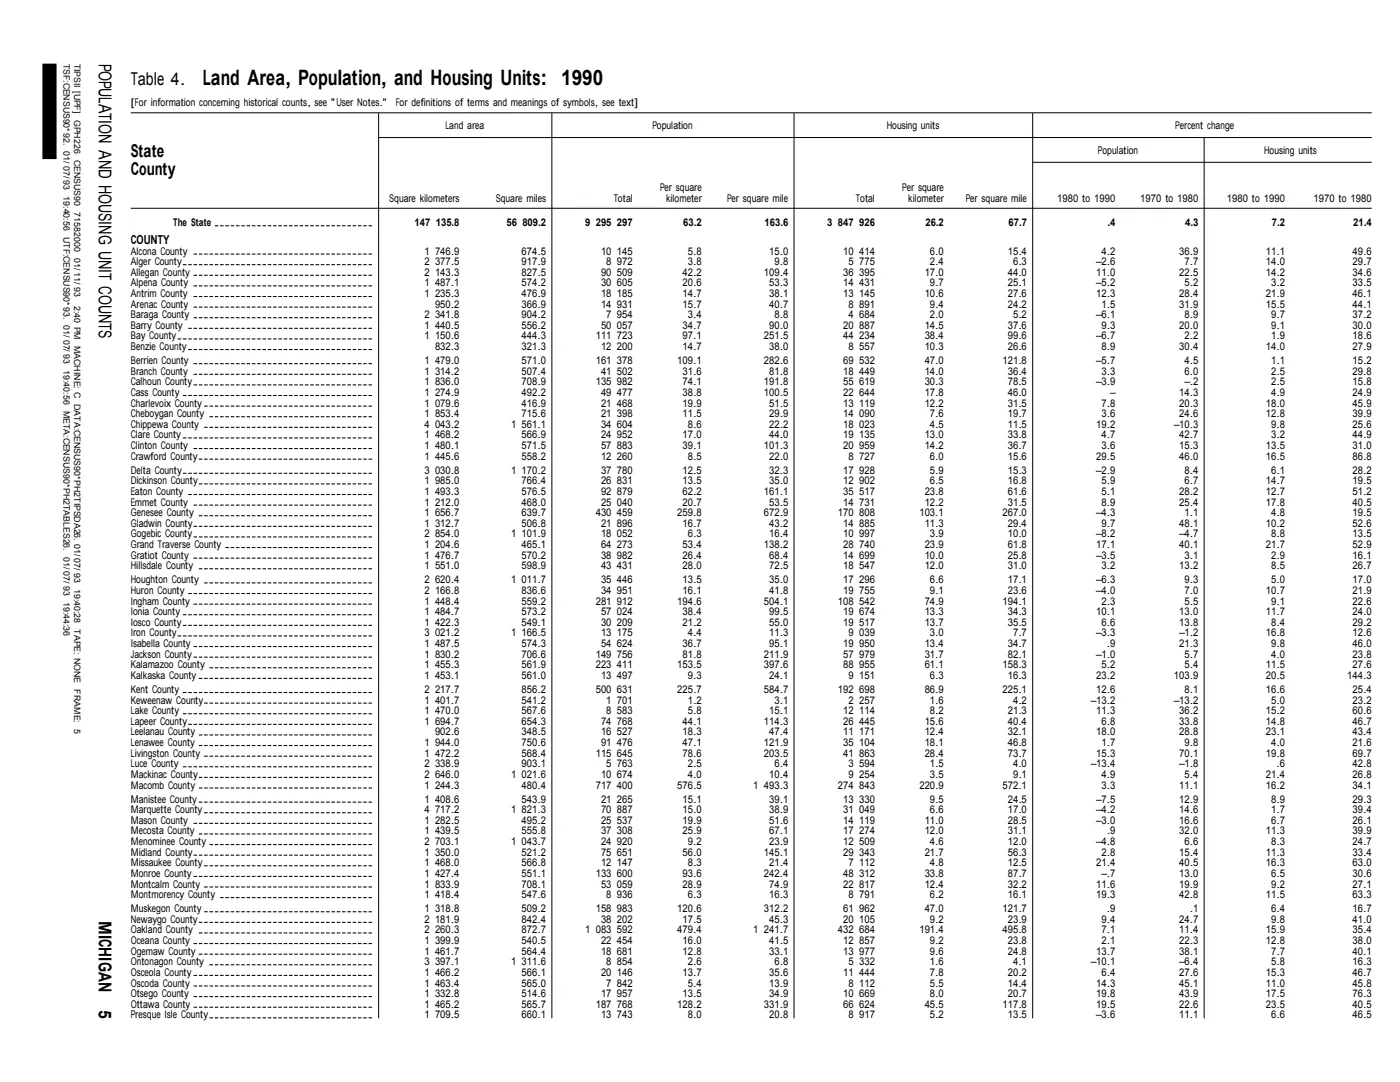
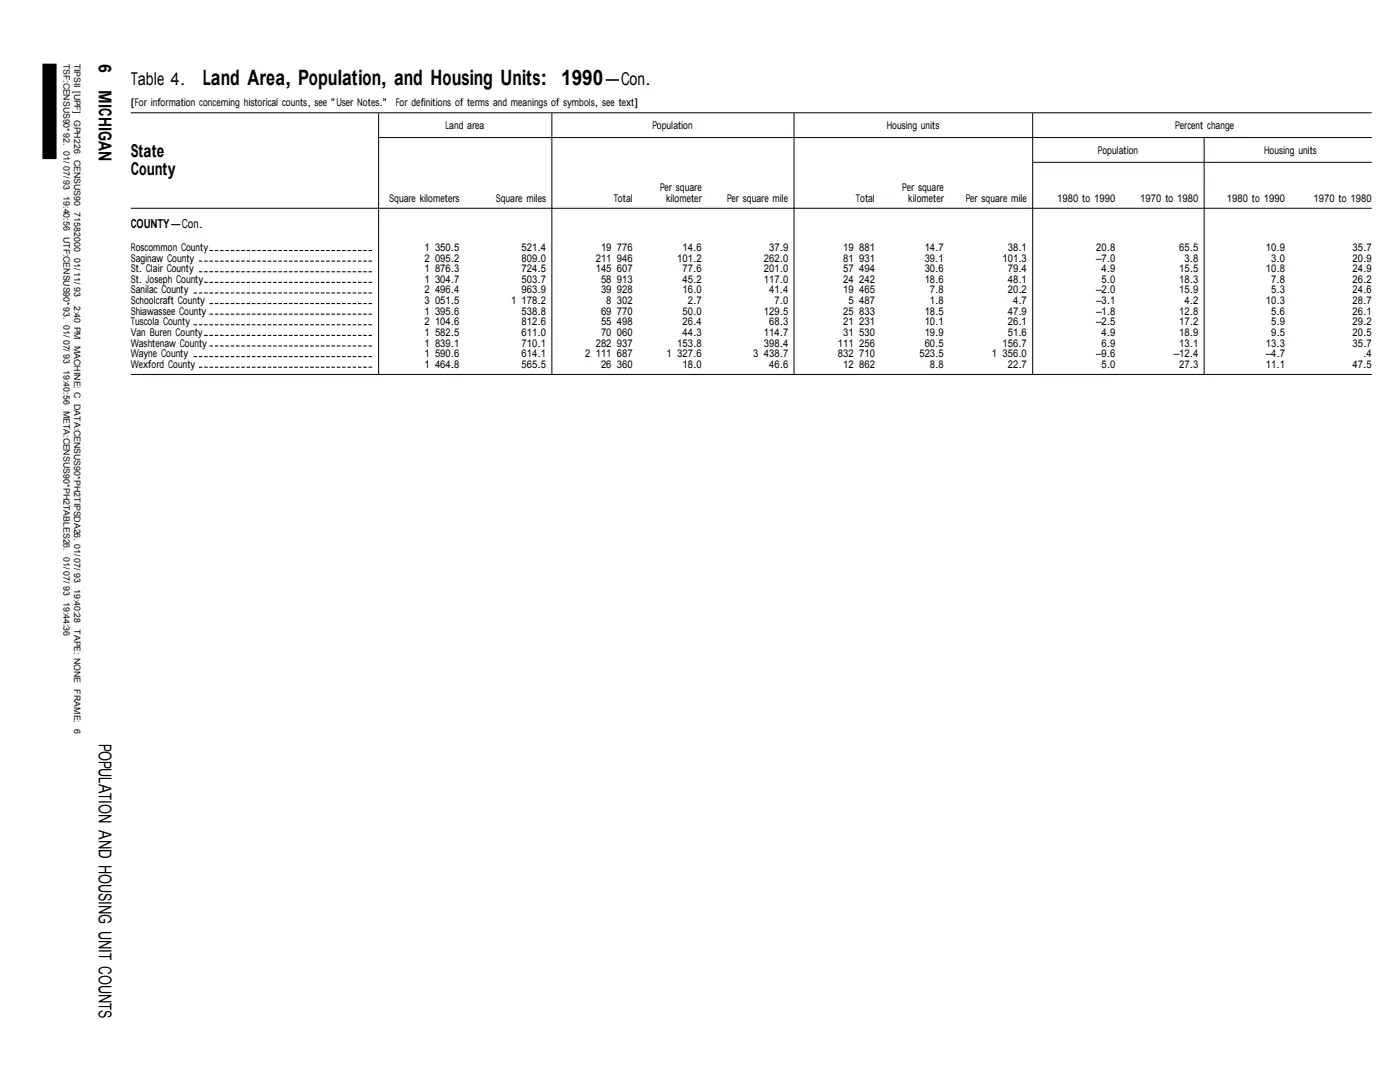
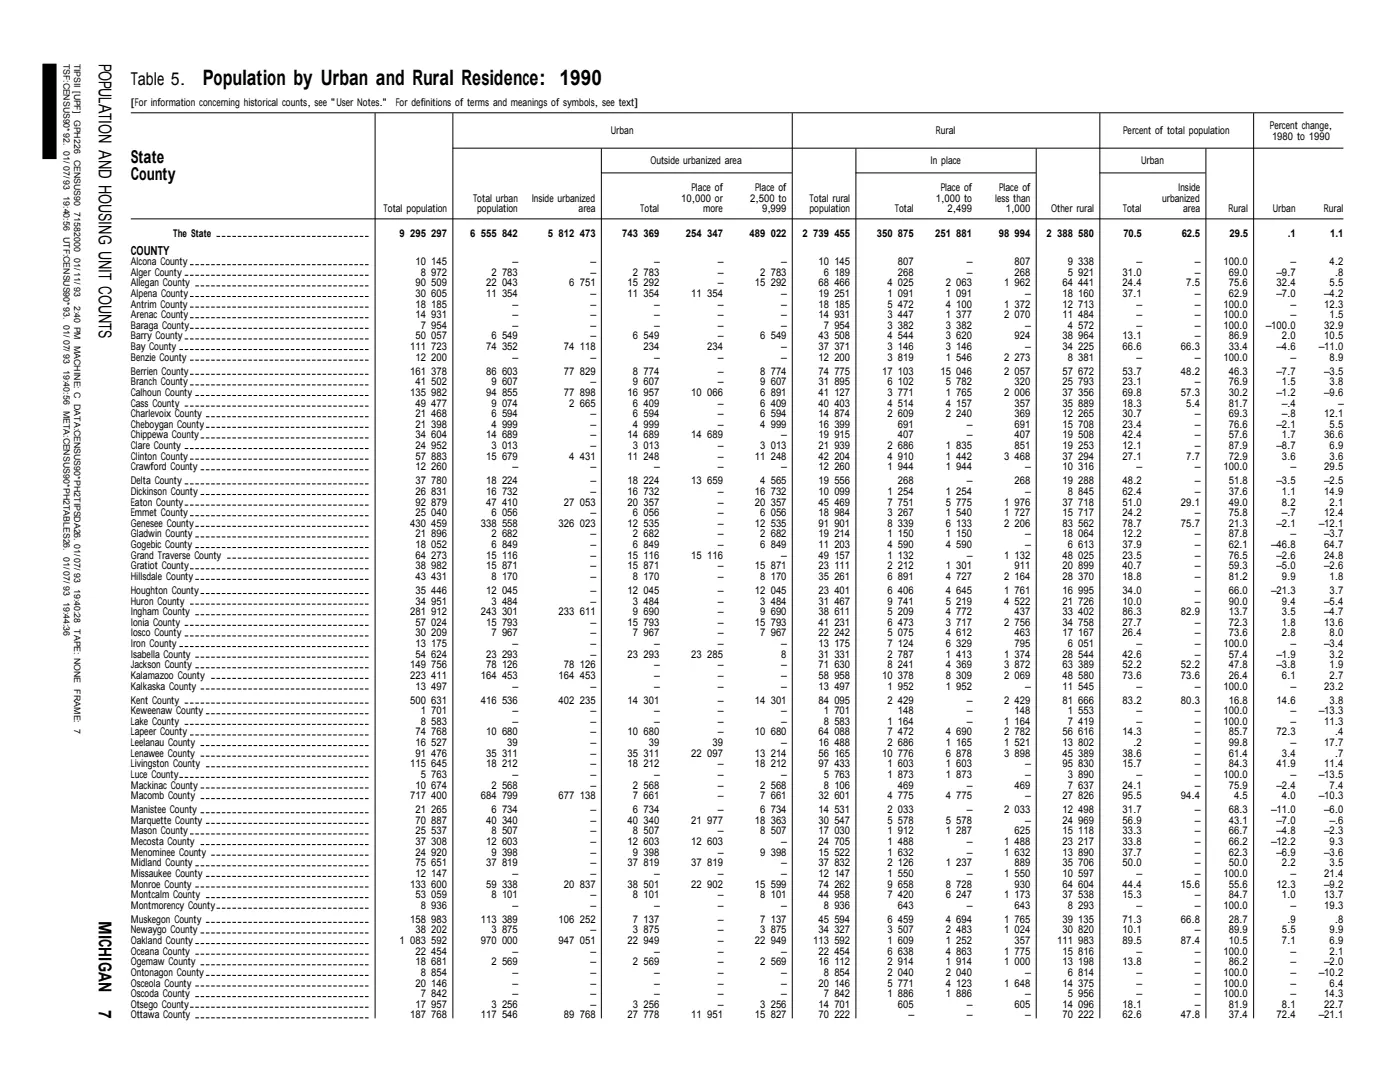
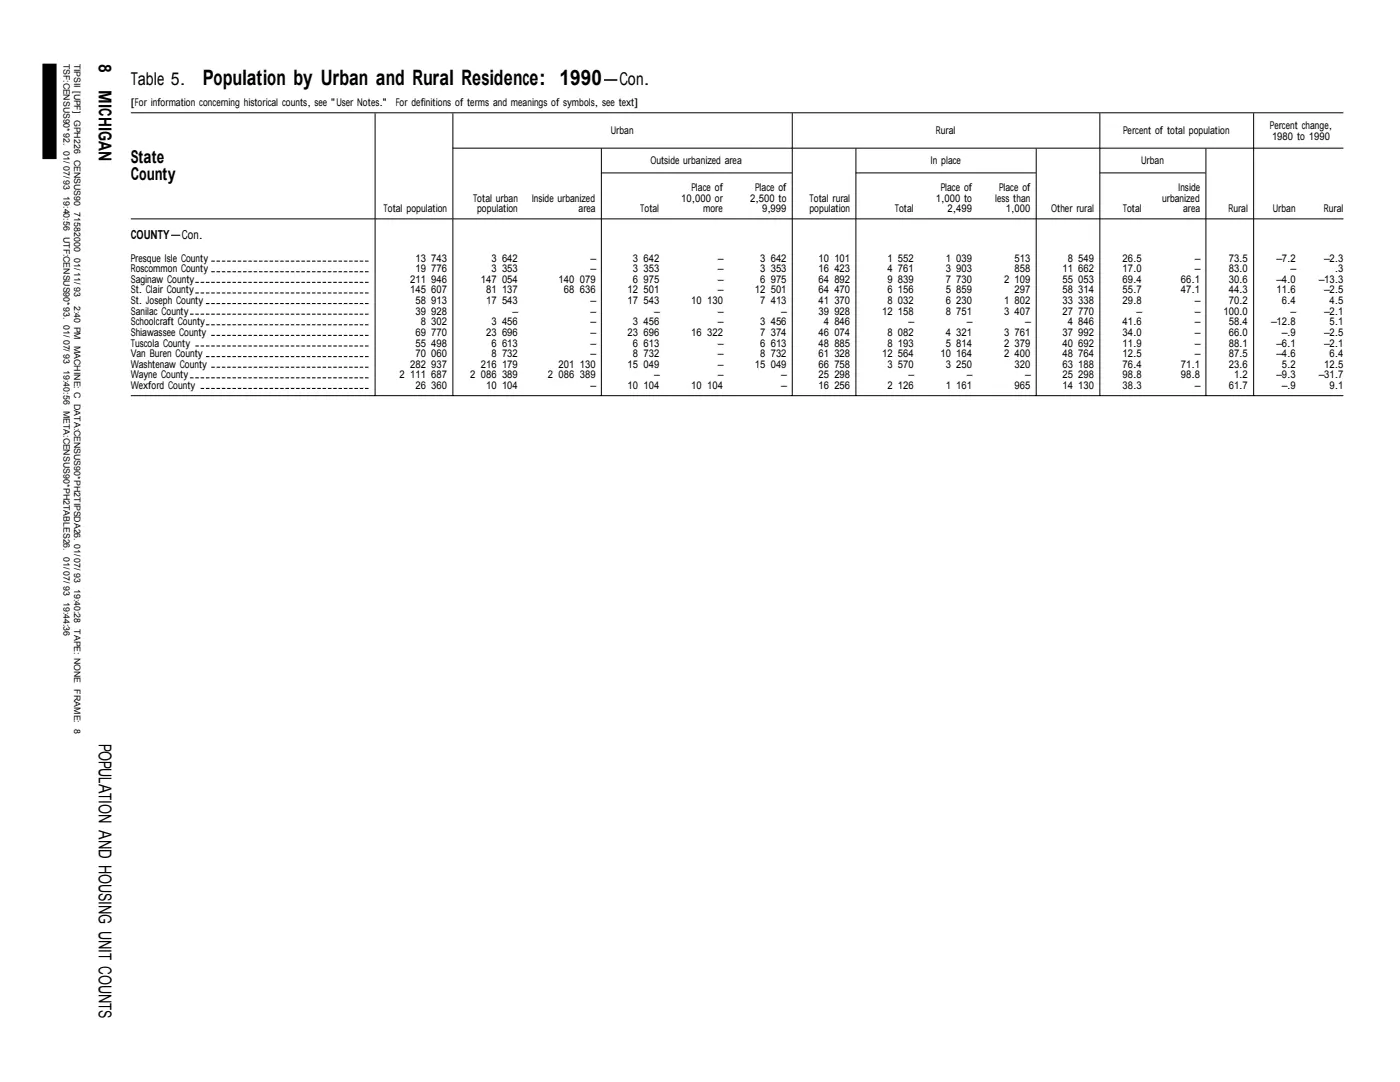
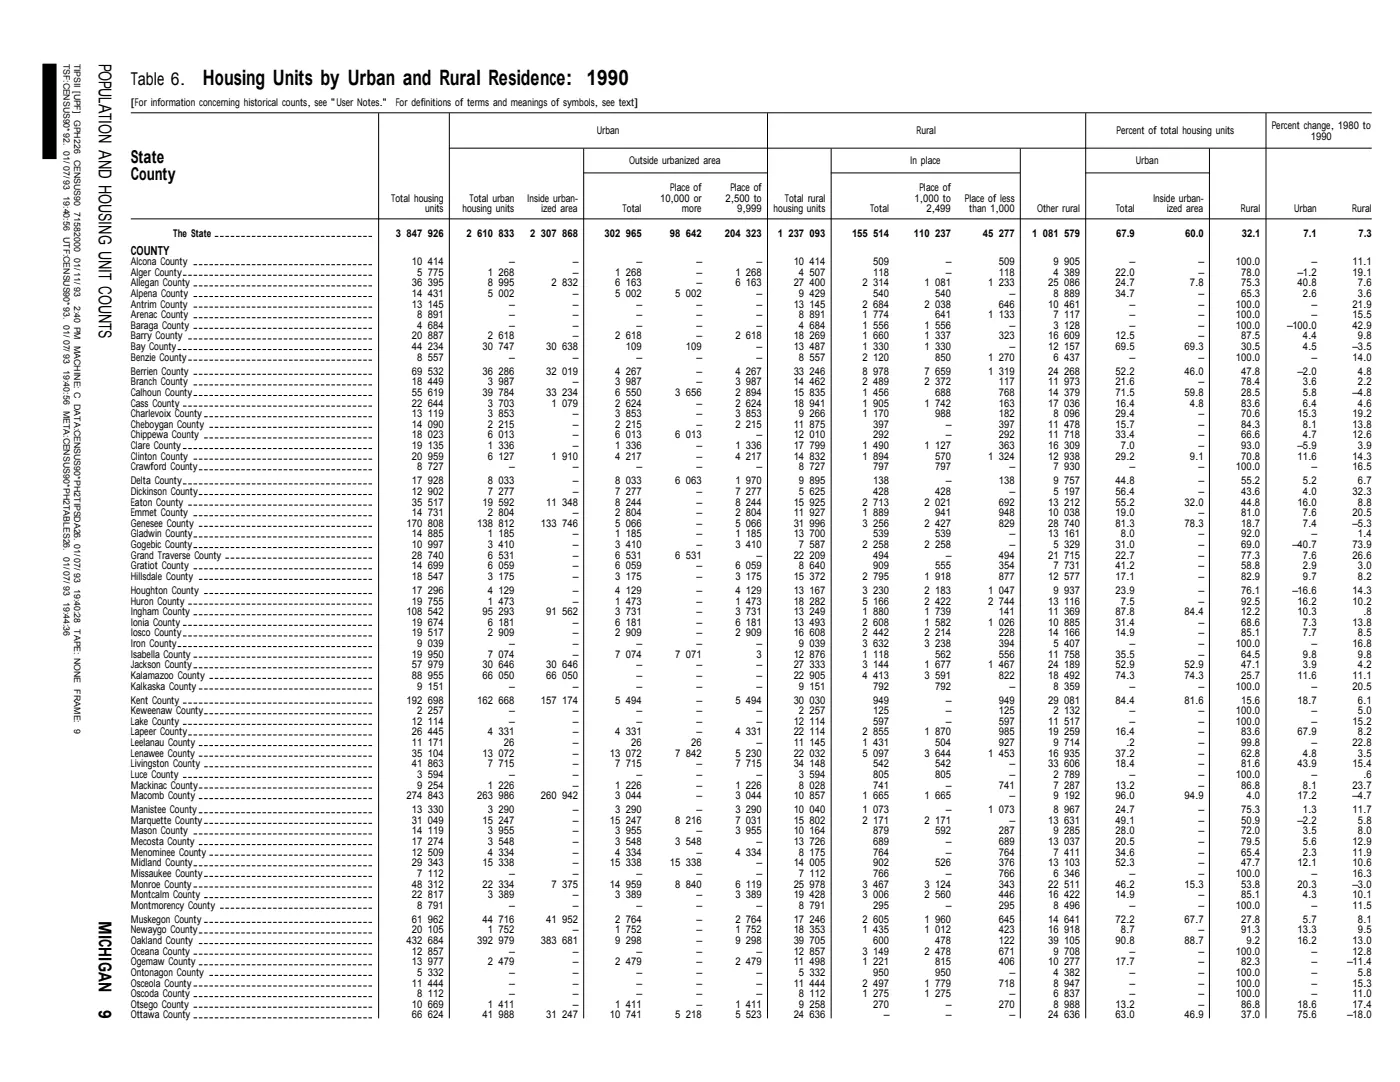
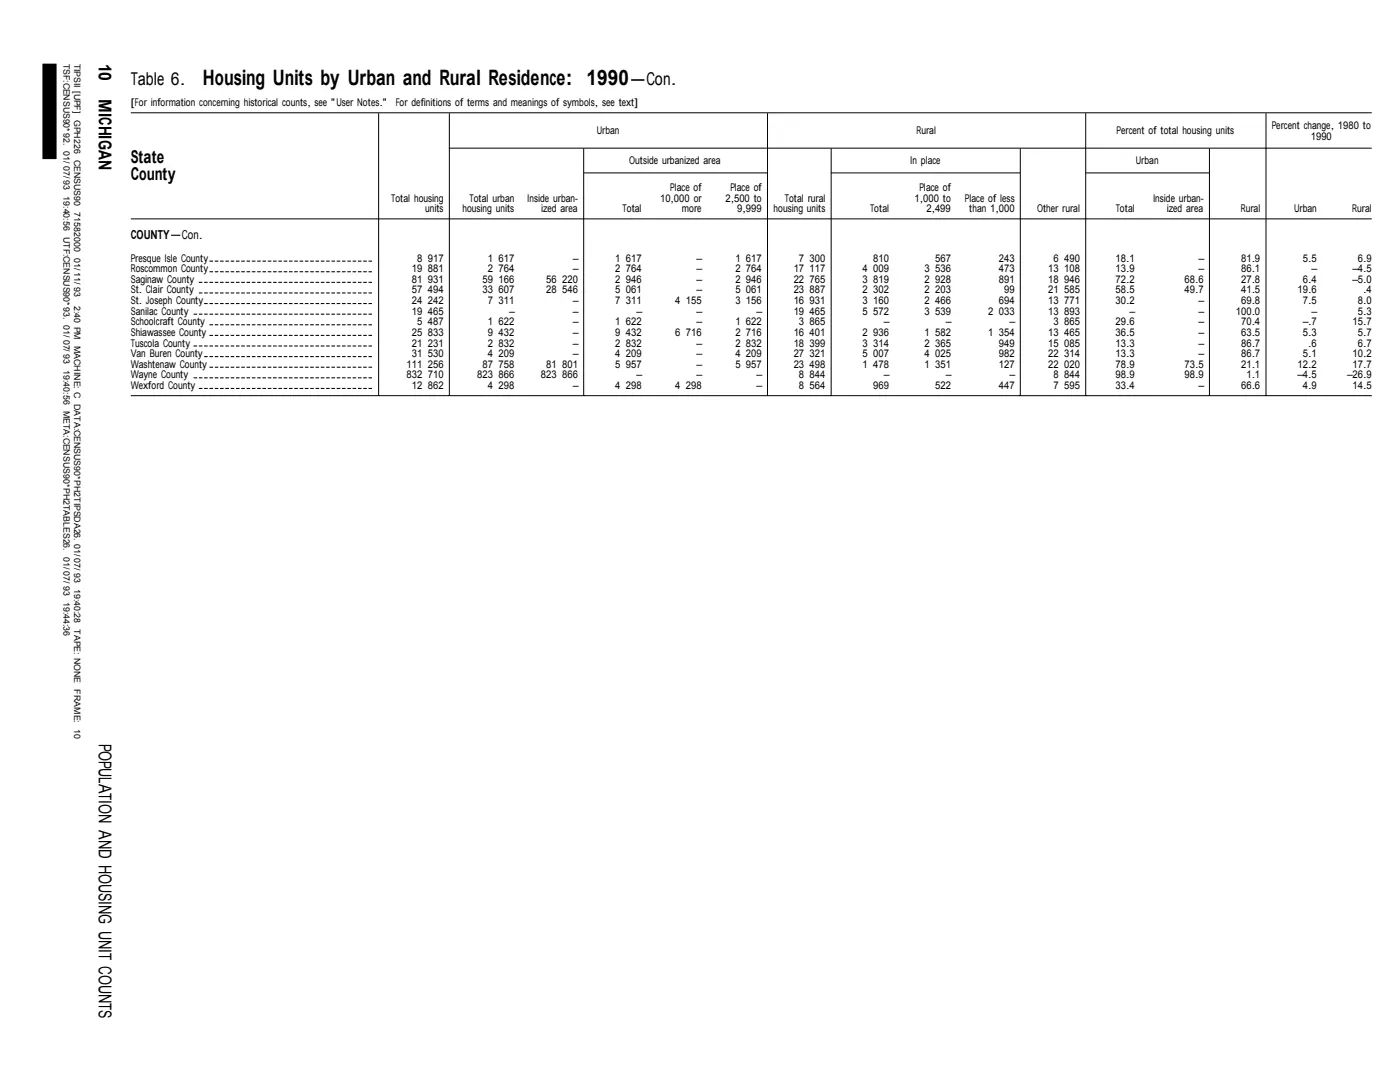
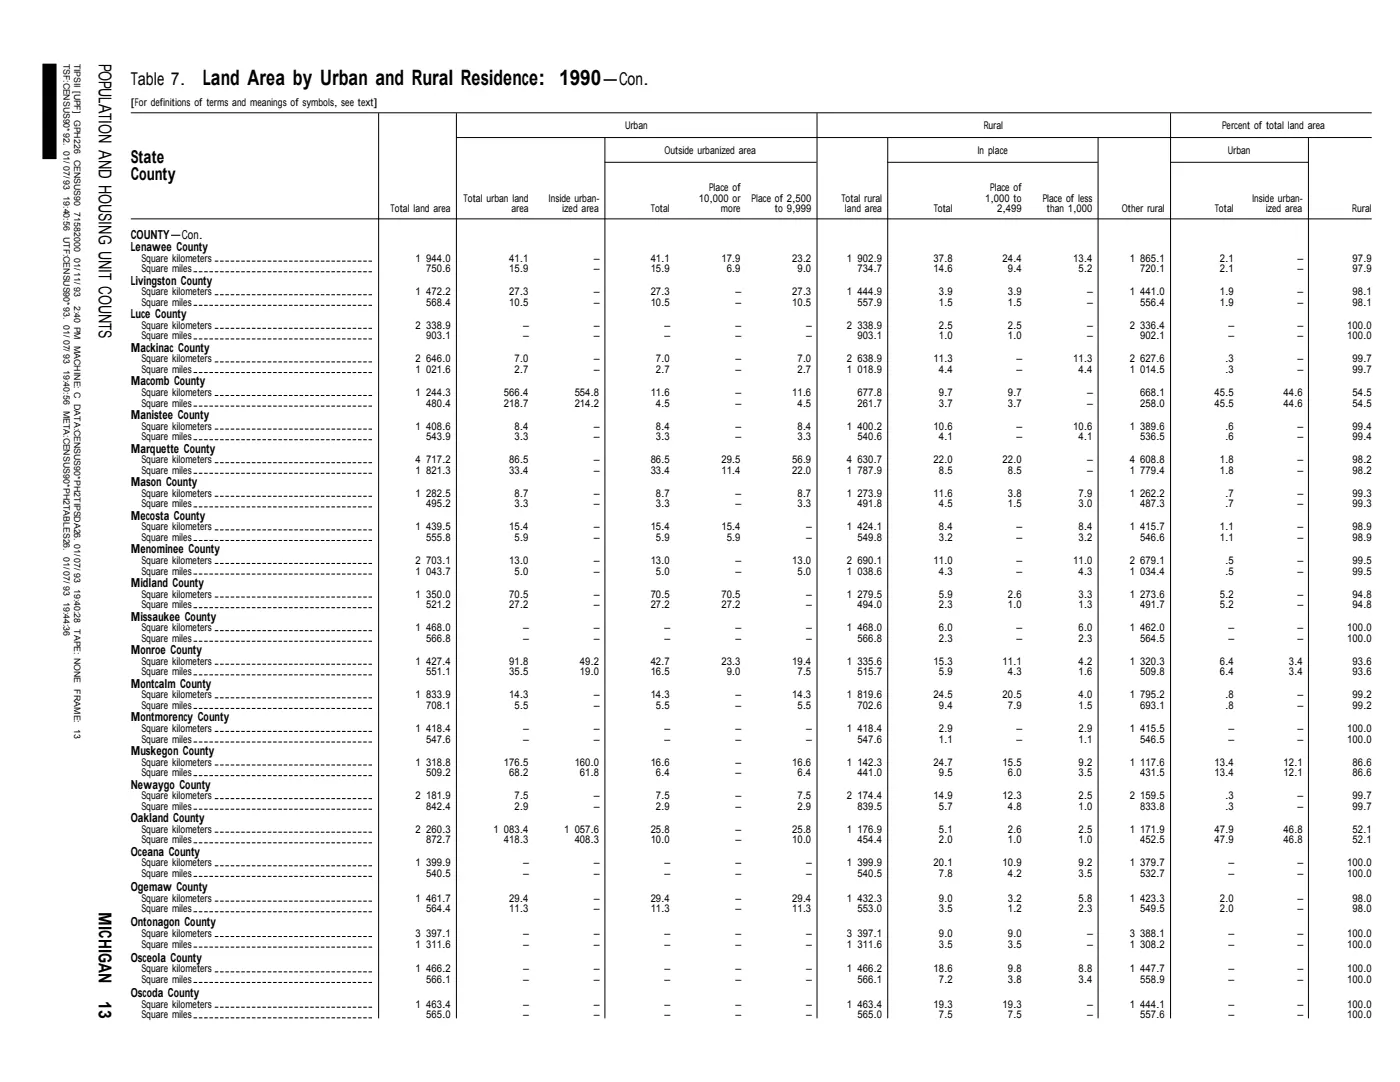
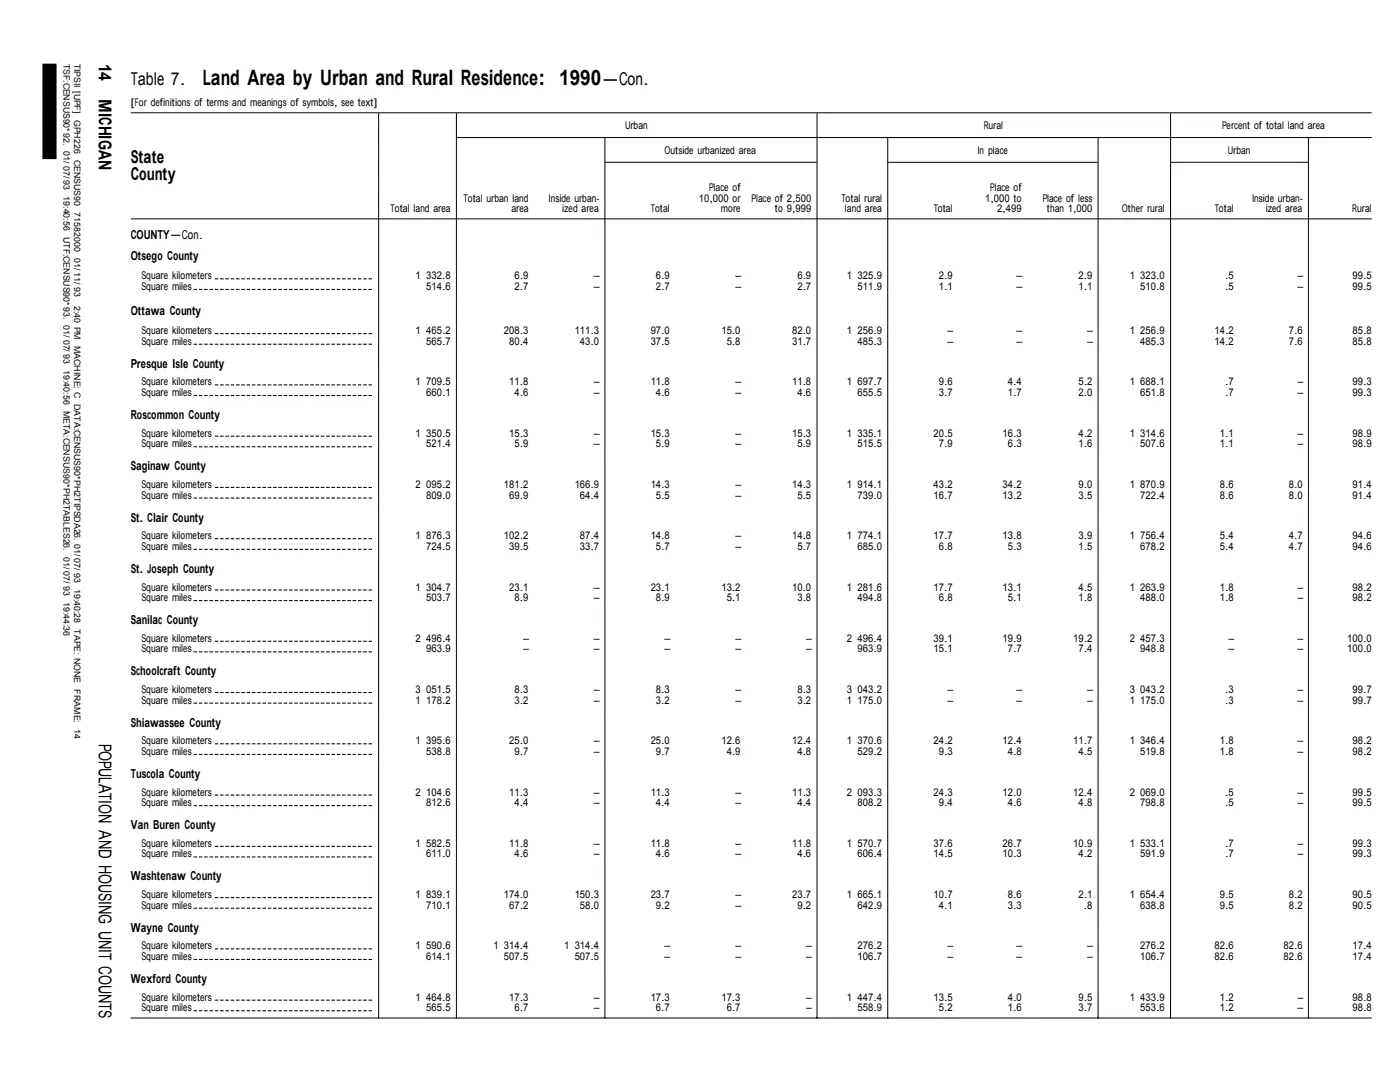
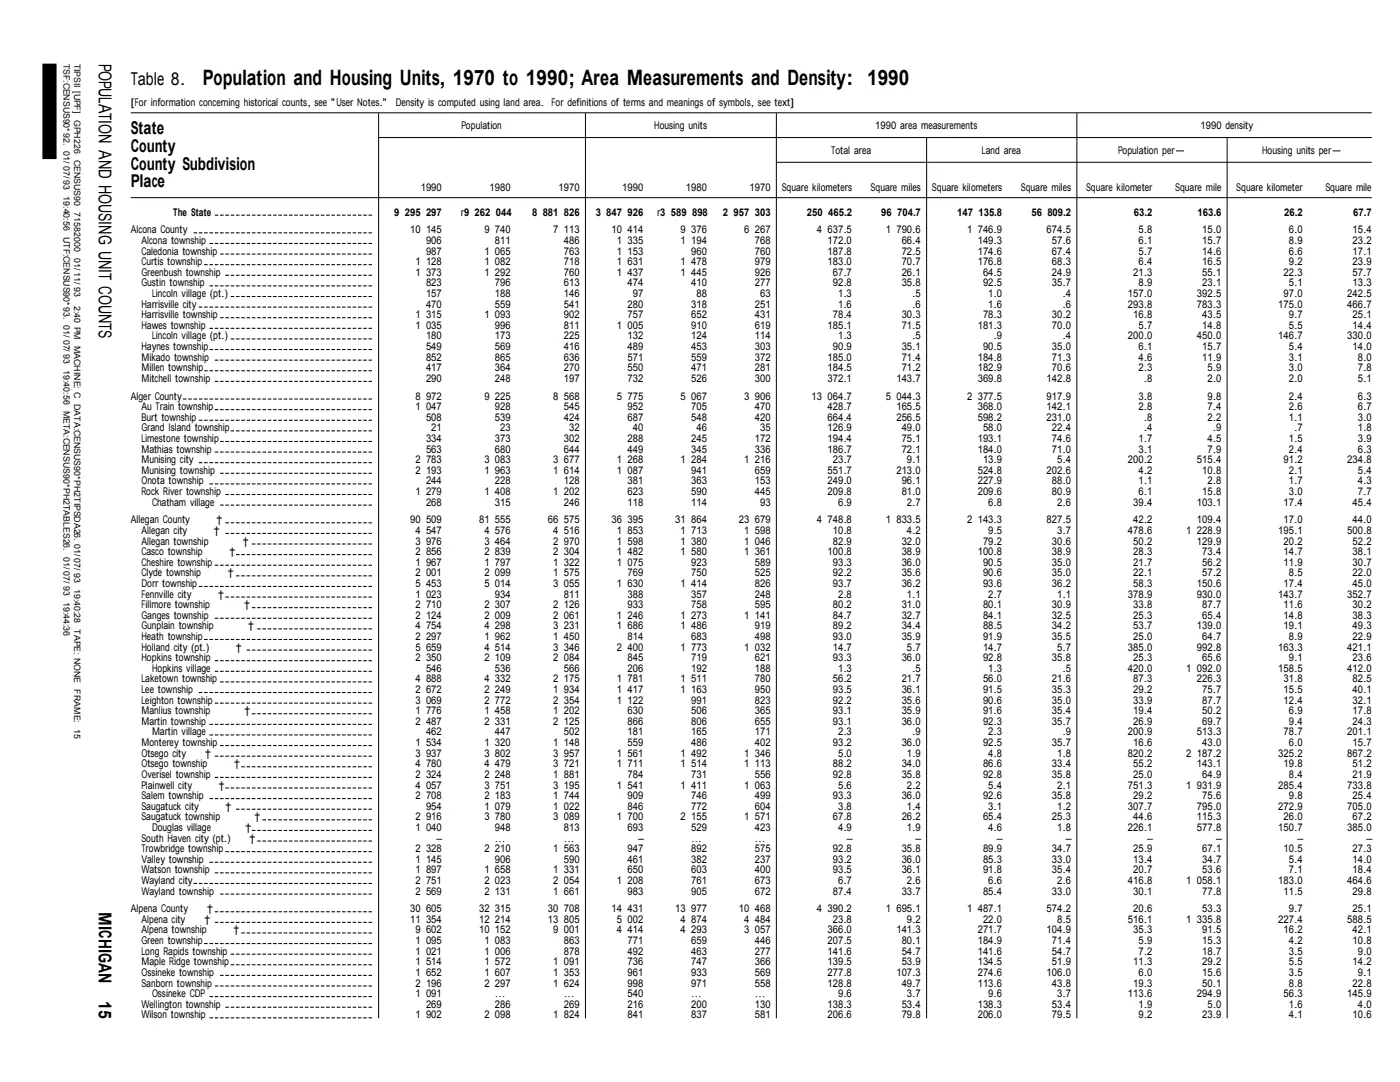
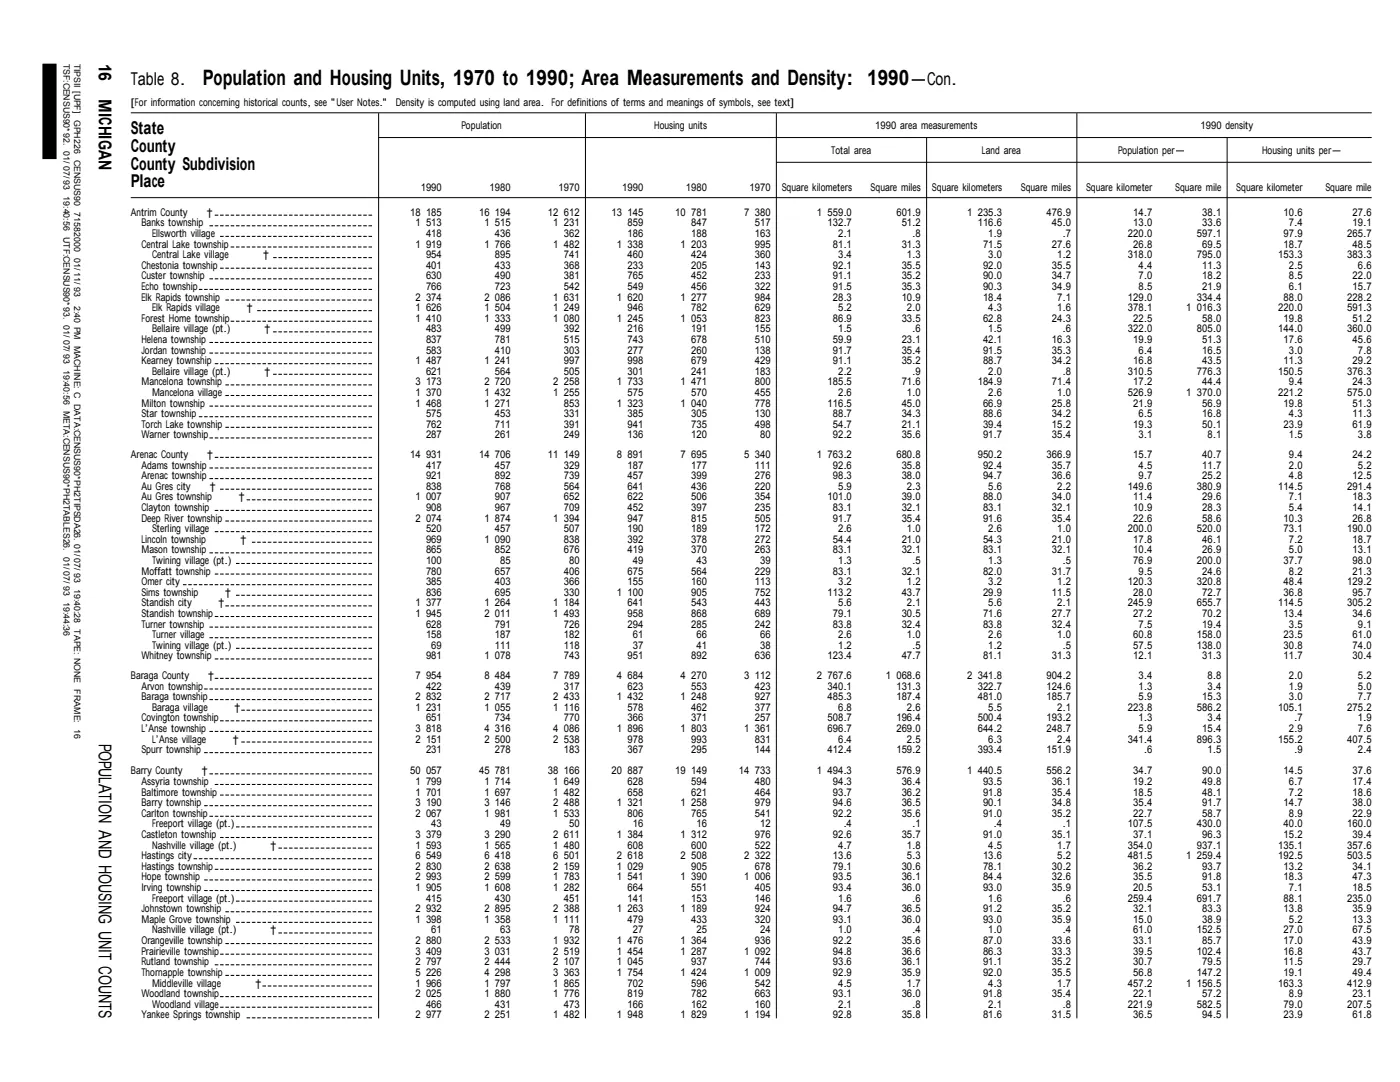
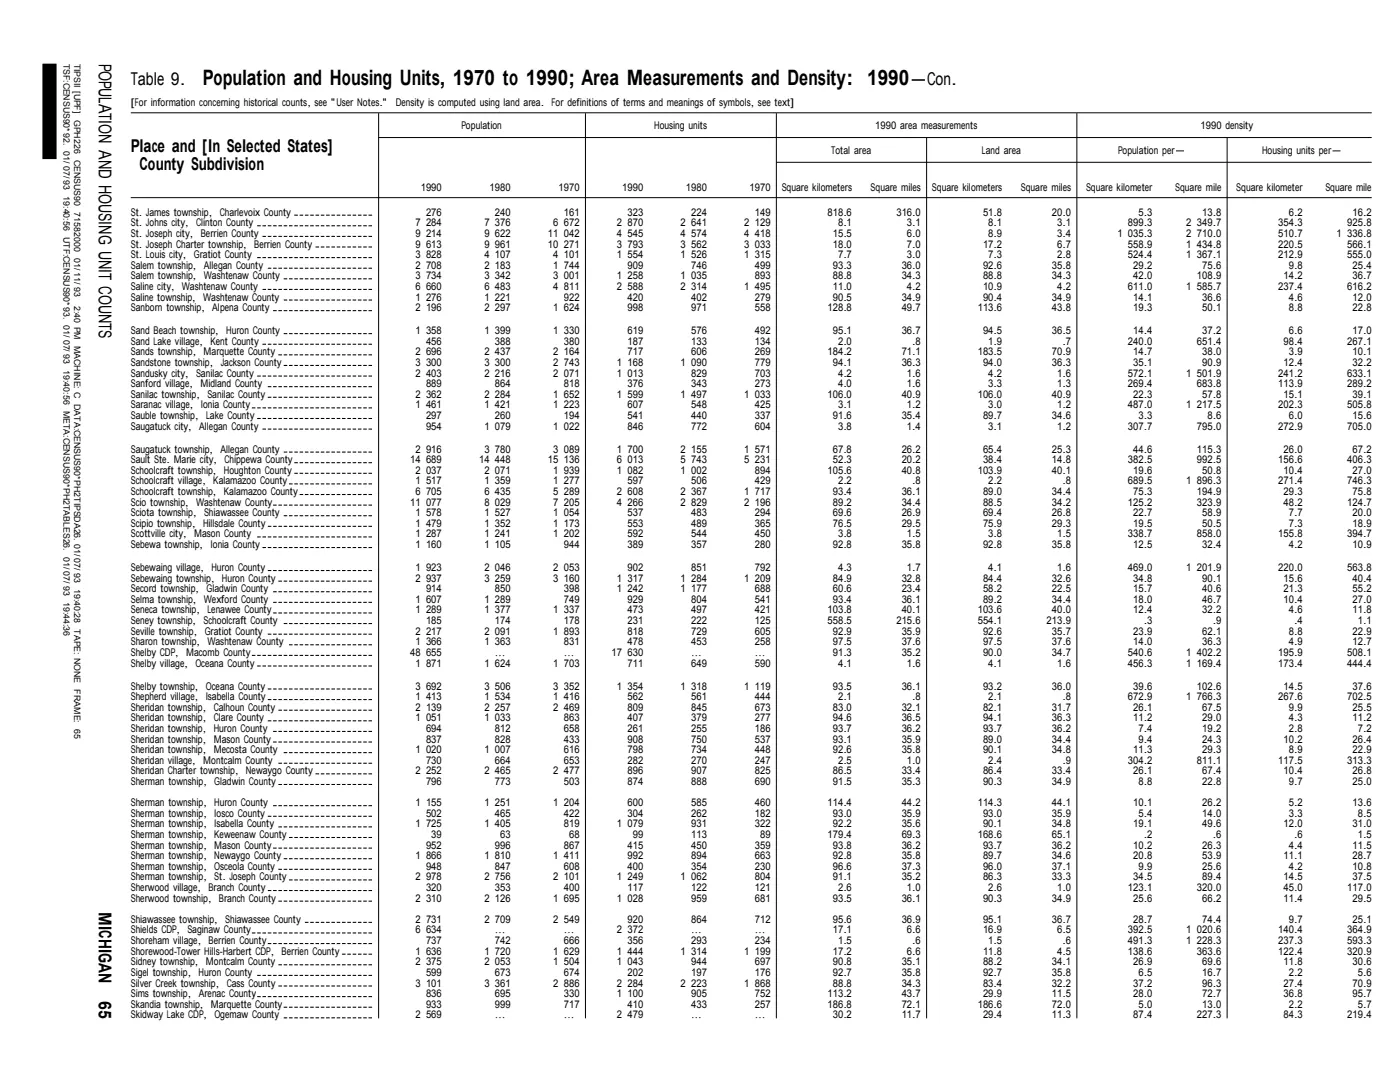
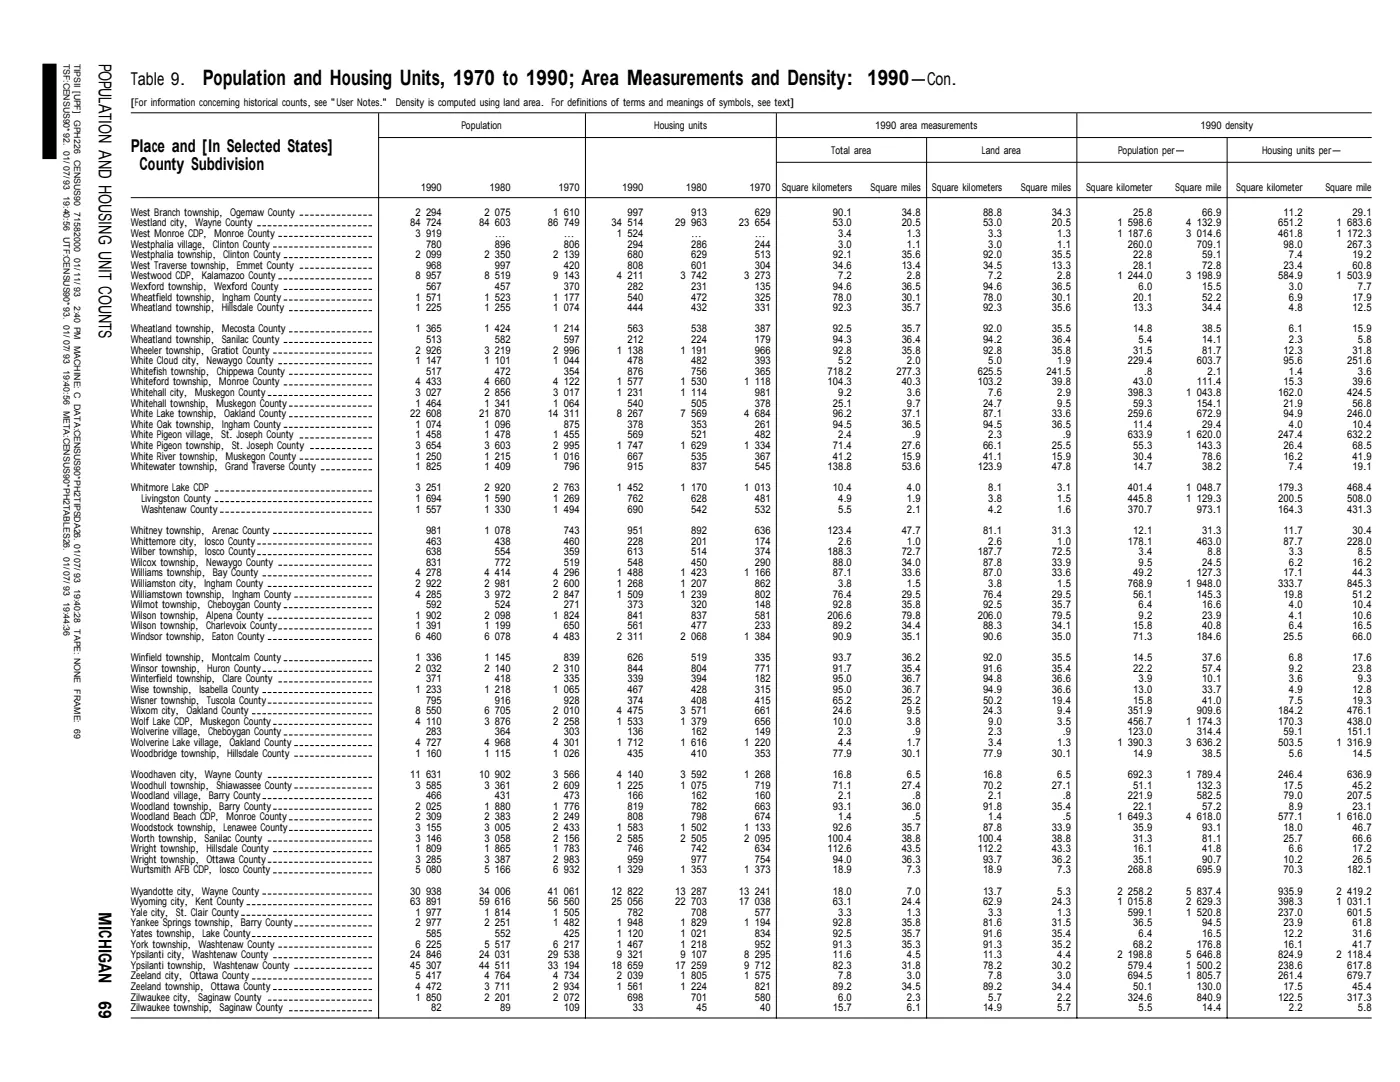
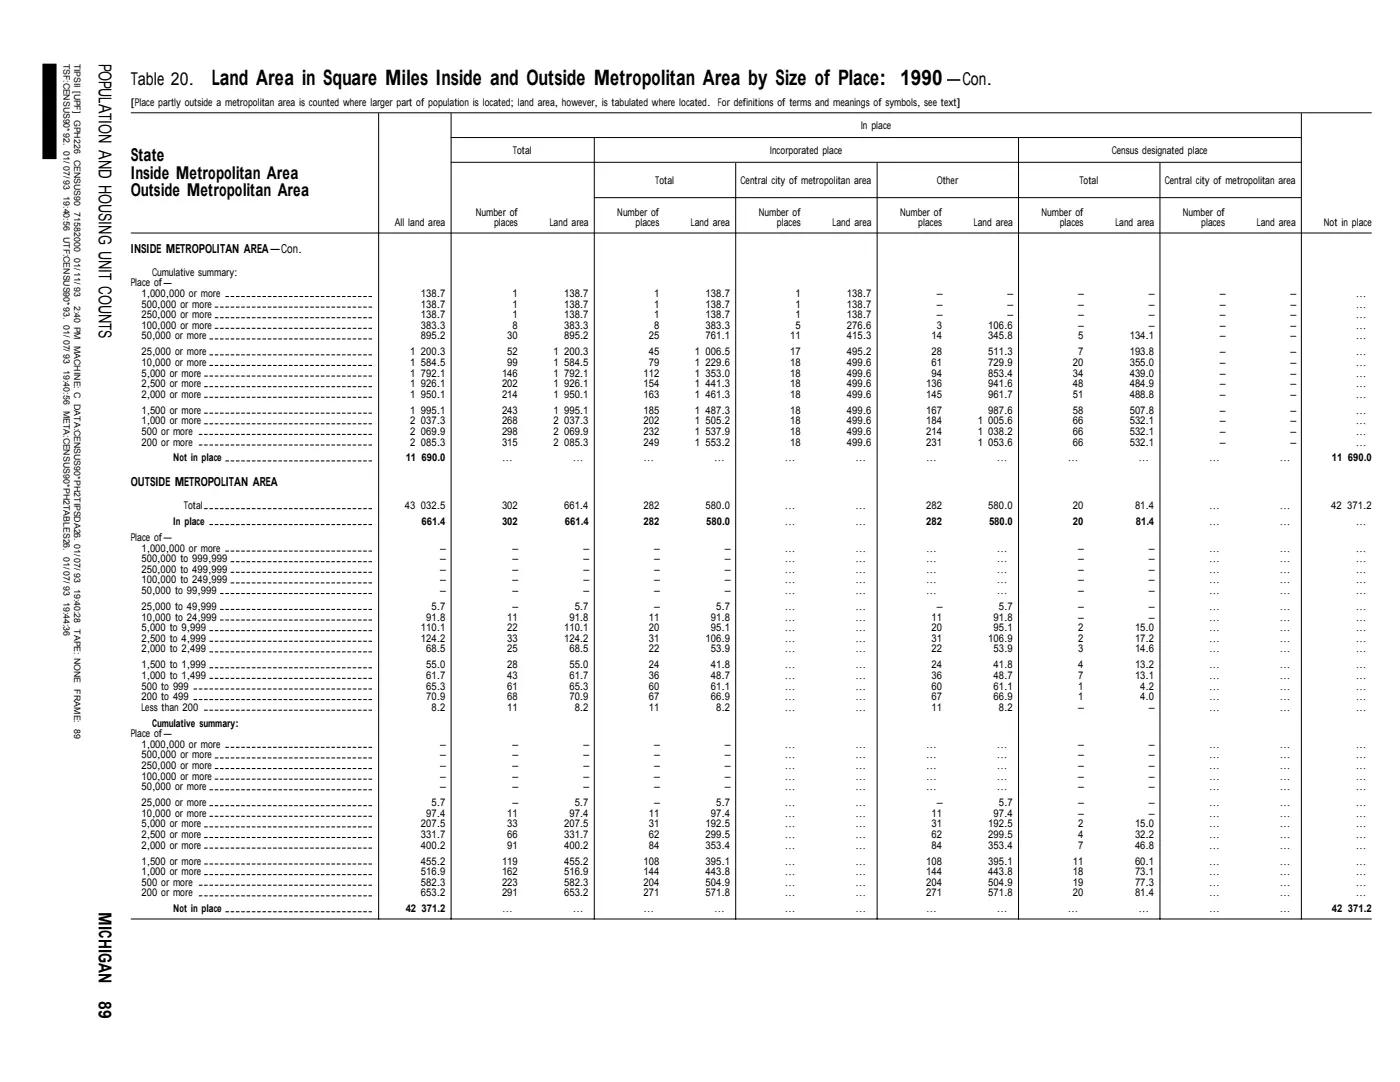
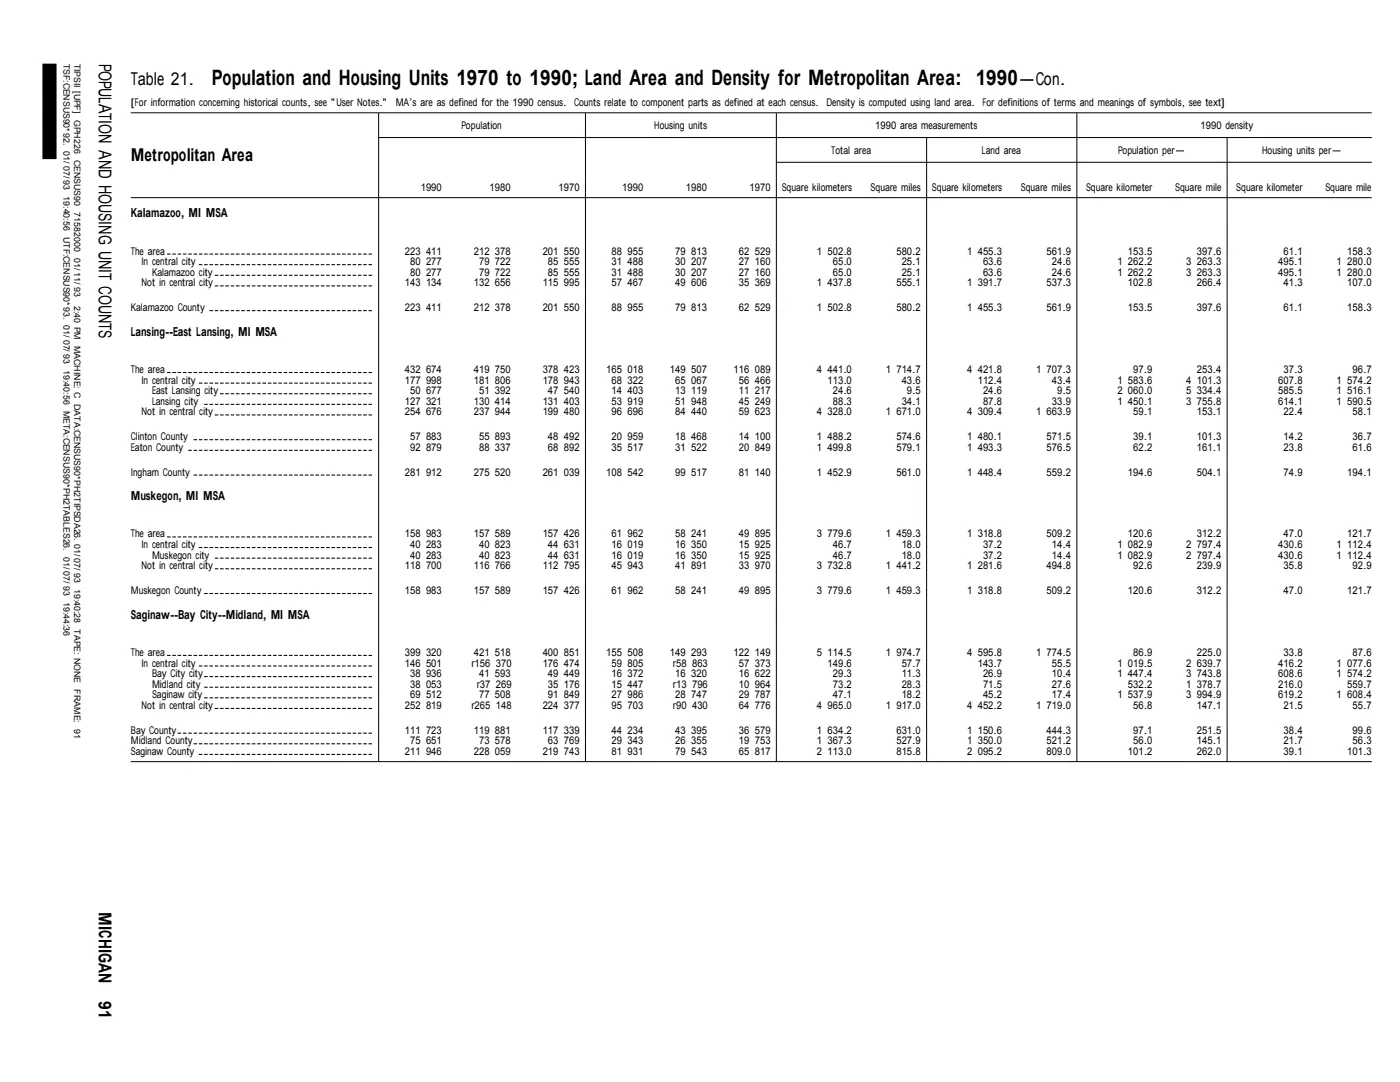
- Table gives Peaine/St. James counts of 81/240 in 1980 and 128/276 in 1990, while independently reproducing the 1970 counts. Corrected 2026-08-04: this citation previously read “table 9 … p. 55,” which is not where these townships are. Table 8 is the county-by-county listing and carries both under Charlevoix County on p. 19; table 9 is the statewide alphabetical listing and splits them across pp. 62 and 65. Folios were read from the running head, confirmed by the neighbouring pages (PDF 34 → 18, PDF 36 → 20).demographics · historical_census · 1990-michigan-population-and-housing-unit-counts
- Project-normalized historical township population table and provenance sidecar.Rows retain a source key and comparability flag. Island totals are transparent calculations only where both modern township rows occur in the same published table. No public copy of this file is known; the archive holds one and can provide it on request.demographics · historical_census · township_population_1890_1990
Added 2 August 2026 · revised 4 August 2026. Recent changes
Cite this article
Beaver Island Archive, “Historical Census township population extracts for Beaver Island, 1890–1990”, https://beaverislandarchive.org/documents/historical-census-township-population-extracts-1890-1990/, accessed [date], citing U.S. Census Bureau, *Population of Michigan by Counties and Minor Civil Divisions*, Bulletin 29 (1900), table 4, p. 6. (and 6 further sources listed on the page).
Last revised 2026-08-04. Fill in [date] with the date you read it — this page is static and cannot know that.
BibTeX for “Historical Census township population extracts for Beaver Island, 1890–1990”RIS for “Historical Census township population extracts for Beaver Island, 1890–1990”