- Dates
- 2021 – 2023
- Eras
- Modern era
- Concepts
- forestsenvironmentwetlandswildlifeconservation
- Within
- Beaver Island archipelago
Summary
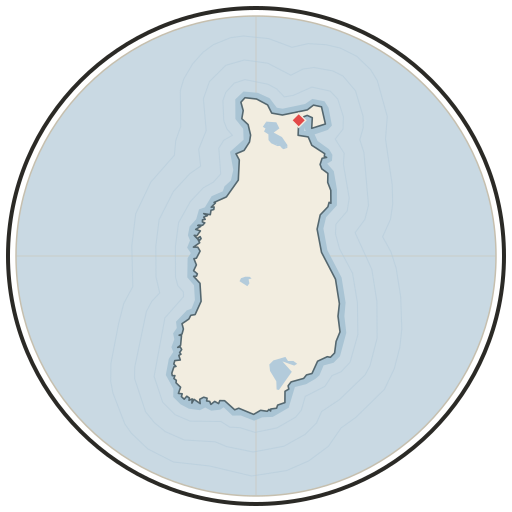
This dataset adds canopy structure to the seven-island current land-cover frame. It records the percentage of each 30 m pixel covered by tree canopy for 2021 and 2023, then summarizes the valid pixels inside each held island polygon. It is useful for comparing the forested character of Fox, Garden, High, Hog, Whiskey, and Beaver Islands even where MNFI occurrence and DNR stand coverage are incomplete.
Canopy percentage is not tree identity. It does not distinguish cedar, pine, spruce, fir, birch, maple, oak, or aspen; it does not provide stand age, tree height, species composition, or a natural-community classification. Those questions remain tied to MNFI field descriptions, DNR comments, historical records, and future inventories.
The 2023 Beaver Island Master Plan’s Map 2.16 is a useful earlier planning reference for why canopy density appears in the natural-resource map set. Its page-level thumbnail is qualitative and should not be read as a measurement that can be directly compared pixel-for-pixel with the NLCD product.
Island-wide canopy statistics
| Island | 2021 mean | 2021 median | 2023 mean | 2023 median | Mean change (percentage points) |
|---|---|---|---|---|---|
| Beaver Island | 65.09% | 77% | 65.50% | 78% | +0.41 |
| Garden Island | 60.70% | 75% | 59.97% | 74% | −0.73 |
| High Island | 70.84% | 82% | 70.56% | 82% | −0.28 |
| Hog Island | 61.37% | 79% | 60.82% | 78% | −0.55 |
| Whiskey Island | 43.46% | 62% | 39.99% | 57% | −3.47 |
| North Fox Island | 70.68% | 81% | 69.77% | 80% | −0.91 |
| South Fox Island | 64.42% | 81% | 64.43% | 81% | +0.01 |
These differences are screening signals, not verified forest loss or gain. The smallest island, Whiskey, is especially sensitive to a small number of 30 m pixels and boundary effects. The normalized index preserves valid-pixel counts, percentiles, and the number of pixels changing by at least five points.
Canopy over 2021 NLCD forest pixels
As a cross-check against the companion land-cover layer, the extractor also computes canopy statistics over pixels classified by 2021 Annual NLCD as deciduous, evergreen, or mixed forest (classes 41–43):
| Island | 2021 mean canopy on NLCD forest pixels |
|---|---|
| Beaver Island | 76.17% |
| Garden Island | 75.66% |
| High Island | 81.83% |
| Hog Island | 81.39% |
| Whiskey Island | 73.12% |
| North Fox Island | 80.52% |
| South Fox Island | 82.22% |
This is a same-grid comparison between two remote-sensing products. It is not an MNFI EO overlap and should not be used to assign canopy values to a named forest community or parcel.
Connectivity to tree, wildlife, and physical records
The canopy layer strengthens several existing connections:
- The Annual NLCD land-cover extraction supplies the seven-island forest, wetland, barren, developed, and water classes; canopy percentage adds structure within and outside those broad forest classes.
- MNFI Report 2017-11 supplies species lists, tree DBH and age measurements, deer-browse observations, windthrow, and community-specific descriptions on Beaver, Garden, High, and Hog. Canopy statistics provide comparative context, not replacement observations.
- The DNR public forest inventory supplies stand-level canopy and cover-type fields only where its public-inventory layer returned polygons—424 stands on Beaver in the current snapshot. The canopy WMS covers all seven island frames, so it is useful for identifying where Fox-Island-specific inventory research is most needed.
- SSURGO, NWI, EGLE hydric soils, geology, circa-1800 land cover, and GLO records remain separate layers. A high canopy percentage can occur over different soils, wetlands, or historical vegetation classes and should not be treated as evidence of any one of them.
Evidence limits
The raw WMS GeoTIFFs and exact-island masked rasters are retained for both years. Value 102 is preserved as no data; no missing canopy value is imputed. Pixel means and medians are approximate summaries of a 30 m remote-sensing product. They do not establish ownership, habitat quality, species abundance, forest age, carbon stock, legal wetland status, or the cause of any apparent 2021–2023 change.
See also
- Annual NLCD land cover across the seven-island archipelago, 2021 and 2025
- Michigan DNR public forest inventory stand cover types, 2026 snapshot
- MNFI Natural Community Surveys of Beaver Island Archipelago, 2017
- MNFI soil, vegetation, tree, and wildlife crosswalk, 2017
- Forest types and tree history
- Wildlife and bird life
- Wetlands, inland waters, and hydrology
Sources
- The source provides 30 m canopy-percentage values with an explicit no-data value of 102. The project retains raw windows and exact-island masked rasters.research · tree_canopy · indices · nlcd_tree_canopy_island_2021_2023_2026-08-02
- The capabilities response confirms the CONUS tree-canopy layer and annual time positions through 2023.research · tree_canopy · sources · nlcd_tree_canopy_wms_capabilities_2026-08-02
- Project-generated normalized canopy rasters and provenance.Records the held island-boundary checksum, NLCD land-cover index checksum, capabilities checksum, requests, and output method. No public copy of this file is known; the archive holds one and can provide it on request.research · tree_canopy · indices · nlcd_tree_canopy_island_2021_2023_2026-08-02.provenance
- The same seven-island geometry is used for the Annual NLCD land-cover and ecology crosswalk outputs.osm · islands
- Project-generated Beaver Island Master Plan ecology map-plate evidence index, 2017–2024.Described in this archive: Beaver Island Master Plan ecology map-plate evidence, 2017–2024.The 2023 plan’s Map 2.16 records a qualitative relative-density tree-canopy planning map for Beaver Island. It is compared here as planning context, not as a numeric or species-equivalent source. No public copy of this file is known; the archive holds one and can provide it on request.research · island_governance · master_plan_map_plate_evidence_2017_2024
Added 3 August 2026. Recent changes
Cite this article
Beaver Island Archive, “NLCD tree-canopy percentage across the seven islands, 2021 and 2023”, https://beaverislandarchive.org/documents/nlcd-tree-canopy-island-2021-2023/, accessed [date], citing U.S. Geological Survey / Multi-Resolution Land Characteristics Consortium, NLCD CONUS Tree Canopy product, retrieved through the official time-enabled OGC WMS (2021 and 2023). (and 4 further sources listed on the page).
Last revised 2026-08-03. Fill in [date] with the date you read it — this page is static and cannot know that.
BibTeX for “NLCD tree-canopy percentage across the seven islands, 2021 and 2023”RIS for “NLCD tree-canopy percentage across the seven islands, 2021 and 2023”